

1. DANISH AS A PARTICULARLY DIFFICULT LANGUAGE
Recent years have seen a growing interest in formal studies of phonetic reduction phenomena in spontaneous spoken language. This interest has been promoted by the availability of large corpora of spontaneous spoken data, which makes it possible to make generalizations on a more solid quantitative basis. In Nordic linguistics, this interest has resulted in e.g. the recent special volumes in the Copenhagen Studies in Language series (Heegård & Juel Henrichsen Reference Heegård and Henrichsen2012, Reference Heegård and Henrichsen2013) and a special issue of the journal Danske Talesprog (vol. 12, 2012), dissertations (Pharao Reference Pharao2010a, Schachtenhaufen Reference Schachtenhaufen2013), and a number of publications by Charlotte Gooskens and research associates (e.g. Gooskens et al. Reference Gooskens, van Heuven, van Bezooijen and Pacilly2010, Hilton, Schüppert & Gooskens Reference Hilton, Schüppert and Gooskens2011, Schüppert Reference Schüppert2011, Schüppert et al. Reference Schüppert, Gooskens, Hilton and van Heuven2012). A special point of interest has been the case of Danish as a language somehow uniquely prone to reductions – a ‘sloppy’ language, even. This view has been proposed on the basis of comparisons between Danish and the other mainland Scandinavian languages, Norwegian and Swedish, and on the basis of studies of Danish L1 acquisition.
The three mainland Scandinavian languages are to a large extent mutually intelligible both in written and in spoken form (Maurud Reference Maurud1976, Bø Reference Bø1978, Delsing & Lundin Åkesson Reference Delsing and Åkesson2005, Gooskens et al. Reference Gooskens, van Heuven, van Bezooijen and Pacilly2010, Schüppert & Gooskens Reference Schüppert, Gooskens, Heselwood and Upton2010, Schüppert Reference Schüppert2011), although substantial phonological, morpho-syntactic and lexical differences exist between them (see Hilton et al. Reference Hilton, Schüppert and Gooskens2011 for references). However, Delsing & Lundin Åkesson (Reference Delsing and Åkesson2005) document that the mutual intelligibility between Norwegians, Swedes and Danes has decreased, and Danish seems particularly difficult to understand for fellow Scandinavians. In line with this, Bø (Reference Bø1978) and Börestam (Reference Börestam1987) reported an asymmetrical relationship between Danish and Swedish: Swedes perform more poorly in comprehension tests of spoken Danish than Danes do in tests of spoken Swedish (see Gooskens et al. Reference Gooskens, van Heuven, van Bezooijen and Pacilly2010).
Studies like these have led to speculations as to why Danish causes comprehension problems. Some have pointed to the fact that Danish pronunciation has undergone a very rapid development during the last century, leading to an even larger discrepancy between spelling and pronunciation (Brink & Lund Reference Brink and Lund1975, Vikør Reference Vikør1993). A large number of assimilation and lenition processes have blurred the correspondences between letter and sound, making it more difficult for other Scandinavians to, in Teleman's (Reference Teleman1987:76) words, ‘find the letters behind the sounds’. Grønnum (Reference Grønnum, Jacobsen, Bleses, Madsen and Thomsen2003) points to a number of phonetic features that make Danish stand out as typologically deviant from neighbouring Scandinavian languages, for example, weak syllable codas and unstressed syllables without any distinct vowel sound.
A growing body of work has begun to investigate the effects that these phonological phenomena may have on L1 learners of Danish. Bleses & Basbøll (Reference Bleses, Basbøll, Schmidt, Mikkelsen, Post, Simonsen and Fruensgaard2004) document that Danish children's early language development is slower than that of, for example, Swedish children. Bleses et al. (Reference Bleses, Vach, Slott, Wehberg, Thomsen, Madsen and Basbøll2008) propose that the numerous reduction and assimilation processes in spoken Danish, for example the processes of schwa deletion and consonant vocalization, cause longer stretches of vocalic sounds and blur the syllabic boundaries. This, Bleses and her colleagues suggest, may be a reason why Danish infants and toddlers are slower in establishing a basic vocabulary than their peers in other European countries (see also Bleses, Basbøll & Vach Reference Bleses, Basbøll and Vach2011).
The difficulties in understanding spoken Danish for L1 and L2 users alike has been addressed in a formal experiment by Gooskens et al. (Reference Gooskens, van Heuven, van Bezooijen and Pacilly2010). Native listeners of Danish and Swedish were presented with language materials in both languages. The materials consisted of isolated cognate and non-cognate words in semantically unpredictable sentences, and words drawn from spontaneous interaction in map tasks. Gooskens et al. do not find that Danes have more difficulty in understanding Danish than Swedes have in understanding Swedish. However, Swedish listeners had more difficulties understanding the Danish test material than vice versa, confirming the observations in the literature cited above.
Hilton et al. (Reference Hilton, Schüppert and Gooskens2011) address the differences between the mainland Scandinavian languages by analysing articulation rates of ‘phonological and phonetic syllables’ in Norwegian, Swedish and Danish. Articulation rate, i.e. rate of speech disregarding pauses, was measured by use of two sets of data: recorded speech from authentic radio news and sentences read aloud in an experimental setting. In both data sets Hilton et al. find that Danish exhibits a much larger degree of deletion of phonological syllables than Swedish and Norwegian, i.e. a phonological syllable is less likely to have an acoustic correlate in the form of an intensity peak and trough in Danish than in Swedish or Norwegian. This blurring of syllables, the authors suggest, may contribute to the comprehension problems related to Danish as L2.
1.1 Style and phonetic reductions in Danish
Recent studies on reductions in spoken Danish have described reduction patterns both in relation to sociolinguistic variables and to linguistic context (Pharao Reference Pharao2010a, Reference Pharaob, Reference Pharao2012; Schachtenhaufen Reference Schachtenhaufen and Henrichsen2010a, Reference Schachtenhaufenb, Reference Schachtenhaufen2012a, Reference Schachtenhaufenb). The aim has been on the one hand to describe which reduction processes are operable, i.e. which phonemes reduce how; and on the other, to establish reduction hierarchies, i.e. which reductions are more likely to occur (Schachtenhaufen Reference Schachtenhaufen2013). Furthermore, studies have set out to explore the semantic-pragmatic connotations of reductions, e.g. in terms of focusing the listener's attention on central information in the utterance (Heegård Reference Heegård2012, Reference Heegård2013a, Reference Heegårdb; Heegård & Mortensen, to appear). These studies have shown that reduction phenomena follow predictable patterns. Contrary to popular perception, reductions appear not to be random, but can to some extent be said to be grammaticalized. Thus reductions may be argued to be not an indication of random convenience or performance mistakes, but of grammatical competence (Katlev Reference Katlev, Kunøe and Larsen1989; Schachtenhaufen Reference Schachtenhaufen and Henrichsen2010a, Reference Schachtenhaufen2012a, Reference Schachtenhaufenb).
In this paper we aim to add to the growing knowledge about patterns of reductions by analysing changes in reduction patterns over time within one prominent speech genre, viz. that of radio news readings. Heegård & Thøgersen (Reference Heegård and Thøgersen2012) showed with a quantitative approach that the frequency and degree of reductions in radio news readings have been rising (for some features much more than for others). Here, however, we approach the question in a more qualitative manner. We investigate whether formal radio news readings follow the same patterns of reduction as spontaneous speech, and whether the contexts that promote or inhibit reduction have changed over time. We aim to expand on the findings reported in Heegård & Thøgersen (Reference Heegård and Thøgersen2012), which showed that there are qualitative and quantitative differences between read Danish and spontaneous Danish with regard to reduction phenomena. For some variables, spontaneous Danish proved to be more reduced than formal read Danish. Surprisingly, for other variables formal read Danish proved to be more reduced than spontaneous Danish. This indicates that news language is not just a less reduced variety of ‘spontaneous language’, that is, a variety with similar reduction phenomena only to a lesser degree. If it were, we would expect all reduction phenomena to be less frequent in news language to the same relative degree. When we find that different phenomena are treated differently across different genres, we have an indication that the factors that influence reduction, the reduction rules, are different across genres. We may hypothesize that this is because some reduction features are more salient than others, and that more effort therefore goes into avoiding them in the formal style. If it turns out that the different genres do not follow the same rules, we may be dealing with structurally different stylistic varieties of Danish in terms of reduction-causing factors. It has important ramifications for studies that aim to describe reduction phenomena in Danish in particular if we can show that reduction phenomena are dependent on style, not just in degree, but also in terms of quality.
2. SCOPE OF THE ARTICLE
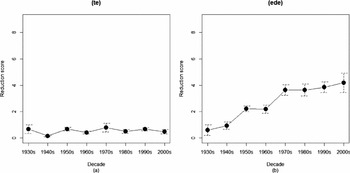
In this article we investigate whether the same or similar reduction rules exist in the two varieties of spoken Danish, as well as whether the rules that exist within the news readings variety of Danish have changed over time. We do so by focusing on syllable reduction in the two variables (te) and (ede), being the endings -te and -ede in adjectives and preterite verbs.Footnote 1 Firstly, we analyse the realization of these two variables in Danish news broadcasts in the period 1936– 2010 and compare it with spontaneous spoken Danish from sociolinguistic interviews and the DanPASS corpus of spoken Danish (Grønnum Reference Grønnum2009).Footnote 2 Secondly, we analyse potential changes in the reduction rules by dividing the news broadcasts into two chronological subsets, 1930s–1960s and 1970s–2000s. The two variables are ideal for this purpose for three reasons. Firstly, if these adjectives and preterite verb endings undergo syllable reduction, they become homophonous with the semantically different endings -t and -et, that is, grammatical mergers will occur (see Section 3 below). We assume that speakers in formal read speech will be giving special attention to words where reduction may cause semantic ambiguities. If reductions occur in these endings, other reductions that do not result in lexical and grammatical merging most likely also occur. The variables (te) and (ede) are, so to speak, high-stakes variables. Secondly, reductions in these variables are already well documented for spontaneous spoken Danish: Heegård (Reference Heegård2013b) investigated the factors which lead to syllable reduction of (te), and Heegård (Reference Heegård2012) examined the factors that cause syllable reduction in the (ede) variable. The insight into reduction-causing factors that we gain from these studies provides a good basis for comparing formal news readings with spontaneous spoken Danish. Thirdly, Heegård & Thøgersen (Reference Heegård and Thøgersen2012) document that the two variables have different development patterns over time: (te) is very stable over time and is reduced to a very low degree; (ede) is changing over time and is far more likely to be reduced than (te) in modern news readings (see Figures 4a and 4b below). We want to see whether the stability vs. volatility of the two variables co-occur with changes in reduction rules.
3. THE VARIABLES
The variables (te) and (ede) are the unstressed endings in preterite verbs, participial
word forms and adjectives that end in -te and -ede in
writing. Only those preterite verb forms where a syllable reduction leads to homophony
with the participle forms in -t or -et are included in
this study. For (te) an example is brugte [ ] ‘used (pret.)’. Pronounced with schwa loss as [
 ], brugte, it is homophonous with the canonical
pronunciation of the participle brugt ‘used (part.)’.Footnote 3 For (ede) an example is ringede ‘rang (pret.)’. The distinct
pronunciation with obligatory schwa assimilation is [ˈʁæŋ
 ]. Pronounced with syllable loss, [ˈʁæŋ] is homophonous with the canonical pronunciation of the participle
ringet ‘rung (part.)’.
Verbal participle endings in -te were treated as adjectives, and
participles and adjectives in -te and -ede were only
included when syllable reduction would lead to homophony with a participial or
adjectival -t or -et form. Examples
brugte [] ‘(the) used (ones)’, ‘the used (one)’ pronounced as [], homophonous with the canonical pronunciation of brugt
‘(a) used (one)’; and utilpassede [ˈutˢelpʰas] (with obligatory schwa assimilation) ‘(the) ill-adjusted (ones)’, ‘the
ill-adjusted (one)’ pronounced as [ˈutˢelpʰas], the canonical pronunciation of utilpasset
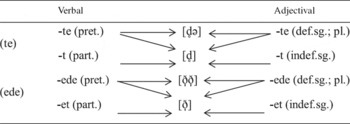
‘ill-adjusted (sing., indef.)’. Table 1 shows
the unreduced and reduced pronunciations of the variables, their homophonous
counterparts and their morphological structures.
The variables’ distinct and reduced realizations.

4. EXPLANATORY FACTORS
The bulk of the analysis below draws on mixed-model multiple linear regression analysis of the factors that influence whether an instance of (te) or (ede) is pronounced with syllable reduction or not. In this section, we present the factors which previous research has shown to be significant predictors of reduction, and which were analysed and included in the statistical models (see Sections 5.4–5.6 below about statistical model building). Not all of these factors turn out to be significant predictors in our data.
4.1 Word form frequency
It is well documented in reduction studies that word form (token) frequencies have an effect on phonetic weakening and reduction processes (see Bell et al. Reference Bell, Brenier, Gregory, Girand and Jurafsky2009 and Hanique & Ernestus Reference Hanique and Ernestus2011 for comprehensive surveys): highly frequent words tend to exhibit more weakening and to be more reduced than infrequent words. In this study we have measured the effect of word frequency with the numerical factor logFreq. The frequency value for a given word form was calculated by log-transforming (ln) the frequency of that word form in the KorpusDK corpus of written Danish (56 million words, http://ordnet.dk/korpusdk).Footnote 4
4.2 Accent
We use the term ‘accent’ as synonymous with stress accent, i.e. phonetic prominence given to a particular syllable by means of amplitude, length and/or pitch contour.Footnote 5 We name the accent factor AccentTarget.
Heegård (Reference Heegård2012, Reference Heegård2013b) documents a correlation between accent, word class and the realization of the number of syllables in Danish verbal and adjectival -te and -ede endings. Only preterite verbs occur without accent, and when they do, their -te endings almost always show syllable reduction. This correlation between accent and reduction is in line with the general observation that unaccented words are more reduced than accented words (van Bergem Reference van Bergem1993, Hawkins & Warren Reference Hawkins and Warren1994). In the data set used for this analysis, accent has been ascribed to the (te) and (ede) word forms on the basis of syntactic position, i.e. from an expected accent pattern induced from the (te) and (ede) words’ syntactic context. We have not attempted to evaluate whether a word expected to be as stressed was in fact realized as stressed – a far from trivial task in itself (see Jensen & Tøndering Reference Jensen, Tøndering and Trancoso2005). From the assignment of accent it appears that all adjectives have accent and that only preterite verbs occur without accent, like in Heegård's (Reference Heegård2012, Reference Heegård2013b) studies. Because of this interdependence between word class and accent, we cannot test for interaction between word class and accent in the models.
4.3 Next-word factors
Schachtenhaufen (Reference Schachtenhaufen2007, Reference Schachtenhaufen2012a) notes that the tendency for a schwa vowel to be reduced in Danish is dependent on the following sound. Before a pause, schwa is much more likely to be preserved than if it is followed by a consonant or a vowel. The models presented in Sections 6 and 7 take following sound into consideration by including the factor PhoneNext with the levels vowel (V) and consonant (C). It would have been preferable to include the third level, pause, in the models to add comparability with Schachtenhaufen's study. However, (te) and (ede) followed by pause are so rare in our data set (25 and 45 tokens of (te) and (ede), respectively) that we could not obtain reliable results. All pause contexts have therefore been omitted from the PhoneNext factor.
Schachtenhaufen (Reference Schachtenhaufen2007) furthermore documents an interaction effect between accented next word and word class of the target. The tendency for schwa to be elided before unaccented word is much stronger for verbs than for adjectives. For this reason we include the factor AccentNext in the statistical models. We determined accentuation of the following word manually, deduced by the rules for syntactic stress assignment in Danish. This has the levels accented following word (Yes) and not accented following word (No). Again the rare third context, pause, was omitted from the calculations.
4.4 WordClass
Heegård (Reference Heegård2012, Reference Heegård2013b) shows that syllable elision in -te and -ede endings correlates with word class: -te and -ede occurring in preterite verbs are significantly more likely to be reduced than those occurring in adjectives. The difference is somewhat larger for -te than for -ede.Footnote 6 Also Schachtenhaufen (Reference Schachtenhaufen2007, Reference Schachtenhaufen2012b) observes that verbal schwa endings in general, and the infinitive ending in particular, are more reduced than schwa endings on words in other word classes. WordClass was tested in the statistical model, with the levels preterite verb (VB) and adjective/participle (ADJ). We assigned word class manually by examining the syntactical context of the target words.
4.5 Generation
As discussed above, it is well established that historically Danish has gone through some drastic changes as regards the realization of original stop and fricative consonants: stop consonants have become fricatives, fricatives have become approximants, and some approximants are no longer pronounced, even though they are reflected in the spelling. The start of these changes can be traced back to Medieval Danish, but they are still in operation. Brink & Lund (Reference Brink and Lund1975) document that the ‘lenition drift’ has caused significant changes in the sound pattern of Danish in the period 1840s–1970s. Pharao (Reference Pharao2010a) documents the more recent development that approximants may be elided or assimilated to neighbouring sounds with a colouring effect.
The general lenition processes are found not only in spontaneous speech but also in formal genres. In their study of reduction variables in Danish news broadcasts from the 1930s to the 2000s, Heegård & Thøgersen (Reference Heegård and Thøgersen2012) found that most variables changed over time and became more reduced. It is likely that news readings in the latter part of the 20th century have gone through a process of ‘vernacularization’, i.e. a change in style from more formal style towards the norms of spontaneous speech (see Thøgersen Reference Thøgersen2011, Reference Thøgersen2013a, Reference Thøgersenb; Thøgersen & Pharao Reference Thøgersen and Pharao2013 for evidence of this process). As stated in Section 1 above, we are interested in tracking the effect which this assumed vernacularization may have had on the reduction rules on formal news readings. That is, we want to investigate whether the vernacularization may be evident in a qualitative change of rules as well as in quantitative degrees of reduction.
The time dimension is operationalized through the factor Generation. We pooled the occurrences into two age levels comprising the 1930s–1960s (Old) and the 1970s–2000s (including 2010) (New), respectively.Footnote 7 Generation, then, does not directly refer to the age or date of birth of the speakers but to the year of recording. In Section 7 we focus on the differences in reduction rules for each of these two generations in each variable.
4.6 PhoneStem
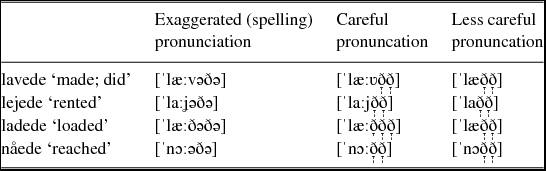
Stem phone class (the factor PhoneStem) was included in the statistical model on the assumption that a syllable in word endings would be more likely to assimilate to a preceding vowel or semi-vowel than to a preceding consonant. This assimilation process is illustrated in Table 2 with the words lavede ‘made, did’, lejede ‘rented’ and ladede ‘loaded’, contrasted with nåede ‘reached’ in order to show the merger of different underlying syllable structures.Footnote 8 Note that stems which phonologically end in (different) glides may merge with each other and with stems phonologically ending in a vowel. It should be mentioned that the pronunciation of the Danish /ð/ does not involve contact between the active and passive articulators in any but the most careful pronunciation. Also the transcripts ignore the tendency for velarization of [ð].
Assimilation of stem-final semi-vowels with the -ede ending.
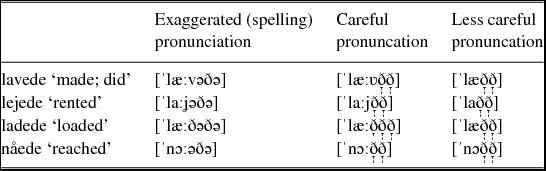
In (hyper) careful pronunciation the semi-vowels in lavede, lejede and ladede are or can be pronounced as contoids. In a more natural, careful pronunciation the semi-vowels are pronounced as an approximants, and in a less careful pronunciation the semi-vowels are assimilated to the -ede ending.Footnote 9 These syllable structures create favourable conditions for syllable reduction.
Ideally this factor would encompass the three levels vowel, glide or semi-vowel, and consonant. However, stem-final semi-vowels are rare in our data (23 and 45 tokens of (ede) and (te), respectively). Semi-vowels have therefore been included with the vowels. We thus have two levels in the factor, vowel and semi-vowel (V) and consonant (C). In a future study it would be interesting to focus in particularly on the semi-vowels. Our impression from listening to the data is that the pronunciation of the semi-vowels changes quite drastically in the period we are looking at. In Old recordings, the semi-vowels are more contoid, in New recordings they are more vocoid. Coding the semi-vowels differently for the Old and New data set, however, would lead to circularity.
5. DATA AND METHOD
The data in this paper consists of nine listeners’ evaluation of the pronunciation of a total number of 1,004 tokens of the (te) and (ede) endings.
5.1 Material
The tokens were extracted from a corpus consisting of six hours of extracts from some 40 radio news programs spanning 75 years (1936–2010). These were all news readings broadcast by the Danish National Broadcasting Corporation (DR). The DR is comparable to the BBC and enjoys the same status in Denmark as the BBC has (or used to have) in Britain with respect to the use of ‘proper’ language (see Mugglestone Reference Mugglestone2007; Thøgersen Reference Thøgersen2011, Reference Thøgersen2013a; Thøgersen & Kristiansen Reference Thøgersen and Kristiansen2013; Thøgersen & Pharao Reference Thøgersen and Pharao2013). In order to maximize comparability, all samples are taken from the actual news bulletins, i.e. reading aloud from a manuscript, not interviews or other more spontaneous speech. The great majority of the speakers sound like middle-aged male speakers of the Copenhagen standard. In fact, we know very little about the speakers, especially when it comes to the older recordings. It was not customary to announce news readers’ names, and even in those cases where we know the names, we were not always able to find biographical data of the speakers. Nor would this information necessarily be relevant. To the intended listeners, the ‘cultured’ parts of the population, the speakers were seen as simply ‘the voice of the National Radio’, not individuals per se, and this is also how we treat them here.
5.2 Procedure
The listeners were presented with the 1,004 instances of the (te) and (ede) tokens as well as a roughly equal number of the canonically short forms, i.e. word forms ending in -t and -et, respectively. In the test material, the number of tokens of each form is in the same order of magnitude, -ede (385) and -et (600) and with -te (619) and -t (700). In the following analysis we ignore evaluations of the -et and -t forms, including interpretations of these canonically ‘short’ forms as ‘long’ forms, i.e. -ede and -te, respectively. In this respect these forms function only as fillers.
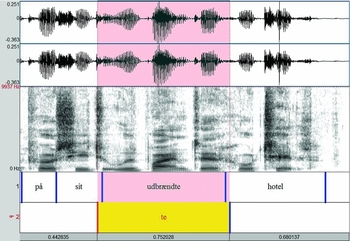
The tokens (2,304 in total) were played to the listeners in isolation, without linguistic context other than the inevitable co-articulation present in the beginning and end of words (see Figure 1). In practical terms the experiment procedure was run by a Praat (Boersma & Weenink Reference Boersma and Weenink2014) script which found instances of the endings under investigation in word-aligned TextGrid-files of the news readings. If a match was found, the script played the accompanying sound including a 25 msec buffers (fade-in and fade-out) before and after the word (see Figure 1, the highlight showing the part that was played, but not visually shown, to the listener).
An example of the sound played to listener–judges. The example shows the word udbrændte ‘burnt down’ in the context ‘in his burnt-down hotel’ with the 25 msec buffer before and after the word.

For each token, the listeners were given a multiple choice task (see Figure 2). They were to judge which form of the word they most likely believed they heard, the short or the long form. The listener could choose between: for (te) a verbal or an adjectival form ending in either -te or in -t (brugte or brugt), for (ede) a verbal or an adjectival form ending in either -ede or in -et (utilpassede or utilpasset). The difference within the pairs is of course morphosemantic, and, we assume, therefore simpler and more intuitive than a task where listeners are to judge between phonetic realizations.
The multiple choice task presented to the listener–judges.

The fact that there are relatively equal numbers of the tokens of the variables under investigation and tokens of the fillers means that listeners in the experiment were presented with approximately as many short forms and long forms. This makes it very unlikely that listeners based their guess on some assumptions of the relative frequencies of occurrences, e.g. that they consider one form so rare that they never consider it a realistic possibility.
The word choices were presented in standard orthography. They were either drawn directly from the orthographic transcription (in the case of the ‘true’ canonical form) or they were constructed by simple substitution rules from the orthographical transcription (in the case of the reduced version of the long form or the ‘expanded’ version of the short form). For example, if the extracted word ended in -te, listeners were presented with the orthographic form, e.g. ‘brugte’, and a permutation with e omitted, ‘brugt’. If the extracted word ended in -t, they were presented with the orthographic form, e.g. ‘brugt’, and a permutation ending in -te, ‘brugte’. And similarly for forms ending in -ede or -et. The listeners were strongly encouraged to make a choice even if they were not certain; but they were also presented with an ‘N/A’ choice if they believed something was wrong with the token or they found it impossible to judge. To indicate that the N/A was not to be used too frequently, we referred to this option as an ‘error’ report in the multiple choice task (see Figure 2). In total about 0.5% of the 20,736 evaluations were N/As. The listeners could listen to each token as many times as they wished. We logged the number of repeats as a potential indicator of insecurity on the part of the listeners (reported in Thøgersen & Heegård Reference Thøgersen and Heegård2013). The mean number of repeats was around three for (te) and around 10 for (ede). The entire task took about 45 minutes effectively. Listeners were encouraged to take breaks whenever they needed to.
5.2 Participants
Each token of potential (ede) or (te) reduction was evaluated by the nine listeners independently from each other in the sense that no listener had any chance of knowing how the other listeners had evaluated the same token.
The listeners were three linguistics students and four students of other majors (all aged around 25 years, six females, all native speakers) and the two authors (aged around 40, both male, both native speakers). It may seem suspect that we used ourselves as judges. However, with the tokens being played in isolation, being drawn, for all practical purposes, at random (i.e. in the sequence in which they appeared in the news readings) and with the large number of fillers, we were no better qualified to guess what the ‘true’ form of the word would have been, than our naïve student listeners. Even if we recognized a particular speaker, we would have no great chance of knowing whether he used the preterite or participle form of a particular verb. Correctly guessing the word forms would require us to remember each sentence by each speaker (six hours of material) or remember the sequence of 2,304 tokens of the variables.
5.3 Responses
Each listener was thus presented with a categorical choice. In our treatment of the
responses, however, we reinterpret the likelihood of listeners evaluating a token as
reduced as a gradual scale. Each token of (te) and (ede) is assigned a ‘reduction
score’ equal to the number of listeners who believed they heard the short form
(brugt/utilpasset). We interpret this evaluation
of a (te) and (ede) as indirect evidence of the word being reduced, that is, that it
has lost its final schwa vowel or assimilated from a bisyllabic ending, [] to a monosyllabic ending, []. Thus, we treat reduction as a gradual phenomenon rather than a
discrete phenomenon, and we interpret tokens which more listeners judged to be the
short form as more reduced than tokens which few listeners judged as
short form. The reduction score for a given word ranges from 0 (unambiguously not
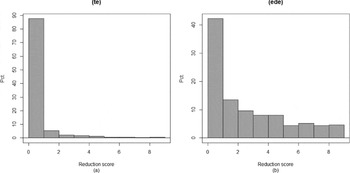
reduced) to 9 (unambiguously reduced). Figures
3a–b show the distribution of reduction scores for the two variables obtained
from the listeners’ judgments and also the level of agreement between listeners. Note
that if reduction was truly a categorical phenomenon, we should expect to see an
abundance of scores of 0 and 9. All intermediate scores indicate some level of
disagreement between listeners.
(a) Reduction score for (te) based on all listeners’ judgement. (b) Reduction score for (ede) based on all listeners’ judgement.

We do not in this analysis differentiate between the different listeners’ evaluations, nor do we explore potential patterns as regards agreement between listeners. Suffice it to say that the level of agreement is generally quite high with scores of Cronbach's alpha above 0.9 when looking at both short and long forms of both variables (see Thøgersen & Heegård Reference Thøgersen and Heegård2013 for a detailed description of agreement in perception among listener–judges across different types of variables).
As mentioned, Heegård & Thøgersen (Reference Heegård and Thøgersen2012) show that some phonetic variables became more reduced over time in radio news readings. The effect of the age of the recordings on the listeners’ evaluation of the two variables in this study is shown in Figures 4a–b.
(a) Reduction of (te) 1930–2000. (b) Reduction of (ede) 1930–2000.

Figure 4a shows a limited effect of age on the perception of (te). The (te) variable is relatively unreduced (a very high proportion of reduction scores of 0 or 1) and very steadily so over time. Figure 4b shows that (ede) is more often heard as reduced, and that the tendency to hear (ede) as reduced increases markedly the more recent the program is. The graph also shows a rather abrupt change between the 1960s and 1970s which leads us to set the dividing line between generations (Old) and (New) at this point in time. We return in Section 7 to a discussion of why we see this development over time for (ede) but not for (te).
5.4 Mixed-model multiple linear regression analysis
Mixed-model multiple linear regression analysis was used to examine the factors that could be possible triggers of reduced pronunciation, or more precisely, which would increase the possibility that the listeners would hear the word form as reduced. The analysis was performed by use of the statistical software package R, in short R (R Core Team 2014), using the ‘glmer’ function in the package lme4 (Bates et al. Reference Bates, Maechler, Bolker and Walker2014). This tool provides a means of establishing a statistical model that predicts the outcome of a dependent variable, in this case the degree of reduction for the two variables (te) and (ede), respectively, with reference to the contributions of a number of independent factors. In a multiple regression analysis, significance levels and the degree of effect of each factor are calculated whilst the other factors are kept constant. In this way, the model produced by the analysis will allow us to tell, to a certain extent, whether each of the independent variables presented in Section 4 has an effect on the outcome of the dependent variable. The model also produces information about the magnitude of any effect found. The plots we present below are also generated in R, using the function ‘plotmeans’ in the package gplots (Warnes et al. Reference Warnes, Bolker, Bonebakker, Gentleman, Huber, Liaw, Lumley, Maechler, Magnusson, Moeller, Schwartz and Venables2014).
5.5 Random effects
A mixed-model multiple linear regression analysis has the advantage over a simple regression analysis that it controls for the effects of ‘random’ factors, in contrast to a simpler fixed-effects analysis which controls only for fixed effects (the effects under investigation). Random factors will typically be factors that are sampled randomly from a population and that will not be identical in a replication of the experiment, in contrast to the variables that constitute the fixed effects, i.e. the factors whose influence on the dependent variable were tested in the model.
The number of word forms in the radio news corpus is unbalanced with respect to individual speakers; some speakers have only one or two contributions, others have up to 50. This may lead to under- or overestimations of the external factors as some individuals may favour a specific linguistic outcome (Johnson Reference Johnson2009, Jensen & Maegaard Reference Jensen and Maegaard2012). The actual word forms are also not equally distributed in the data set. Some word forms occur only once or a few times in the data, advarede ‘warned’ (1) and følte ‘felt (vb.)’ (1), others are more frequent, erklærede ‘declared’ (24) and sidste ‘last (adj.)’ (61). Some word forms may have different individual tendencies for elision of schwa over and above the influence of the variables we are analysing for. The models therefore also include word form as a random factor. Including speaker and word form as random effects, forces the model to take into account the effect that individual speakers may have specific tendencies in their pronunciation, or that there will be specific pronunciation features associated with specific words.
5.6 Model building
The independent variables presented in Section 4 above were included in the mixed-effects model as fixed effects. We thus test their effect on the degree of (heard) reduction of (te) and (ede). The factors were both linguistic and non-linguistic and both numerical (logFreq) and categorical (e.g. WordClass, Generation). Following Baayen's (Reference Baayen2008:165–169) principles of model building, the variables that were found not to have a significant effect on the dependent variable were excluded from the model. Factors that were found to have a significant effect on the outcome of the dependent variable were kept in the model (see also Crawley Reference Crawley2007:323–329 for principles of model-building). The reason for excluding insignificant factors, rather than leave them in, is that the contribution of insignificant factors will skew the prediction of the model and the estimation of the significant factors.
We started by testing each fixed factor alone in a simple model with only the one fixed factor and the two random factors speaker and word form. The factors were ranked according to the AIC (a measure of goodness-of-fit) which the model produced. The fixed factors were then added to the model in descending order, starting with the supposedly most significant. Each added factor was tested for significance alone and in two-way interactions with the factors already in the model. If the added factor did not prove to be a significant predictor in either case, it was removed from the model. If it proved significant both alone and in interaction, the two candidate models were tested against each other (using ANOVA). If the more complex model, with interaction, did not prove significantly stronger, we followed the principle of parsimony (Crawley Reference Crawley2007:325), and the simpler model was preferred.
6. FACTORS INFLUENCING THE REDUCTION OF (TE) AND (EDE)
In the following we examine the factors which the statistical analysis tells us are predictors for heard reductions of the variables. We first describe the model that best accounted for the (relatively small) variation in the (te) data set. Then we describe the model that best accounted for the tendency for reduction observed for (ede). The analyses only consider those factors that were found to be significant. Any factor mentioned in Section 4 above but not mentioned here was tested and found insignificant. We summarize the results of the analyses in Section 6.3.
6.1 Significant factors, (te)
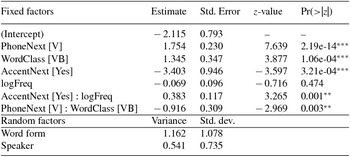
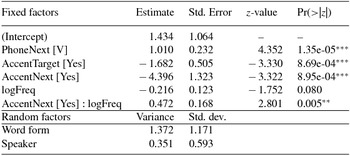
Table 3 presents the model that best explains the variance in the (te) data set, following the criteria for model-building described in Section 5.6.
Mixed-model multiple linear regression analysis for (te); 594 observations; random factors: 147 word forms, 44 speakers.

. = p < .1, * = p < .05, ** = p < .01, *** = p < .001
Two values for the factors are important in a model like this, the estimate (second column) and the p-value (rightmost column).Footnote 10 The estimate value for the Intercept represents an estimation of the outcome on the dependent factor, the reduction score, if all independent variables and their relevant interactions take their reference levels in the model, here PhoneNext [C], WordClass [ADJ], AccentNext [No] and logFreq = 0. Note that even though reduction score in reality can only take values of integers between 0 and 9, the model treats it as a continuous scale with negative as well as positive values. The values of interest in the model are the estimate values for the factors, the named level within each factor, and the corresponding significance levels. The significance level tells us whether the specific factor has a significant influence on the outcome (the z-values in the second to last column and the normal asterisk and dot representation of significance levels). The estimate values indicate the direction and extent of the named (significant) factor level. If there is a significant effect of a given factor we say that that factor is a significant predictor for the outcome of the dependent variable, i.e. the reduction scores.Footnote 11
It appears from Table 3 that three individual factors all have a significant effect on the heard realization of (te), PhoneNext, WordClass and AccentNext. The model also tells us that there are two interactions that explain parts of the variance in the data: PhoneNext together with WordClass, and AccentNext together with logFreq. Because logFreq takes part in a significant interaction, it is also included in the model as an individual factor even though it is far from being a significant factor in itself. An interaction between two factors means that the levels of one factor may determine the effect of another factor. A factor, then, may not have a universal effect on the dependent variable, but it may only have an effect given a specific level of another factor, or it may have different effects for different levels of another factor.Footnote 12
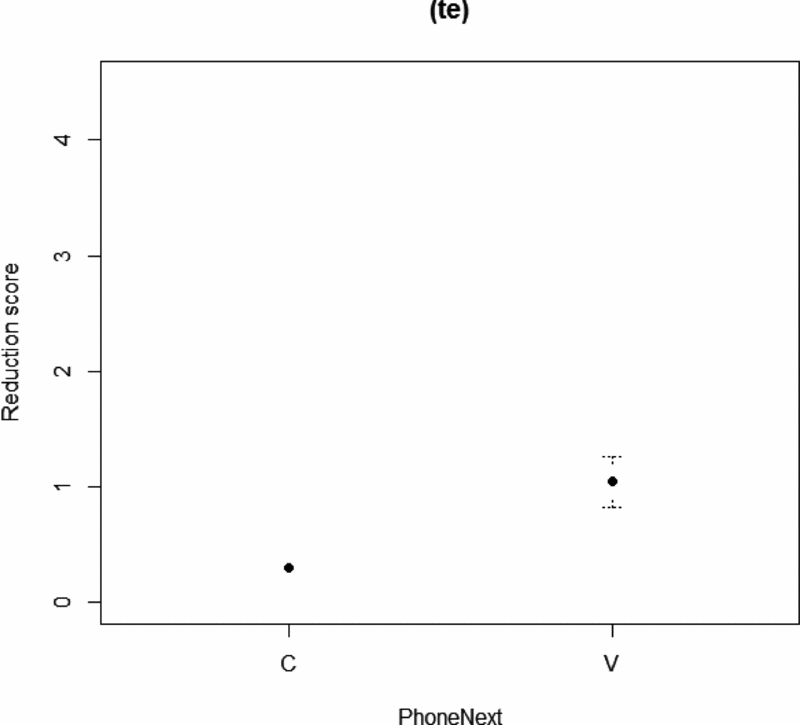
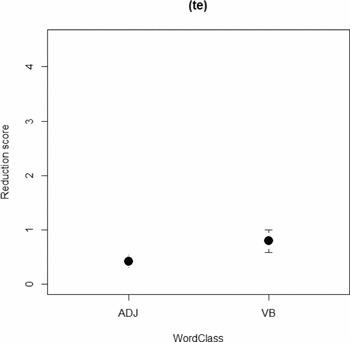
The positive value for [V] (vowel) in PhoneNext tells us that (te) is heard more reduced before a word that begins with a vowel than before a word that begins with a consonant. When we look at the effect of word class we see that (te) is heard as more reduced when it is a verbal ending than when it is an adjectival ending. Recall that the listeners heard the words in isolation, without hearing the following word. We are therefore fairly confident that both effects are production effects rather than a perception effects. These effects are illustrated with Figures 5 and 6.Footnote 13
Mean reduction scores for the levels [C] and [V] (NextPhone) for the (te) variable.
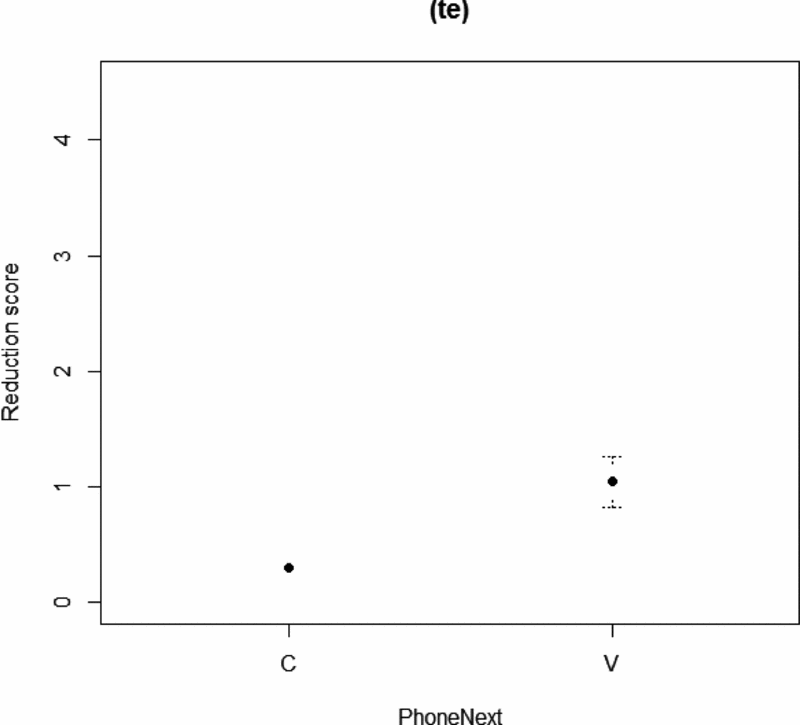
Mean reduction scores for the levels [ADJ] and [VB] (WordClass) for the (te) variable.

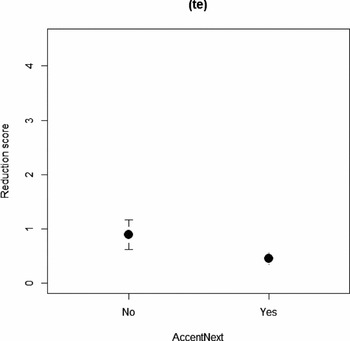
The negative value for AccentNext [Yes] tells us that a (te) ending is heard as less reduced when followed by an accented word. Or, the other way round, when a (te) ending is followed by an unaccented word, it is more often heard as reduced. This effect is illustrated in Figure 7.
Mean reduction scores for the levels [No] and [Yes] (AccentNext) for the (te) variable.

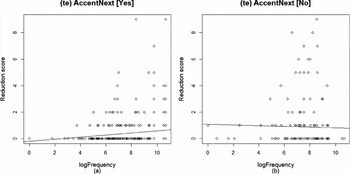
When we look at the first of the two interactions, the one between AccentNext and logFreq we see that if a (te) word is followed by an accented word and if it is in the higher end of a frequency scale, it is heard as more reduced. If, on the other hand, it occurs before an unstressed word there is no frequency effect. The effect of this interaction is illustrated in Figures 8a–b.
(a) Interaction of the factor logFreq and the level [Yes] (AccentNext) for the (te) variable. (b) Interaction of the factor logFreq and the level [No] (AccentNext) for the (te) variable.

The interaction plotted in Figures 8a–b tells us that frequency does play a role for the heard reduction of a (te) word, but only when (te) occurs before an accented word; (te) in more frequent words are as likely to be (heard as) reduced when occurring before accented as before unaccented words. Before an unaccented word, the frequency effect is, so to speak, overruled by the factor AccentNext.Footnote 14
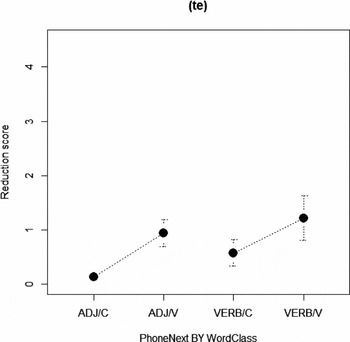
The interaction between PhoneNext and WordClass seems on the face of it peculiar. The negative estimate tells us that a (te) ending is less likely to be heard as reduced when it occurs in a verb and when the following word begins with a vowel. Both of these factors tend to promote reduction as single factors (Figures 5 and 6). The effect of this interaction is illustrated in Figure 9.Footnote 15
Interaction between the levels [C] and [V] (PhoneNext) and [ADJ] and [VB] (WordClass).

In the plot it is apparent that the interaction in fact indicates that the difference between the (V) and (C) means for verbs is smaller (i.e. the line is not as steep) than the difference between the (V) and (C) means for adjectives. That is, the effect of a following vowel or a following consonant (Figure 5) is mainly operable for adjectives. It is possible that this is because verbs in general tend to be more reduced so that an effect of a following vowel is neutralized, and the effect is therefore only apparent if (te) does not occur with a verb. However, one must bear in mind that the observed effect is quite weak.
6.2 Significant factors, (ede)
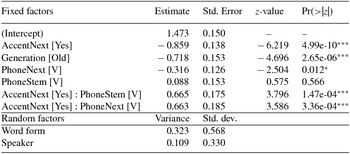
Table 4 depicts the model that best explains the variance in the (ede) data set.
Mixed-model multiple linear regression analysis for (ede); 340 observations; random factors: 172 word forms.

. = p < .1, * = p < .05, ** = p < .01, *** = p < .001
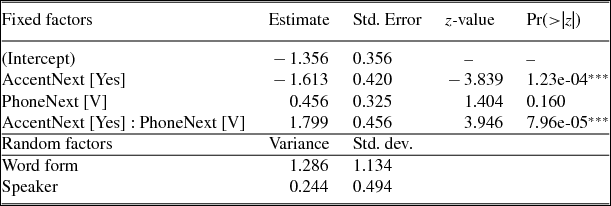
The table shows that reduction of the (ede) variable is caused by other factors than those that have an impact on the reduction of the (te) variable. AccentNext, Generation and PhoneNext are found to be significant predictors. The model tells us that there are also two significant interactions that can account for some of the variation in the data set: AccentNext [Yes] with PhoneStem [V] and AccentNext [Yes] with PhoneNext [V]. PhoneStem in itself is far from being a significant predictor for heard reduction of (ede), but, like logFreq above, it is included in the model as an individual factor because it is part of one of the significant interactions.
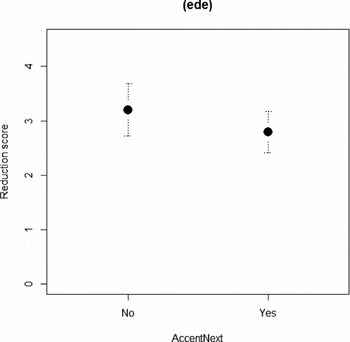
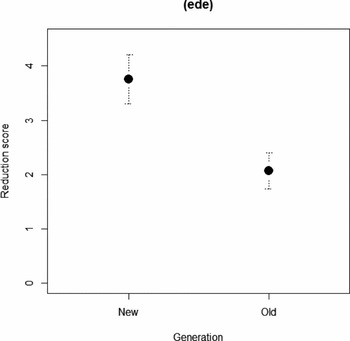
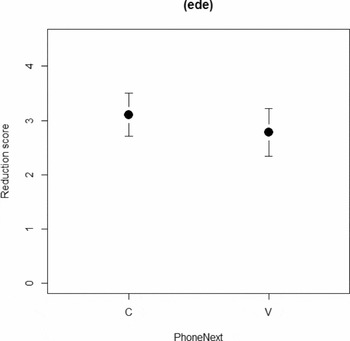
The significant effects of the individual factors are illustrated with Figures 10–12.
Mean reduction scores for the levels [No] and [Yes] (AccentNext) for the (ede) variable.

Mean reduction scores for the levels [New] and [Old] (Generation) for the (ede) variable.

Mean reduction scores for the levels [C] and [V] (PhoneNext) for the (ede) variable.

Similar to the (te) ending, we see in Figure 10 that (ede) endings are more likely to be (heard as) reduced before an unaccented word. Figure 11 illustrates the significant effect of Generation as predictor of reduction of the (ede) ending. The (ede) words in the recordings from the 1970s and onwards are heard as reduced to a much higher degree than the (ede) words in the recordings from 1930s–1960s (see also Figure 4b above). To the extent that heard reduction reflects actual reduction, this observation suggests that the pronunciation of the (ede) ending is changing from bisyllabic to monosyllabic even in the formal style of broadcast news reading. We reconsider this hypothesis in the discussion following the analysis in Section 7. Figure 12 illustrates the significant effect that the factor PhoneNext has on the (ede) variable. In light of what we saw from the analysis of (te) (Figure 5), it is surprising that a following vowel seems to trigger less, not more heard reduction of (ede). The difference is small, but significant. We may speculate whether this effect is due to the speakers’ awareness of syllable reduction as a phenomenon to be avoided in the formal genre of news reading, i.e. an effect of hypercorrection.
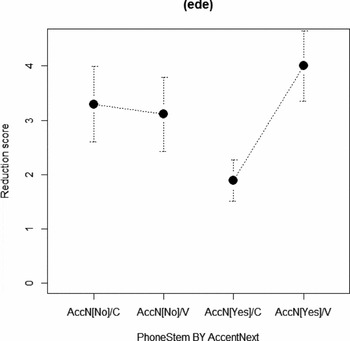
The interactions in Table 4 are intricate. The effect of accent on the following word was shown in Figure 10. Figure 13 shows the interaction between this factor and that of stem-final sounds.
Interaction between the levels [No] and [Yes] (AccentNext) and [C] and [V] (PhoneStem).

Figure 13 shows that if a word with an (ede) ending occurs before an accented word, it is much more likely to become reduced if the stem-final sound is a vowel (or a semi-vowel), than if the stem-final sound is a consonant. Stem-final consonants before an accented word, on the other hand, inhibit reduction. If the following word is unaccented, (ede) is reduced to the same, relatively high, degree irrespective of stem-final sound. This may be indicative of a strong effect of the factor AccentNext. If the following word is unaccented, the (ede) word is in such a favourable context for reduction that the quality of the stem-final vowel is of no significance. If, however, the following word is accented the factor PhoneStem have an effect. We take up this significance of this factor in Section 7.2.
The second interaction is illustrated with Figure
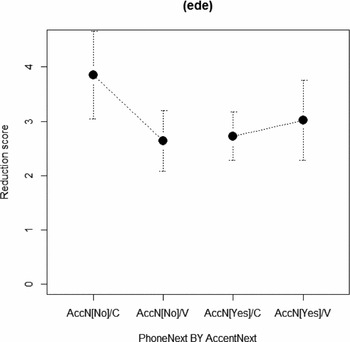
14. This figure shows that if an (ede) word is followed by an unaccented
word, (ede) will be (heard as) reduced more often if the following word begins with a
consonant than if it begins with a vowel. There is, however, no effect of a following
consonant vs. vowel if the following word is accented. In other words, the general
effect of a following accented word is schwa-preservation and the effect of following
unaccented word is schwa-elision (see Table
4 and Figure 10). Figure 14 shows that the schwa-preserving and
schwa-eliding effects of AccentNext are particularly strong if the following word
begins with a consonant. This may be an effect of the fact that approximately 30% of
the unaccented next words beginning in consonant are either pronouns, such as
den ‘it’ and dem ‘them’ or they begin with
h. The apparent reduction-promoting effect of a following
consonant (in an unaccented word) may be an effect of the phonetics of such words.
The sound [h] (or [ɦ], in voiced contexts), represented by the letter
h (coded as a consonant), is often elided, and the unaccented
pronouns, such as den and dem, can have the
unaccented enclitic forms [ən]/[ ] and [əm]/[
 ]. We call for further studies of a more systematically established
data set to cast light on this hypothesis.
Interaction between the levels [No] and [Yes] (AccentNext) and [C] and [V] (PhoneNext).

As suggested above, it may also be that speakers in this formal style are intuitively aware of the reduction rules but circumvent them for prescriptive reasons. The position before unaccented words beginning in a vowel should be the ideal context for syllable reduction. If, however, speakers are instructed to avoid reductions (as we know news readers were and are), they may be aware of the ‘natural’ tendencies and avoid them, i.e. they may hypercorrect their pronunciation.
6.3 Summary
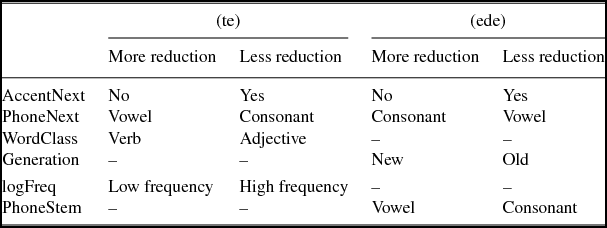
The preceding analysis has shown that the two variables (te) and (ede) differ significantly with regard to degree of reduction and that their tendencies towards reduction have developed differently over time. The variable (te) is relatively rarely heard reduced and very steadily so in the period investigated. In contrast, (ede) is more prone to reduction, and it has become more so over time. The variables also differ as regards the factors that account for the different reduction tendencies. Table 5 summarizes for each variable the factors that, individually or in an interaction with other factors, significantly predict reduction and how each level of the factor contributes to more or less reduction of the two variables.
Significant factors (individual and in interactions) and factor levels with the direction of their contribution to the reduction of (te) and (ede).
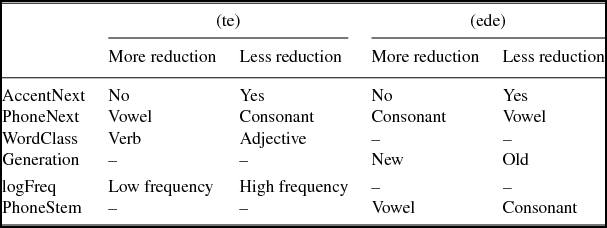
The factor AccentNext has the same effect on the variables: a following unaccented word triggers more reduction, an accented word less reduction (Figures 7 and 10). The factor PhoneNext also has an effect on both variables but in different directions. For (te), an initial vowel in the following word triggers more reduction (Figure 6), for (ede) an initial consonant triggers more reduction (Figure 12). We attribute this ‘inverse’ effect to hypercorrection. If, however, (ede) is followed by an accented word, an initial vowel has a tendency to cause more reduction (Figure 14). The factor WordClass is only relevant for (te) where we see more reduction when the (te) word is a verb (Figure 6). The factor Generation is only relevant for (ede), where we see more reduction in the New generation (Figure 11). The effect of logFreq is only observable for (te) and only in an interaction with AccentNext, so that a high frequency (te) word is more reduced only if followed by an accented word (Figures 8a–b). The effect of PhoneStem is only observable for (ede), and only in an interaction with AccentNext so that an (ede) word with stem final vowel is more reduced than an (ede) word with a stem final consonant only when it occurs before an accented word (Figure 13).
It is an interesting – and perhaps surprising – result that the factor AccentNext plays an important role for both variables. As an individual factor it is clear that an unaccented following word provides a favourable context for reduction. From the analyses of interactions with other factors, it appears that some of these other factors only (or most strongly) predict reduction if the following word is accented.
7. STYLE CHANGES OVER TIME
In this section we will address the second question posed in the introduction, viz. whether the style of the radio news readings, as indicated by the reduction rules, is constant over time. If the rules are constant, this may indicate that this particular style is consistently deviant from spontaneous spoken language. If they change, we may see this as an indication that the style is changing. Coupland (Reference Coupland2007, Reference Coupland2012), among others, has suggested that we are currently witnessing a ‘vernacularization’ of the (language of) broadcast media, meaning that the style of the official media is gradually approaching that of spontaneously spoken language (see also Thøgersen Reference Thøgersen2011, Reference Thøgersen2013a, Reference Thøgersen, Hansen, Hougaard and Widellb). Here we wish to test whether Danish radio news reading (arguably the most formal of all media genres in Denmark) has undergone a vernacularization to bring it more in line with the style we know from spontaneously spoken language. We know from previous studies (Heegård & Thøgersen Reference Heegård and Thøgersen2012) that radio news readings are typically not reduced to the same degree as spontaneously spoken language, but if the application of reduction rules are changing, this may be an indication that the style is changing.
One could well argue that the factor Generation (and its interaction with other factors) shows whether there has been a development over time or not, and thus that there has been one for (ede) but not for (te). We believe, however, that the question of change over time is important enough for us to dedicate a separate section to its analysis. Furthermore, many of the factors we find to be relevant when analysing the reduction rules by generation are found in interactions. Investigating the interplay of these interaction terms with Generation will lead to three-way interactions. While such interactions can of course be analysed through mixed-model multiple linear regression, investigating all three-way interactions will be quite elaborate. We have made the analytical choice that interaction with Generation is so theoretically interesting that it should be given a fuller analysis than other possible three-way interactions.
For each of the two variables we examine in Sections 7.1 and 7.2, the question of changing reduction rules is investigated first by presenting ‘naïve’ models for the two generations (1936–1969 and 1970–2010). These models include all investigated factors, ignoring possible interactions, and they are not critically examined according to the criteria for model-building (Section 5.6). The aim of presenting them is to give an overall impression of the changing roles of the factors influencing the tendency for reduction of the variables. As seen in Section 6, fully developed models can become quite elaborate and difficult to compare; the ‘naïve’ models are more easily comparable. They are, however, unsatisfactory compared to fully fitted models. This is the case firstly because interactions are not included (including possible interactions would defeat the purpose of simplicity), and secondly because even insignificant factors will change the predictions of the model. In other words, the explanatory power of the model is hampered by including inoperable factors. Following the ‘naïve’ models we therefore present a critically developed model for each variable for each Generation, Old and New. In Section 7.3 we first summarize the results and then discuss some possible implications.
7.1 Reduction of (te) by generation
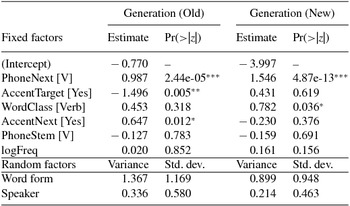
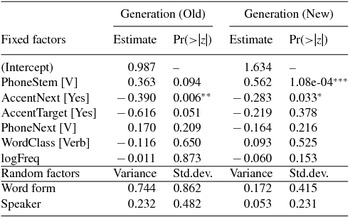
The naïve models for (te) indicate that there are different factors at play in the two generations. In the recordings from 1936–1969 (Table 6, left columns), PhoneNext, AccentTarget and AccentNext seem to be significant predictors for reduction. In the recordings from 1970–2010 (Table 6, right columns) AccentTarget and AccentNext are insignificant predictors, WordClass, however, is added to the list of significant predictors.Footnote 16
‘Naïve’ mixed-model multiple linear regression analysis of (te), generation Old/New; 292/302 observations; random factors: 100/91 word forms, 22/22 speakers.

. = p < .1, * = p < .05, ** = p < .01, *** = p < .001
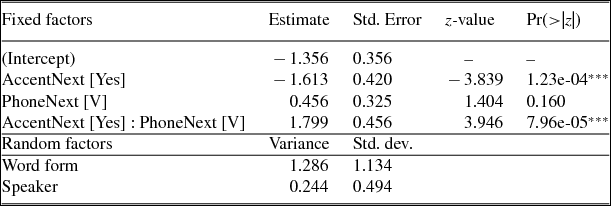
By examining these factors more critically, following the procedure outlined in Section 5.6, we end up with the factors shown in Tables 7 and 8 as the best predictors for the heard reduction of (te) in the two periods.
Mixed-model multiple linear regression analysis of (te), generation Old; 292 observations; random factors: 100 word forms, 22 speakers.

. = p < .1, * = p < .05, ** = p < .01, *** = p < .001
Mixed-model multiple linear regression analysis of (te), generation New; 302 observations; random factors: 91 word forms, 22 speakers.
. = p < .1, * = p < .05, ** = p < .01, *** = p < .001
In both periods AccentNext is a strong predictor for schwa reduction of (te) and in both periods this factor takes part in a strong interaction, in the Old generation with logFreq, in the New generation with PhoneNext.
In the Old generation, Table 7, a following vowel (PhoneNext [V]) has a significant effect on reduction, and accent on the (te) word (AccentTarget) has a significant schwa-preserving effect. When examining the interaction between AccentNext and logFreq closer we find a ‘reverse’ frequency effect before an unstressed following word, similar to Figures 8a–b. That is, (te) is more likely to be reduced in frequent words when preceding an accented word.Footnote 17 Thus, as noted above, frequency does play a role for the heard reduction of a (te) word, but only when (te) occurs before an accented word. Before an unaccented word, this context takes precedence over a possible influence on reduction caused by frequency.Footnote 18
In the New generation, only AccentNext as a single factor is a good predictor for schwa reduction. Accent on the following word is (still) an inhibitor of schwa reduction. Taken as individual factors, neither accent on the (te) word nor the quality of the following sound has a significant effect on heard reduction of (te). In addition, frequency (logFreq) no longer has a significant influence on the reduction, as it has in the Old generation through the interaction with AccentNext. The interaction in the New generation between PhoneNext and AccentNext tells us that an initial vowel in the following word (PhoneNext [V]) has a stronger reduction-causing effect when it occurs in an accented word (the effect seen in Figure 5). Before unaccented words the reduction-causing effect is minimized, possibly because this position will tend to cause reduction in the preceding (te) word anyway.
7.2 Reduction of (ede) by generation
The naïve models for (ede) also indicate that there are different factors at play in the two generations. In the recordings from 1930s–1960s (Table 9, left columns) only AccentNext has a significant effect on the reduction of (ede). In the recordings from 1970s–2000s (Table 9, right columns), PhoneStem is added to the factors that are responsible for the syllable reduction, whereas in the Old data it is not significant.
‘Naïve’ mixed-model multiple linear regression analysis of (ede), generation Old/New; 198/142 observations; random factors: 97/97 word forms, 20/21 speakers.

. = p < .1, * = p < .05, ** = p < .01, *** = p < .001
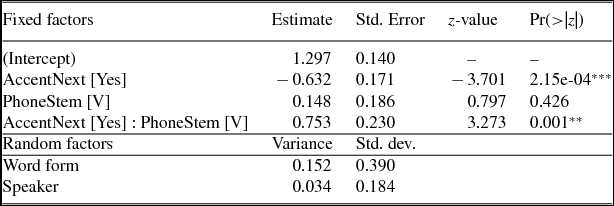
By examining these factors more critically we end up with the factors shown in Tables 10 and 11 as the best predictors for the heard reduction of (ede) in the two periods.
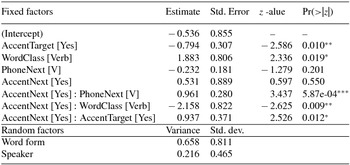
Mixed-model multiple linear regression analysis of (ede), Old generation; 198 observations; random factors: 97 word forms, 20 speakers.

. = p < .1, * = p < .05, ** = p < .01, *** = p < .001
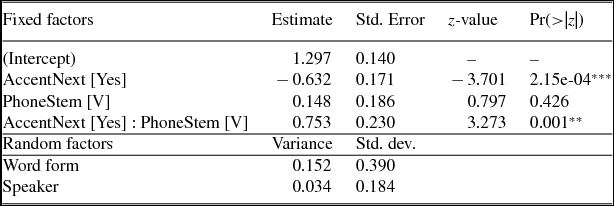
Mixed-model multiple linear regression analysis of (ede), New generation; 142 observations; random factors: 97 word forms, 21 speakers.
. = p < .1, * = p < .05, ** = p < .01, *** = p < .001
Tables 10 and 11 show that accent on the word carrying the variable ending (AccentTarget [Yes]) is an inhibitor of reduction in the Old generation of recordings, but not in the New Generation (this effect was masked in the ‘naïve’ model). In addition, word class loses its significance as a predictor for reduction of (ede) in the New generation. Verbs tend to lose the schwa vowel in the Old recordings more than adjectives, but not in the New recordings. Like we saw for the (te) variable in the New generation, accent on the word following the (ede) word has a significant schwa-preserving effect.
The Old recordings show three interactions, all with AccentNext as one of the factors, and together indicating a complex set of rules for (ede) reduction in the Old generation. The first one, AccentNext with PhoneNext, tells us that if the following word is accented, an initial vowel leads to more reduction than an initial consonant. If the following word is not accented, the effect is marginal and opposite; initial vowel tends to lead to less reduction. This effect is similar to the one shown in Figure 14.
The second interaction, AccentNext with WordClass, tells us that an (ede) appearing in adjectives is more likely to be reduced if the following word is accented. If the word following an adjective is unaccented, (ede) is likely to be retained. For verbs the effect is opposite but not as large. Verbs with (ede) endings are more reduced before unaccented words than before accented ones. In other words, only for verbs does the general picture hold true that following stress inhibits reduction (similar to Figure 10).
The third interaction, AccentNext with AccentTarget, shows that (ede) endings in unaccented words are more likely to be reduced if the following word is also unaccented. If the (ede) ending in an unaccented word occurs before an accented word, it is more likely to be retained. If the (ede) word itself is accented, accent on the following word has very little effect. With an unaccented word following an unaccented target word (with the unaccented (ede)) there will be a sequence of at least four unaccented syllables, and taken together the interaction suggest that such a sequence effects (ede) so that is it reduced by (at least) one syllable.
Neither of these interactions is present in the New recordings, pointing to a rule simplification. Only one individual factor, AccentNext, and only one interaction, AccentNext and PhoneStem, account for the variation in the data. As regards the individual factor, we again observe an effect of accent vs. not-accent of the following word on the preceding (ede) ending: more reduction when the following word is unaccented. The interaction tells us that if the (ede) ending is followed by an accented word, different final stem phones have markedly different effects on the tendency for reduction: before accented words and after stems ending in vowel, (ede) is reduced far more often than after stems ending in a consonant; before unaccented words the PhoneStem effect is neutralized. This effect may be interpreted along the same lines as the interaction between AccentTarget and AccentNext (for the Old generation, Table 10). If the unstressed (ede) appears after a vowel and before an unstressed word, the long sequence of unstressed, vocoid sounds lends itself easily to syllable reduction.
There is a noticeable difference between the sets of factors responsible for reduction of (ede) in the Old and the New generations: Only AccentNext is significant in both periods: accent on a following word is a strong inhibitor of schwa reduction, and, consequently, a following unstressed word causes schwa reduction. This factor is also the only factor that is significant for both variables (Tables 7–8 and 10–11).
7.3 Summary
For both variables, the statistical analyses show that a simplification of the rules that cause schwa reduction has occurred. For (te) this simplification means that NextPhone and AccentTarget are no longer significant predictors as single factors: an accented (te) word is as likely to lose the ending's schwa vowel as an unaccented (te) word. This indicates that there is no longer a (rule-determined) pressure on accented (te) words to have a full, unreduced pronunciation. In addition, in the New generation a following vowel does not cause schwa reduction to a higher degree than a following consonant, or, the other way round: a following consonant causes reduction to the same degree as a following vowel. The interaction with PhoneNext (Table 8), however, shows that a following vowel is still influential in a schwa-reducing process for (te). For (ede) the passing of time leaves the factors AccentTarget and WordClass insignificant, and we see an elimination of the intricate set of three two-way interactions as statistically relevant in the New generation, together pointing to a rule simplification.
The new recordings have shown that a new factor contributes to schwa reduction of
(ede): PhoneStem, i.e. whether the stem of the (ede) word ends in a consonant or a
vowel. We see this as a possible consequence of the fact that the phonetic
articulation of the semi-vowels has changed in the period that our data covers. As
described in Section 4.6, Table 2, in the early part of the period the
semi-vowels had a contoid pronunciation. In the later part of the period, more or
less equivalent to the New generation, this pronunciation changed to become vocoid. A
vocoid establishes an ideal context for vowel assimilation with the following schwa
or [ ] in the (ede) ending, hence causing the effect of a schwa reduction
as a sequence of vowel + [] can easily be simplified to vowel + []. In contrast, a contoid pronunciation, [ʝ] and [v], or a
pronunciation with approximants, [j] and [ʋ], would block or hinder the
vocoid-initial ending -ede from further assimilation. The process
towards assimilation may also be countered by prescriptivism in the particular genre
of formal news reading from which we have drawn our data. It is not entirely unlikely
that speakers will attempt to prevent exactly these ‘natural’ reductions, i.e. they
may hypercorrect their pronunciation. Of course, this observation is subject
to future verification through studies of the development of the pronunciation of
glides in Danish.
The relevance of the factor AccentNext's participation in interactions suggests a rather complex interplay between factors when speakers determine whether to reduce a schwa ending or not. More often than not, there are different reduction rules before accented and unaccented words, e.g. concerning the schwa eliding or schwa preserving effect of preceding and following sounds. For both variables and for both generations, the analyses have consistently shown that the schwa vowel of the (te) and (ede) endings is very likely to be elided before an unstressed word. We see this as an indication that Danish prefers not to have too many unaccented syllables in a sequence, hence that syllable reduction can be seen as a metric phenomenon.
8. CONCLUDING REMARKS
8.1 Language development
This analysis has pointed to two historical developments in formal standard Danish as
represented by radio news readings in the period from 1936 to 2010: (i) The
pronunciation of the ending -ede is changing from a two-syllable
pronunciation to a one-syllable pronunciation, and (ii) the pronunciation of the
glides [j], [ð] and [w] has changed from a contoid pronunciation to a rather more
vocoid pronunciation. The first development is directly reflected in the listeners’
evaluation of the (ede) words. It is also observed by Heegård & Thøgersen
(Reference Heegård and Thøgersen2012), who state that the observed
reduced pronunciation is approaching what is observed in spontaneous speech (see also
Heegård Reference Heegård2012). The second development is
deduced from the fact that in the old recordings a stem-final glide seems to have
blocked reduction, and from the assumption that a position after a stem-final vocoid
is a context especially given to reduction of an ending that has a canonical vocoid
pronunciation, []. This development is documented in detail in spontaneous Danish by
Pharao (Reference Pharao2010a, Reference Pharao2012; see also Grønnum Reference Grønnum2005 and Schachtenhaufen Reference Schachtenhaufen2010b),
and it can in a wider historical perspective be said to be a continuation of the
lenition processes in Danish that have changed stop consonants to fricatives,
fricatives to approximants, and approximants to zero (see Section 4.5).
8.2 Style: Radio news and spontaneous speech
The tendency towards one-syllable pronunciation of (ede) in the modern news readings is, to some degree, in line with the pronunciation in spontaneous Danish. However, we cannot know whether this reflects a change of style for news reading or whether it reflects a general change in Danish pronunciation, or whether it reflects a combination of the two, i.e. Danish pronunciation is changing, but pronunciation in the radio news is changing faster (from a conservative point of departure). For the New generation of recordings we have compared our findings with contemporary studies of spontaneous spoken Danish. Corpora of spontaneous spoken Danish from, say, the 1950s are harder to access. Thus we can only speculate as to whether the news reading pronunciation has always deviated from spontaneous pronunciation of Danish, or whether, as we are assuming, the style is in fact approaching more spontaneous norms in the recent decades. If the news reading style is not shifting, we are led to conclude that (ede) might have had a two-syllable pronunciation in older spontaneous Danish. In order to fully answer this question, future studies will have to investigate the realization of (ede) in spontaneous speech in the 1940s–1960s.
In contrast to the development of (ede) it is an interesting result of this analysis that the pronunciation of (te) does not show the same degree of reduction as can be seen in spontaneous Danish (Heegård Reference Heegård2012, Reference Heegård2013b; Heegård & Thøgersen Reference Heegård and Thøgersen2012). As suggested above, this deviant pronunciation pattern may be the result of a reading-aloud strategy or a correctness ideology. If so, it is peculiar that such extra-linguistic factors only appear to apply to (te) and not to (ede). The different realization patterns between radio news and spontaneous speech indicate that (te) is a stylistic marker of radio news or read speech. Supplementing studies of the patterns of realization of (te) in the 1940s–1960s will tell us whether (te) was also a stylistic marker at that time, or whether today's radio news pronunciation of (te) is a actually a relic of the spontaneous speech of the older period.
For both variables the comparison of the Old and New generations of news readings shows a simplification of reduction rules. Fewer factors are in play, and there are fewer of the intricate interactions between factors. This, of course, does not in itself mean that the pronunciation of news readings has become ‘vernacularized’. It is, however, tempting to assume that the intricate rules in the Old generation were a reflection of a higher degree of awareness of these reduction variables. Only under ideal conditions were (te) and (ede) endings ‘allowed’ to be reduced. The simpler New rules, on the other hand, would reflect a more ‘natural’ approach to the variables, one in which fewer and more generalizable rules are in effect.
As to the question whether the style of the news readings is approaching that of spontaneous spoken Danish, the answer is not very clear. Compared with Heegård's (Reference Heegård2013b) analysis of (te) in modern Copenhagen-based Danish our results show neither a clear convergence nor divergence. Heegård finds word class of target word, the following sound and frequency of target word to be significant predictors. This means that we see a certain divergence between the styles in that frequency loses significance in or New data, and following sound is only a significant predictor in interaction with AccentNext. On the other hand, accent on the target or on the following word does not play a role at all in Heegård's data. The fact that our New data show no effect for AccentTarget whereas our Old data do may be seen as a convergence between the styles.
For (ede), Heegård's (Reference Heegård2012) statistically simpler analysis suggests that accent on the following word as well as the following sound causes the ending to lose a syllable. Comparing with our Old and New data, it is again more tempting to speak of a divergence than a convergence between the styles since PhoneNext was a significant factor but no longer is.
8.3 Reduction phenomena and different speech styles
One point of departure for this article was the observations by Heegård & Thøgersen (Reference Heegård and Thøgersen2012), who show that there are significant differences between the way a number of variables are realized in spontaneous speech and radio news speech. Some variables are often reduced in spontaneous speech, but only rarely in radio news speech; other variables are more often reduced in radio news speech than in spontaneous speech (as illustrated by the DanPASS corpus). Heegård & Thøgersen's (Reference Heegård and Thøgersen2012) results indicate that spontaneous speech and radio news speech are two structurally different speech styles. There are qualitative differences in their reduction patterns; the difference is not merely a matter of radio news speech being less reduced than spontaneous speech. By scrutinizing the linguistic contexts that may cause reduction, the present analysis adds another dimension to the comparability of the two speech styles in question. We believe that similar, detailed factor analyses of variable reduction in different speech styles will give us important insight into both the nature of reduction phenomena and the differences between speech styles. This insight will provide us with a more solid foundation for establishing reduction rules for spontaneous speech and for read speech for Danish, hence also for more solid typological, cross-linguistic comparison.
ACKNOWLEDGEMENTS
We want to express our most humble thanks to three anonymous reviewers and the NJL editors for invaluable comments and suggestions on earlier versions of this article. Their comments forced us to revisit the statistical exposition and focus the article, much to the benefit of the final article. Needless to say, we are responsible for errors and obscurities still in the article after the revision.
Jan Heegård's contribution to this article was funded by the Carlsberg Foundation.