I. INTRODUCTION
The diffracted X-rays from a polycrystalline (powder) sample form a series diffraction cone in three-dimensional (3D) space since large numbers of crystals oriented randomly in the space are covered by the incident X-ray beam. Each diffraction cone corresponds to the diffraction from the same family of crystalline planes in all the participating grains. A two-dimensional X-ray diffraction (XRD2) diffraction pattern from a polycrystalline solid or powder sample can be considered as a cross-section of the detecting plane and the diffraction cones (He, Reference He2009). The conic section takes different shapes depending on the detector shape, swing angle to the direct beam, and distance from the irradiated volume in the sample. For a detector with flat detecting plane, the conic section may be an ellipse, parabola, or hyperbola. For convenience, all kinds of conic sections will be referred to as diffraction rings or Debye rings without referring to their specific shapes. Figure 1(a) is a diffraction frame collected from corundum powder with a two-dimensional (2D) detector. The diffraction rings can be displayed in terms of γ and 2θ coordinates, regardless of the actual shape of the diffraction ring. As is shown in Figure 1(b), the diffraction frame can be converted to an image with a rectangular γ–2θ coordinates. This image can be referred to as the γ–2θ plot or simply the γ plot.
(Color online ) (a) A 2D diffraction pattern from corundum powder and (b) the 2D pattern displayed in rectangular γ–2θ coordinates.

A 2D diffraction pattern can be analyzed directly or by data reduction to the intensity distribution along γ or 2θ. The γ-integration can reduce the 2D pattern into a diffraction profile analogs to the conventional diffraction pattern, which is the diffraction intensity distribution as a function of 2θ angles. This kind of diffraction pattern can be evaluated by most existing software and algorithms for conventional applications, such as, phase identification, structure refinement, and 2θ-profile analysis. However, the materials structure information associated to the intensity distribution along the γ-direction is lost through γ-integration. In order to evaluate the materials structure associated with the intensity distribution along the γ-angle, either the 2D diffraction pattern should be directly analyzed or the γ-profile generated by 2θ-integration should be used.
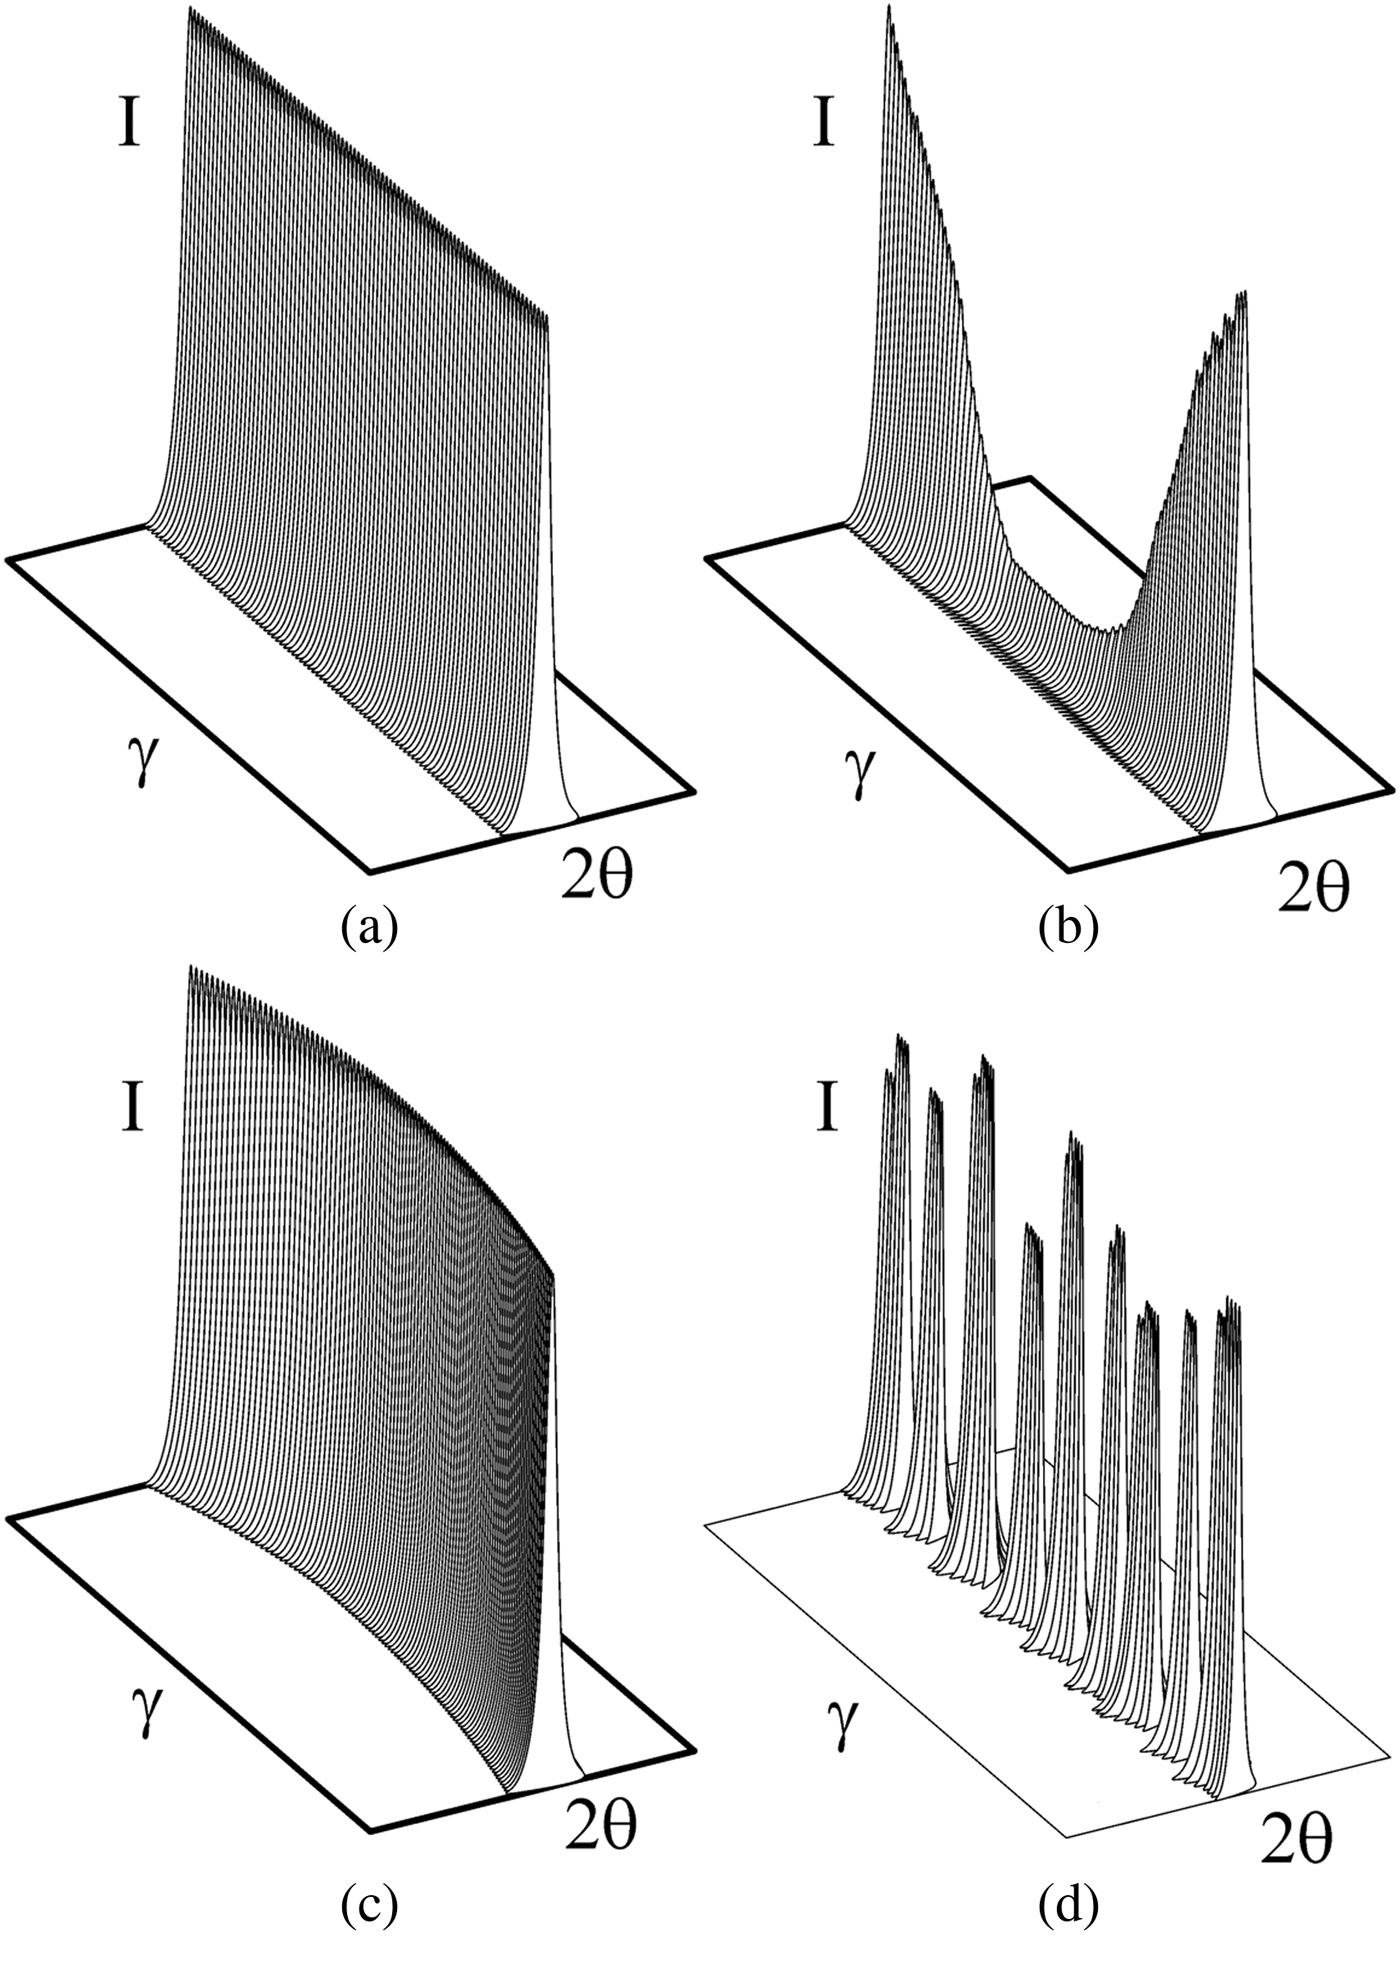
Figure 2 illustrates four γ–2θ plots of a single diffraction ring in the 3D view. Figure 2(a) shows a straight “wall” with a constant 2θ and constant intensity along γ because of the large amount of random fine powder irradiated by the incident X-ray, so that the number of crystallites satisfying the Bragg condition is statistically the same at all γ-angles. Figure 2(b) shows the intensity variation along γ due to preferred orientation. The texture in the sample will change the diffraction intensity measured at different angles, but not the 2θ value. Figure 2(c) illustrates the intensity distribution when the sample contains residual stress or applied stress loading. The d-spacing variation at different orientation because of stress results in the 2θ value variation measured at different γ-angles. Figure 2(d) shows a spotty intensity distribution along γ because of only a limited number of large crystals satisfying the Bragg condition. Apparently, the spottiness is related to the crystal size and size distribution. A real material may contain texture, stress, and/or large crystal size simultaneously, so that the 2D diffraction pattern can be a mix of the above four models.
Illustrations of γ plots from (a) a random fine powder, (b) sample with texture, (c) sample with stress, and (d) a sample with large crystal size.
II. DIFFRACTION VECTOR CONTAINING γ-VARIABLE
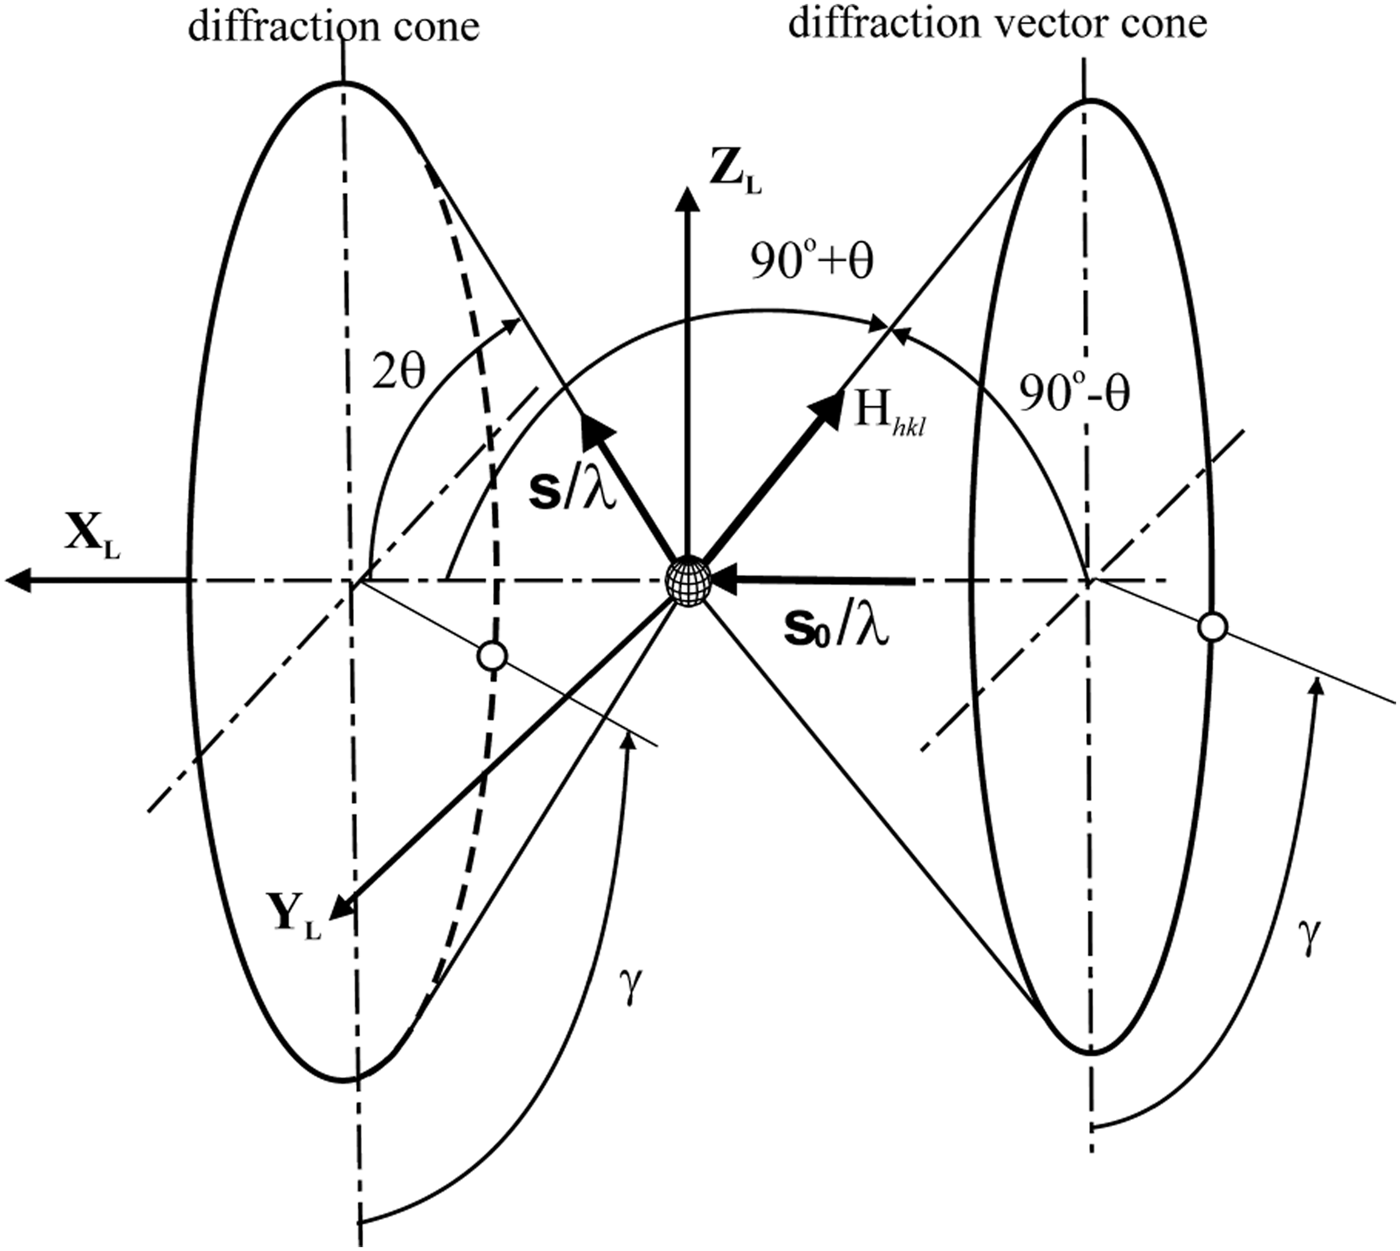
In XRD2 data analysis, the diffraction intensity distribution in both 2θ and γ-directions should be considered. In order to include the diffraction intensity variation in the γ-direction, the diffraction vector (also referred to as scattering vector) should include not only the 2θ variable, but also the γ-variable. Figure 3 illustrates the diffraction cone and diffraction vector cone in the laboratory coordinates XLYLZL. The unit vector of the incident beam is so and the unit vector representing a direction given by 2θ and γ on the diffraction cone is s. The diffraction vector H and its unit vector hL in the laboratory coordinates are given by
 $$\eqalign{{\bi H} & =\displaystyle{{\bi s} - {\bi s}_0 \over \lambda} = \displaystyle{1 \over \lambda} \left[\matrix{\cos 2\theta - 1 \cr - \sin 2\theta \sin \gamma \cr - \sin 2\theta \cos \gamma} \right]\quad {\rm and} \cr & \quad {\bi h}_{\bi L} = \displaystyle{{\bi H} \over \left\vert {\bi H} \right\vert} = \left[\matrix{{\bi h}_x \cr {\bi h}_y \cr {\bi h}_z} \right]=\left[\matrix{ - \sin \theta \cr - \cos \theta \sin \gamma \cr - \cos \theta \cos \gamma} \right]}$$
Diffraction cone and diffraction vector cone in laboratory coordinates.
For the Eulerian geometry with three sample rotation angles (ω, ψ, ϕ), the three components of the unit diffraction vector are given by:
 $$\eqalign{{\bi h}_1 & =\sin \theta \lpar \sin \varphi \sin \psi \sin \omega+\cos \varphi \cos \omega \rpar \cr & \quad +\cos \theta \cos \gamma \sin \varphi \cos \psi \cr & \quad - \cos \theta \sin \gamma \lpar \sin \varphi \sin \psi \cos \omega - \cos \varphi \sin \omega \rpar \cr {\bi h}_2 & =- \sin \theta \lpar \cos \varphi \sin \psi \sin \omega - \sin \varphi \cos \omega \rpar \cr & \quad - \cos \theta \cos \gamma \cos \varphi \cos \psi \cr & \quad +\cos \theta \sin \gamma \lpar \cos \varphi \sin \psi \cos \omega+\sin \varphi \sin \omega \rpar \cr {\bi h}_3& =\sin \theta \cos \psi \sin \omega - \cos \theta \sin \gamma \cos \psi \cos \omega \cr & \quad - \cos \theta \cos \gamma \sin \psi }$$
It will be shown in the following section that, many important equations can be derived from the unit diffraction vector.
III. TEXTURE
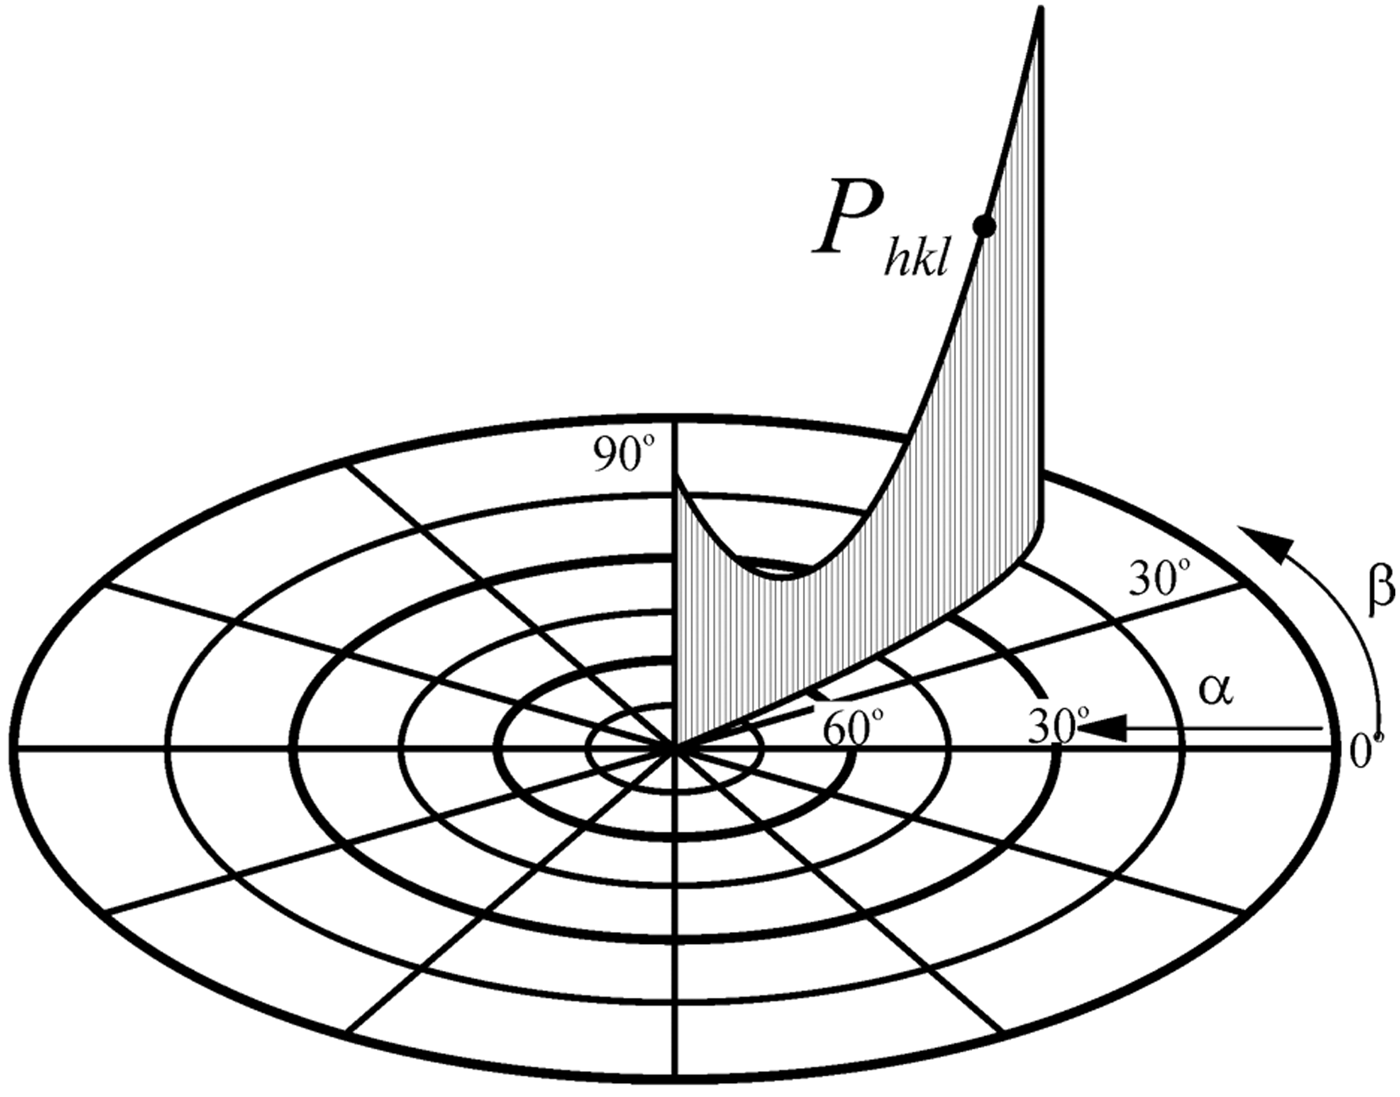
For a sample with texture, the diffraction intensity becomes a function of the sample orientation and γ value. Figure 4 shows the pole density distribution in a pole figure corresponding to the intensity variation along γ from a single 2D pattern. The pole density at (α,β) is proportional to the integrated intensity at the same angles (Bunge and Klein, Reference Bunge and Klein1996):
 $$P_{hkl} \lpar \alpha\comma \; \beta \rpar =K_{hkl} \lpar \alpha\comma \; \beta \rpar \cdot I_{hkl} \lpar \alpha\comma \; \beta \rpar$$
where I hkl (α, β) is the 2θ-integrated intensity of the (hkl) peak corresponding to the pole direction(α, β), K hkl (α, β) is the scaling factor covering the absorption, polarization, background corrections, and various instrument factors if these factors are included in the integrated intensities, and P hkl (α, β) is the pole density distribution function. The pole figure angles (α, β) can be calculated from the unit diffraction vector components by the following pole mapping equations:
 $$\eqalign{\alpha & =\sin ^{ - 1} \left\vert h_3 \right\vert =\cos^{ - 1} \sqrt{h_1^2+h_2^2} \quad {\rm and} \cr & \quad \beta = \pm \cos^{ - 1} \displaystyle{h_1 \over \sqrt{h_1^2+h_2^2}} \quad \left\{\matrix{\beta \geq 0^{\degr}\comma \; &{\rm if} & h_2 \geq 0 \cr \beta \lt 0^{\degr} \comma \; &{\rm if} &h_2 \lt 0} \right.}$$
Pole density mapping from γ-profile to pole-figure
IV. STRESS
X-ray diffraction evaluates stress (either residual stress or applied stress) by measuring the lattice distortion associated to the strain. The sin2ψ method is mostly used for stress measurement with the conventional X-ray diffractometer, which uses either a point detector or line detector to measure the XRD profiles at different ψ-tilt angles (Noyan and Cohen, Reference Noyan and Cohen1987). The fundamental equation for stress measurement with XRD2 can be given as:
 $$\eqalign{& {{\bi S}_1}\lpar {\sigma _{11}} + {\sigma _{22}} + {\sigma _{33}}\rpar + \textstyle{1 \over 2}{{\bi S}_2}\lpar {\sigma _{11}}{\bi h}_1^2 + {\sigma _{22}}{\bi h}_2^2 \cr & + {\sigma _{33}}{\bi h}_3^2 + 2{\sigma _{12}}{{\bi h}_1}{{\bi h}_2} + 2{\sigma _{13}}{{\bi h}_1}{{\bi h}_3} + 2{\sigma _{23}}{{\bi h}_2}{{\bi h}_3}\rpar \cr & = \ln \left(\displaystyle{{\sin {\theta _0}} \over {\sin \theta }} \right)}$$
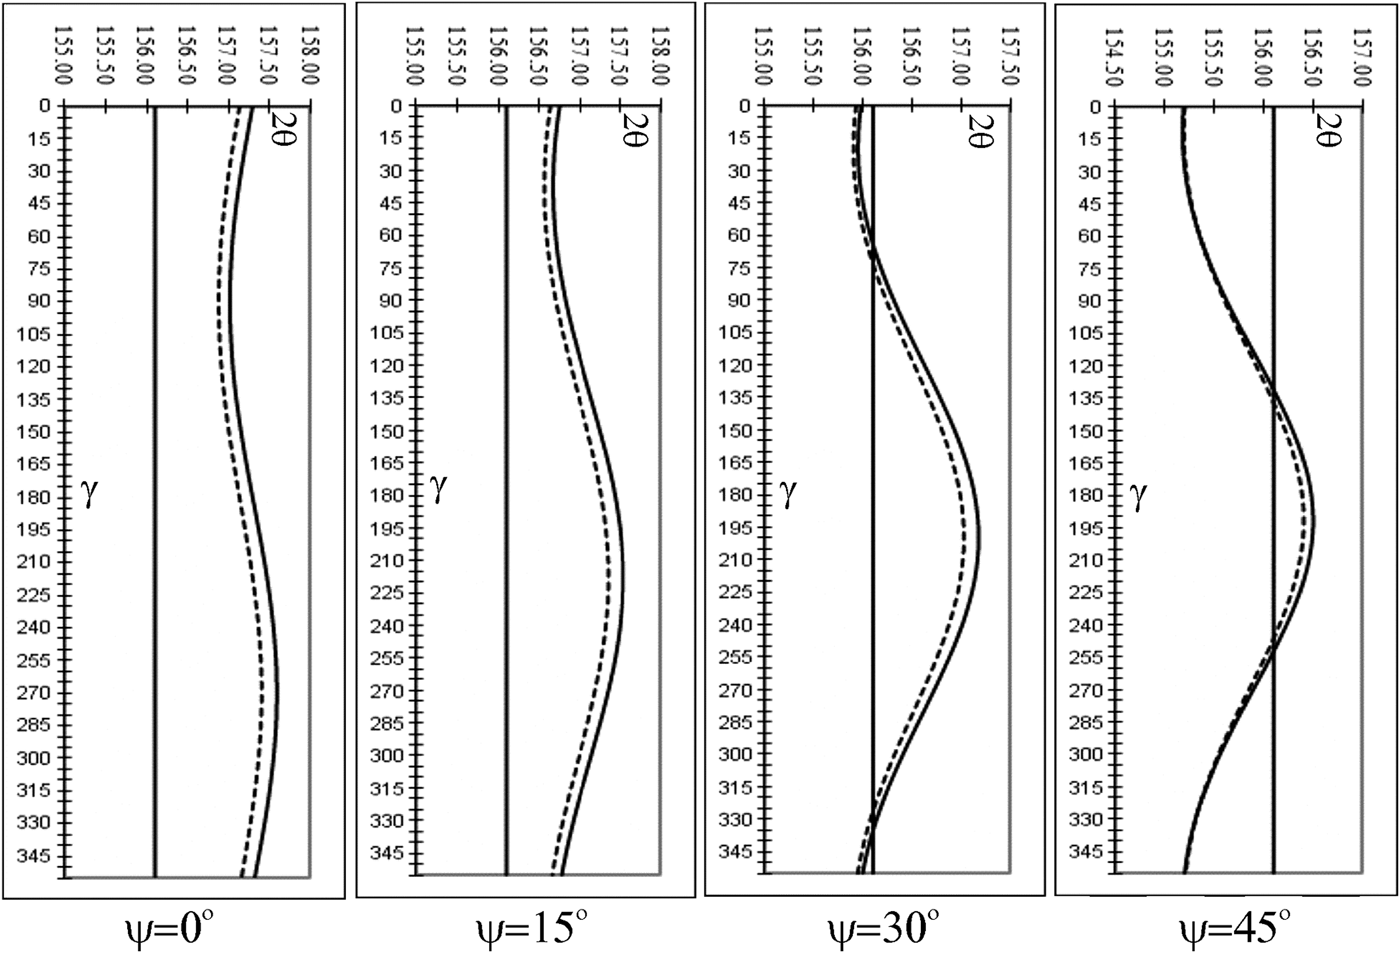
where S 1 and 1/2 S2 are the macroscopic elastic constants, and h1, h2, and h3 are the three components of the unit diffraction vector. By taking various γ values, it defines the 2θ value variation measured at different γ angles for a particular stress tensor and sample orientation. Figure 5 shows the simulated 2θ shift as a function γ for carbon steel with equibiaxial stress σ11 = σ22 = 1000 MPa. The straight solid line represents the stress free 2θ = 156.1°. The goniometer angles set at ω = 78° and ϕ = 0°. The four plots from the left to the right are for ψ = 0°, 15°, 30°, and 45°, respectively. The solid curves represents 2θ shift based on isotropic elasticity and the dotted curves are based on anisotropic factor A RX = 1.49 (He and Smith, Reference He and Smith1998).
2θ vs. γ plots for steel with σ11 = σ22 = 1000 MPa at various ψ angles.
V. CRYSTAL SIZE
The size of the crystallites in a polycrystalline material has significant effects on many of its properties, such as thermal, mechanical, electrical, magnetic, and chemical properties. For instance, the mechanical strength of polycrystalline metals and alloys are strongly dependent on the crystallite size. Another example is the particle size of pharmaceutical substances, which may determine their stability and solubility. Crystal size can be measured by many techniques, such as optical microscopy, electron microscopy, or atomic force microscopy. X-ray diffraction has been used for crystallites size measurement for over 90 years based on the diffraction line broadening and line profile analysis of the convention 2θ-profile. However, the conventional 2θ-profile analysis is suitable for crystallite sizes below 100 nm (1000 Å). The γ-profile analysis is suitable for crystallite sizes from as large as tens of μm down to 100 nm with a small X-ray beam size. Figure 6 shows the atomic force microscope (AFM) images and XRD2 pattern of a sample crystallized from an organic glass with large and small crystal size (Yu, Reference Yu2011). The XRD2 pattern from the sample with fine crystal size shows a smooth diffraction ring, whereas the XRD2 pattern from the sample with larger crystals shows spotty diffraction rings. The crystal size can be measured by the spottiness of the diffraction ring by γ-profile analysis.
(Color online) AFM images and XRD2 patterns of samples crystallized from organic glass with large and small particle sizes.
The detailed theoretical analysis can be found in (He, Reference He2009), but the theory can be simply explained by a “candy box”. The effective diffraction volume, also referred to as gauge volume, can be considered as a candy box. As the number of candies to fill the box depends on the size of the candy and candy box, the number of spots along the diffraction ring in a given γ range is also associated to the crystallite size (also referred as gain size or particle size in some articles). Based on the effective diffraction volume, the crystallographic nature, and crystal size of the sample, the equation for crystal size measured in reflection mode is given as:
 $${\bi d}=\left\{{\displaystyle{{3{\bi p}_{hkl} {\bi A}_0 \beta \arcsin \lsqb\! \cos \theta \sin \lpar \Delta \gamma /2\rpar \rsqb } \over {2\pi ^2 \mu {\bi N}_{\rm s} }}} \right\}^{{1 / 3}}$$
where d is the average diameter of the crystallite particles, phkl is the multiplicity of the diffracting planes, A0 is the cross-section of the incident X-ray beam, β is the divergence of the incident X-ray beam, μ is the linear absorption coefficient, and Ns is the number of crystallites contributing to the diffraction pattern. The Δγ is the measured range of the diffraction ring. Introducing a scaling factor covering all the numeric constants, incident beam divergence, and calibration factor for the instrument, we obtained an equation for the crystallite size measurement in the reflection mode.
 $${\bi d}={\bi k}\left\{{\displaystyle{{{\bi p}_{hkl} {\bi b}^2 \arcsin \lsqb \cos \theta \sin \lpar \Delta \gamma /2\rpar \rsqb } \over {2\mu {\bi N}_{\rm s} }}} \right\}^{{1 / 3}}$$
where b is the size of the incident beam and k = (3β/4π)1/3 if the instrumental broadening in the 2θ direction is given, but we may treat k as a calibration factor, which can be determined from the 2D diffraction pattern of a known standard. Since only a limited number of spots along the diffraction ring can be resolved, it can be seen from the equation that a smaller X-ray beam size and low multiplicity peak should be used if a smaller crystallite size is to be determined.
For measurement in transmission mode with a sample thickness of t, we have:
 $${\bi d}={\bi k}\left\{{\displaystyle{{{\bi p}_{hkli} {\bi b}^2 {\bi t}\arcsin \lsqb \cos \theta \sin \lpar \Delta \gamma /2\rpar \rsqb } \over {{\bi N}_{\rm s} }}} \right\}^{{1 / 3}}$$
The effective sampling volume reaches a maximum for transmission mode diffraction when t = 1/μ. It can be observed from the above equations that the effective sampling volume is proportional to the beam cross-section area and is lower for materials with higher linear absorption coefficients. The sample absorption has a different effect on the sampling volume in reflection and transmission modes. In reflection mode, the linear absorption coefficient determines how fast the incident beam is attenuated within the sample, but there is no clear cutoff for the penetration depth. Therefore, the effective sampling volume has to be used. In transmission mode with the incident beam perpendicular to the sample surface, the linear absorption coefficient affects the relative scattering intensity (counting statistics), but not the actual sampling volume. In other words, all the sample volume within the beam path contributes to the diffraction. Therefore, it is reasonable to ignore the absorption effect for crystallite size analysis as long as the sample is thin enough for transmission mode diffraction.
Figure 7 shows the measurement range of the crystal size analysis by the 2θ-profile collected with conventional laboratory diffractometer and the γ-profile collected with a 2D detector. The 2θ-profile analysis from peak full width at half maximum (FWHM) by the Scherrer equation, or the profile analysis by Stokes and Wilson, is suitable for crystal size below 100 nm, whereas the γ-profile analysis is suitable for crystal size from sub-micrometer to a few millimeters. The size range of γ-profile analysis can be further extended by instrumentation and data collection strategy.
Crystal size measurement range of the conventional 2θ-profile and γ-profile analysis.
VI. CONCLUSIONS
The XRD2 pattern can be described by the diffraction intensity distribution in both 2θ and γ-directions. In order to evaluate the materials structure associated with the intensity distribution along γ-angle, either the XRD2 pattern should be directly analyzed or the γ-profile can be generated by 2θ-integration. A γ-profile may contain information on texture, stress, and crystal size. The diffraction intensity distribution in the γ-direction can be used for materials characterization. Preferred orientation causes intensity variation in the γ-direction. Residual stress results in 2θ shift as a function of γ. Spotty intensity distribution in the γ-direction is associated to crystal size.