Scholars agree that civilian populations that are more prepared for emergencies also react better in the face of one, and are, therefore, less vulnerable to their adverse effects. Reference Peek, Mileti, Bechtel and Churchman1,Reference Hémond and Robert2 Nevertheless, promoting public readiness to emergencies remains a major challenge worldwide. Reference Paton3-Reference Bodas7
Recent studies conducted in Israel concluded that under certain circumstances, namely frequent exposure to emergencies, a unique pattern of risk perception evolves, one that nullifies classic behavioral models that predict preparedness behavior. According to this body of research, when people are exposed to frequent reminders of a threat, they develop mechanisms to block their negative effects to their well-being, for example through de-sensitization or denial. Reference Bodas7
This complexity calls for further exploration of the socio-psychology behind preparedness behavior. The purpose of this study was to assess the perception of threat among the Israeli public using an innovative pictorial representation tool. The Pictorial Representation of Illness and Self-Measure (PRISM) tool was developed by Büchi and Sensky (1999). Reference Büchi and Sensky8 PRISM is a visual metaphor measuring personally salient appraisals and attitudes. Alternatively put, PRISM is a visual metaphor for the relationship between a subject and object(s) possibly associated with it. Reference Büchi, Buddeberg and Klaghofer9
While PRISM was developed originally to assess the perceived burden of suffering due to illness, it has been demonstrated to successfully measure various appraisals both within clinical practice Reference Büchi and Sensky8-Reference Fotiou, Hofmann and Kaufmann11 and beyond, for example, for risk perceptions of travels to regions endemic to tropical diseases Reference Zimmermann, Hattendorf and Blum12 and even in the context of natural hazards perception. Reference Parham, Day and Teeuw13
A recent systematic review of 52 publications using the PRISM tool concluded that “PRISM is likely to have wide applications in assessing beliefs, attitudes, and decision-making, because of its properties, and because it yields both quantitative and qualitative data”. Reference Sensky and Büchi14 Consequently, in this study, the PRISM tool was used to assess threat perception of Israelis toward war and earthquakes and to assess its association with preparedness behavior.
METHODS
Sample
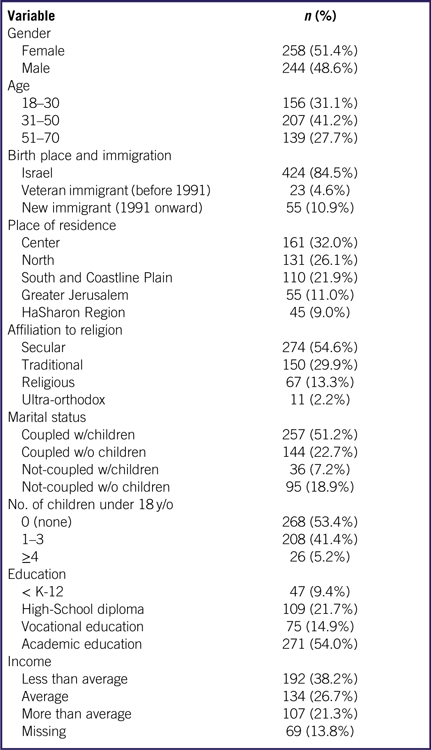
A cross-sectional internet-based survey was performed on November 17–18, 2015. The survey was administered by means of the iPanel internet panel with a 31% response rate. The sample included 502 participants representing the adult Jewish population of the State of Israel. The average age of the participants was 40.4 (range, 18–70 y). The full demographic distributions of the studied sample are presented in Table 1.
Socio-demographic Distribution of Studied Sample (N = 502)

The choice of online survey was made in light of the use of a pictorial representation tool (PRISM; see the Tools section) and the multitude of statements included in the questionnaire, which are easier to administer in writing (as oppose to listening-to on a telephone-based survey). The iPanel provided the best solution for this problem given its pool of over 130,000 people and its ability to address a representative sample of the adult Jewish population of Israel in a short period of time. Since 2006, the iPanel provides an online platform for a wide variety of information collection services, including polls and public opinion surveys. It adheres to the stringent standards of the world association for market, social, and opinion researchers (ESOMAR). In addition, the iPanel was evaluated by the Applied Statistical Laboratory of the Hebrew University in Jerusalem and was found to be highly accurate in assessing internet-based samples on the adult Jewish population in Israel. Reference Nirel15
Tools
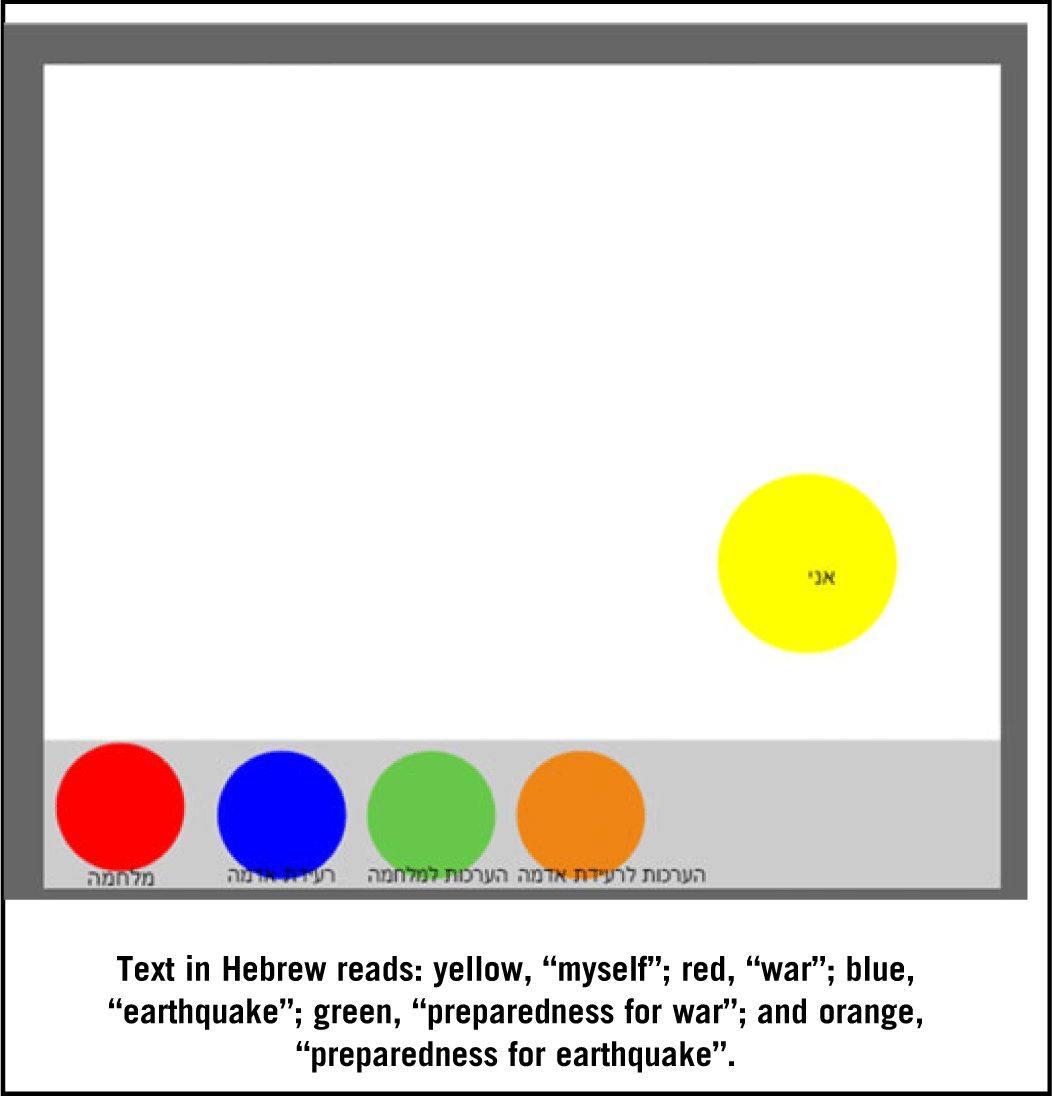
This study used 2 main tools. The first is the digital version of the PRISM tool (iPRISM), in which participants are shown a digital white rectangular board with a fixed yellow disk at the bottom right corner. The participant is told that this yellow disk represents themselves, while the white board represents their life as it is at the moment. Participants are then asked to place 4 color disks representing different threat or preparedness objects (red = war, blue = earthquake, green = preparedness for war, orange = preparedness for earthquake) onto the board. The instructions for this task are as follows: “Please drag the color disks and position them on the board in a manner you think represents the meaning of these topics in your life and in relation to you. For example, if the topic is close to you, position the color disk near the yellow disk (representing you), and if the topic is distant from you position the color disk away from the yellow disk. You can place the color disk anywhere you would like on the board.” The main quantitative measure derived from PRISM is the distance, in centimeters, between the centers of the “object” and “self” disks. Distance measurements range between 0 and 25.6 cm, with smaller values representing increasing association between the participant and the objects at hand. Figure 1 presents the preset screen as seen by participants in the current study.
Preset Screenshot of the PRISM Tool Used in the Study (Adopted and Adjusted From Büchi and Sensky Reference Büchi and Sensky8 ).

It should be noted that the PRISM tool also generates data concerning the angles between the yellow (self) and other disks. These data can be indicative of prospects of subject-object relations, because different parts of the board allow for either short range distance or longer range distance. For example, placing the color disk in the upper right section of the board is associated with significantly higher depression and anxiety scores, because the object (usually illness) cannot move as far away from the “self” as in other sectors (unpublished data). However, the angles data in this study cannot generate meaningful findings of the studied behavior, and are, therefore, not shown.
The second tool used was a preparedness questionnaire developed and validated in previous studies. Reference Bodas, Siman-Tov and Kreitler16,Reference Bodas, Siman-Tov and Kreitler17 This questionnaire assessed the Preparedness Index (PI), a self-reported measurement of preparedness. It is assessed by tallying the number of preparedness actions reported by a participant as complied-with out of 14 preparedness actions recommended by the civil defense authorities (see Box 1, Cronbach’s alpha: 0.745).
List of action items suggested by the Israeli civil defense authorities for households’ preparedness towards emergency (in alphabetical order)
-
Acquiring a fire extinguisher
-
Acquiring bottled water (4 Liters per person)
Acquiring canned or wrapped food items
-
Acquiring emergency flash light
-
Acquiring first aid kit
-
Acquiring gas mask(s)
-
Acquiring items for sealing the safe room (nylon sheets, adhesive tape)
-
Acquiring radio and batteries
-
Creating backup copies of important documents
-
Identifying the safe room in the house
-
Preparing a family response plan and exercising it
-
Preparing an evacuation bag with personal necessities
-
Preparing communication means in safe room
-
Preparing entertainment solutions for lengthy stay in safe room
Study Procedures
Participants in this study were first presented with and asked to complete the PRISM task. Following the successful completion of the PRISM task, participants were asked to provide their answers to the PI questionnaire. Demographic data were collected through the iPanel background information on each participant. Data were presented for analysis as an anonymous dataset.
Statistical Analysis
The statistical analysis of the results was performed using SPSS Version 23. The analysis included both descriptive and analytical methods, and the statistical tests were chosen according to variables distribution. Before analysis, indices were generated and their reliability was assessed using Cronbach’s alpha. Spearman correlation test was used to examine correlations between continuous variables. In all statistical analyses performed, a P-value of 0.05 or less was determined as statistically significant.
RESULTS
Subjects were asked to provide a visual representation of their relation to emergency and preparedness through the PRISM tool. Figure 2 illustrates the mean distance measurements obtained. The medians were identical to the means for all items except “War”, in which the median was slightly smaller (7.64 cm).
Mean Distance and Standard Deviations (in Centimeters) of Threat and Preparedness Objects From Subjects.

The results demonstrate a tendency of participants to distant themselves from the concepts of earthquake more so than war, with both the actual threat and the preparedness disks of earthquakes placed further away from the yellow disk (representing oneself) compared with the equivalent disks of war.
For both war and earthquakes, participants tended to place the associated preparedness disks closer than the actual threats. In other words, per each of the threats analyzed, the preparedness disks were placed closer to the yellow (“Self”) disk in comparison to the disks representing the actual threats (war and earthquake).
The Spearman correlation test between the distance measurements and the Preparedness Index (PI) yielded mixed results (Table 2). No statistically significant correlation was observed between the PI and the distance assigned by a participant between the yellow disk (“Self”) and the threats of war or earthquakes. However, a negative correlation between the PI and the distance measurements of both preparedness disks was observed. In other words, the further a participant places each of the preparedness disks, the less he or she are complying with the civil defense recommendations for household adjustment for war, or vice versa.
Spearman Correlation Between the Preparedness Index (PI) and Distance Measurements Obtained From the PRISM Tool (N = 502)

NS Non-significant.
** Significant at the P < 0.01 (2-tailed).
*** Significant at the P < 0.001 (2-tailed).
The correlation analysis also reveals that participants hold similar notions toward the threats of war and earthquake in the sense that they tend to couple them either close to oneself or far away from it. In addition, all 4 “Objects” are positively correlated with one another, suggesting and overall co-linearity of the constructs. Of particular importance, preparedness to war and preparedness to earthquake are positively correlated, suggesting that people tend to perceive their preparedness (or unpreparedness) as either high for both or low for both.
DISCUSSION
The PRISM is a tool usually used to assess individual perception of health-related risks, namely diseases, and health behaviors. To the best of our knowledge, this is the first attempt to use the PRISM tool in a broader definition of health behavior that includes preparedness behavior for emergencies.
The results obtained from the PRISM tool suggest that that the adult Jewish population in Israel holds different threat perception of emergency threats (war and earthquake). As expected, participants in this study placed the threat of war closer in distance to the pictorial representation of themselves (the yellow disk). However, no significant correlation was found between reported preparedness behavior and the distance of oneself from these threats. This finding suggests that preparedness among Israeli Jews has little to do with the perception of the threat itself. In fact, this finding resonates other findings according to which the Israeli public is “victimized” by emergency to the extent that they become either indifferent to it or use denial as an adapted coping mechanism to reduce the anxiety it raises. Reference Bodas7 Israelis are not triggered to take preventive action in the form of preparedness when confronted with the threat. Instead, they find ways to circumvent the need to deal and end up ill-prepared.
The fact that preparedness behavior was found to be negatively correlated with the distance of the preparedness disk for both threats only serves to solidify the conclusion presented above. Only when an Israeli associates him/herself with the concept of preparedness, by placing it close to themselves, can you see the increase in their PI. Alternatively, only Israelis who practice preparedness behavior tend to associate the preparedness disks closer to themselves. In any of the wording variations, the conclusion is the same:Israelis are aware of their preparedness levels. Households less prepared to emergencies remain this way despite being aware of the threat, ie, they choose to postpone their preparedness behavior to when the threat might become real and imminent. Reference Bodas, Siman-Tov and Peleg18 The fact that these findings were consisted for both war and earthquake, even though the PI in this study measures preparedness mostly for war, might serve to support the generalization of the claim.
Moreover, the co-linearity demonstrated between all 4 “objects” (war, earthquake, preparedness to war, and preparedness to earthquake) can serve to demonstrate the generalizability of the concept of emergency in the eyes of Israelis. Despite the fact that one threat is frequently encountered and the second very seldom, Israelis group emergency threats together and treat them similarly. The consolidated concept of “emergency” is then dealt with the same mechanisms that postpone and delay action. If a certain household is oriented toward taking preventive action, they are likely to do so for a variety of relevant threats, but if they are lacking the motivation to do so they are likely to ignore them all.
Research Limitations
This study has several important limitations. First, the need to administer the questionnaire in a visual manner to a nation-wide audience necessitate the use of an online panel. The choices for online panels in Israel are limited if one wishes to maintain a high standard of sampling and survey conduct. The iPanel was the most suitable choice for this survey; however, at the time this study was conducted, it used to be limited in reaching Arab citizens of Israel. As a result, the conclusions made in this study are limited to the adult Jewish population in Israel and cannot be further generalized. Second, the preparedness behavior in this study is measured by means of the Preparedness Index, which is a self-report measure, and is, therefore, prone to reporting biases. Lastly, the questionnaire used in this study asked participants to estimate their perception of preparedness before completing the actual preparedness questionnaire, which lays out what preparedness really entails. Although there is evidence to support that Israelis are aware of the term “preparedness” and its components, one cannot rule out that in a reverse order of questioning, participants might have provided different answers.
CONCLUSIONS
This study demonstrates the difficulty in promoting public readiness. It highlights the disparity between classic risk reduction strategies which argue that awareness is key in promoting public preparedness, and the reality. At least in the case of Israeli Jews, awareness to threat does not promote public preparedness. Overcoming the challenges associated with motivating individuals to perform preparedness behavior should consider innovative approaches. Of additional importance, this study validated the use of PRISM tool for the assessment of perception of emergency threats and emergency preparedness.
Acknowledgments
The author thanks K. Peleg and S. Kreitler for their guidance and supervision of this work.
Funding
This study was funded by the department of Emergency Management & Disaster Medicine, School of Public Health, Sackler faculty of Medicine, Tel-Aviv University.