Tetracyclines (TCs) are broad-spectrum antibiotics (ATBs) with antimicrobial action against a variety of Gram-negative and Gram-positive bacteria (Hlavka & Boothe, Reference Hlavka, Boothe, Hlavka and Boothe1985; Roberts, Reference Roberts1996). These molecules prevent bacterial growth by inhibiting protein synthesis (Rasmussen et al. Reference Rasmussen, Noller, Daubresse, Oliva, Misulovin, Rothstein, Ellestad, Gluzman, Tally and Chopra1991). In fact, TCs interfere in the binding between aa-tRNA and the site 30S ribosomal subunit, which inhibits the elongation of the peptide chain (Chopra et al. Reference Chopra, Hawkey and Hinton1992).
In veterinary medicine, TCs are used in prevention and treatment of several diseases of cattle, pig, poultry and fish (Aga et al. Reference Aga, Goldfish and Kulshrestha2003). In dairy cattle, TCs are employed frequently for the treatment of bacterial enteritis, metritis, mastitis and infectious keratoconjunctivitis. An investigation carried out by European Federation of Animal Health regarding the use of ATBs in veterinary medicine indicates that TCs represent 65% of antibacterial agents used for therapeutic or preventive purposes (Bogialli et al. Reference Bogialli, Curini, Corcia, Lagana and Rizzuti2006).
The presence of ATBs residuals in milk may cause different diseases or disorders in human consumers (Dewdney et al. Reference Dewdney, Maes, Raynaud, Blanc, Scheid, Jackson, Lens and Verschueren1991; Demoly & Romano, Reference Demoly and Romano2005; Wilke et al. Reference Wilke, Lovering and Strynadka2005). Moreover, these residues can modify or inhibit the fermentation processes during the elaboration of dairy products such as cheese and yogurt (Packham et al. Reference Packham, Broome, Limsowtin and Roginski2001).
For this reason, monitoring ATBs residues is very important for the control of food safety and innocuity. Furthermore, a Maximum Residue Limits (MRL) of 100 μg/l for TCs residues in milk have been established by several control authorities such as the European Union (Council Regulation, 2009) and Codex Alimentarius (2010). Microbiological inhibition methods are successfully used to ensure the minimum levels of antimicrobial residues in milk, because they allow analysis of a high number of samples in a relatively short time and at low cost (Toldra & Reig, Reference Toldra and Reig2006; IDF, 2010). Also, receptor-binding tests are used to detect tetracycline in milk, because they provide a response in a short time (IDF, 2010).
The most commonly used microbiological methods contains spores of Geobacillus stearothermophilus subsp. calidolactis (Pikkemaat, Reference Pikkemaat2009) due to its fast growth at high temperatures (64 °C) and good sensitivity for detecting beta-lactams in milk, although this bacteriological test exhibits a limited sensitivity for TCs residues (Diserens et al. Reference Diserens, Beck Henzelin, Le Breton and Savoy Perroud2005; Navrátilová, Reference Navrátilová2008; Nagel et al. Reference Nagel, Molina and Althaus2013).
Due to this limited sensitivity for TCs, Nagel et al. (Reference Nagel, Molina and Althaus2011) proposed the use of chemometric techniques for the design of bioassays in microtiter plates with Bacillus cereus for detection of these residues in milk. This biossay is easy to implement in laboratories for the analysis of large amounts of samples because it shows a dichotomous response of simple interpretation (positive or negative) in a short time period (5 h). However, the use of this microorganism may present risks, as vegetative cells or spores of B. cereus can produce enterotoxin and emetic toxin (Logan & de Vos, Reference Logan, de Vos, De Vos, Garrity, Jones, Krieg, Ludwig, Rainey, Schleifer and Whitman2009) which cause diarrhoea and emetic syndrome (Abee et al. Reference Abee, Groot, Tempelaars, Zwietering, Moezelaar and van der Voort2011).
Therefore, the objective of this study was to apply experimental design techniques and a logistic regression model to optimise a bioassay in microtiter plates with Bacillus pumilus for the detection of TCs residues at levels approximate to MRLs, since it is an innocuous bacterium.
Material and methods
Bioassays elaboration
Mueller Hinton culture medium (38 g/l, Biokar, Francia, Ref. 10272) was fortified with glucose (10 g/l, Anhedra®, Argentina, Ref. 6837), adjusted to pH = 8·0 ± 0·1 and a combination of indicators were added consisting of Brilliant Black (200 mg/l, Sigma Aldrich®, Ref. 211842) and Toluidine Blue (10 mg/l, Anhedra®, Argentina, Ref. 6356). Then, this medium was inoculated with different concentrations of B. pumilus CECT 510 spores and CAP (1000 μg/ml, Sigma Aldrich®, Ref. C0378) which are detailed below for each experiment.
Each microplate well was filled with 100 μl culture medium using an electronic dispenser (Eppendorf Research® Pro, Eppendorf, Germany). Subsequently, the microplate was sealed with aluminised bands and preserved refrigerated at 4 °C.
Analysis of dose-response curves
An antimicrobial concentration scale was used (detailed below for each experiment) for studying dose-response curves of the bioassays. For every ATBs, 16 replicates of 12 concentrations were assayed in order to obtain negative results in the first two levels of ABTs and two positive results in the last two concentrations tested. A volume of 50 μl was added into each microplate well. Then, the bioassay was left at room temperature for 1 h to allow the ATB to diffuse into the culture medium. Subsequently, they were washed 3 times with distilled water and incubated in a water floating bath at 40 ± 1 °C until negative samples changed the indicator's colour. Photometric readings were measured with an ELISA reader (Biotek ELx800TM, Biotek Instrument Inc., Winooski, Vernont, USA) using a wavelength of 550 nm. Photometric measurements were transformed by the following equation:
 $$\hskip 7pc A = \displaystyle{{(A_x - A_0 )} \over {(A_{100}} - A_0 )}$$
where: A: relative absorbance, A x = absorbance of the milk sample with an ‘x’ ATB concentration; A 0: absorbance of ATB-free milk (negative control) and A 100: absorbance of the milk sample that yielded 100% positive results. These relative absorbance values were analysed using the LOGISTIC procedure of the statistical package StatGraphics Plus versión 5.1 Centurión® (2008). Then, for each experiment, Detection Limits were calculated as the concentration of ATBs that produces 45% of relative absorbance (Luitz & Suhren, Reference Luitz and Suhren1995).
Effect of the spore concentration on the response time of the bioassay
A volume of culture medium was prepared as described above and was divided into five aliquots to evaluate the effect of different B. pumilus spore concentration (1·6 × 109, 8 × 10⁷, 6·4 × 106, 1·2 × 106 and 2·5 × 105 spores/ml) on the detection limit and response time of the bioassay. These concentrations were obtained by serial dilutions of B. pumilus spore suspension (1·6 × 1011 spores/ml) determined by counting with PetrifilmÔ plates (3M, St Paul, MN, USA).
Oxytetracycline (Sigma O-5750) was used to study the detection limit (OTC: 0, 500, 750, 1000, 1250, 1500, 1750, 2000, 2500, 3000, 4000, 5000 μg/l). When the negative samples shifted colour (black to yellow), the incubation time and the relative absorbance was recorded. The following logistic regression model was used:
 $$L_{ijk} = {\rm Logit}\,[A_{ijk} ] = \beta _0 + \beta _1 OTC_i + \beta _2 \log S_j + \beta _3 \log S_j^2 + \varepsilon _{ijk}$$
where L ijk = lineal logistic model; A ijk = relative absorbance (Eq. 1); β0 = intercept; β1, β2, β3 = estimated parameters for model; OTCi = Oxytetracycline concentration (i: 1, 2,…12 levels); log S j = logarithmic transformation of the spore concentration; log S j2 = square of the logarithmic transformation of the spore concentration and εijk = residual error.
Effect of CAP concentration on the TCs detection limits
Culture medium prepared as described above was inoculated with 1·6 × 109 spores/ml of B. pumilus. Then, it was divided into four aliquots to evaluate different CAP concentrations (CAP: 0, 1500, 2000 and 2500 μg/l). So, the TCs detection limits were assessed using the following concentration scales: oxytetracycline (Sigma O-5750, OTC: 0, 25, 50, 75, 100, 150, 200, 250, 300, 400, 600, 800 μg/l), tetracycline (Sigma T-3258, TC: 0, 50, 75, 100, 150, 200, 300, 400, 500, 600, 800, 1000 μg/l) and clortetracycline (Sigma C-4881, CTC: 0, 50, 75, 100, 150, 200, 300, 400, 500, 800, 1000, 1500 μg/l), Since, the graph of dose-response curve should include at least two negative and two positive concentrations (Codex Alimentarius, 2010). The regression logistic model was used:
 $$\eqalign{L_{ijk} &= {\rm Logit}\,[A_{ijk} ] = \beta _0 + \beta _1 [{\rm TCs}]_i + \beta _2 [CAP]_j \cr & \quad+ \beta _{12} ([{\rm TCs]} \ast [{\rm CAP}])_{ij} + \varepsilon _{ijk}}$$
where: L ijk = linear logistic model; [A ijk] = relative absorbance (Eq. 1); [TCs]i = effect of tetracycline concentration (i = 1, 2,…12 levels); [CAP]j = effect of CAP concentrations (j = 0, 1500, 2000 or 2500 μg/l); ([TCs] × [CAP])ij = effect of interaction between tetracycline and CAP concentrations; β0, β1, β2, and β12 = coefficients estimated for the model and εijk = residual error.
Specificity of the bioassay
The milk samples used in this study came from untreated Holstein Friesian animals. In addition, the values of pH, chemical composition, somatic cell counts (SCC < 400 000 cells/ml) and bacterial count (CFU < 100 000 cfu/ml) were acceptable for dairy cattle. The chemical composition, SCC and CFU were determined with Milko Scan FT-120 (Foss Somatic, USA), Fossomatic 90 (Foss Electric, USA and BactoScan 8.000S (Foss Electric, USA), respectively.
Milk samples were assayed in duplicate using bioassays without CAP and with 2500 μg CAP/l. Visual Interpretations were carried out by three qualified scientists that categorised the response as positive or negative. Only responses with at least two (out of three) coincidences were considered. Specificity was calculated using the following equation:
 $$\hskip 2.4pc{\rm Specificity} = ({\rm negative}/{\rm total \ samples}) \times 100$$
Cross-specificity: detection limits for other ATBs
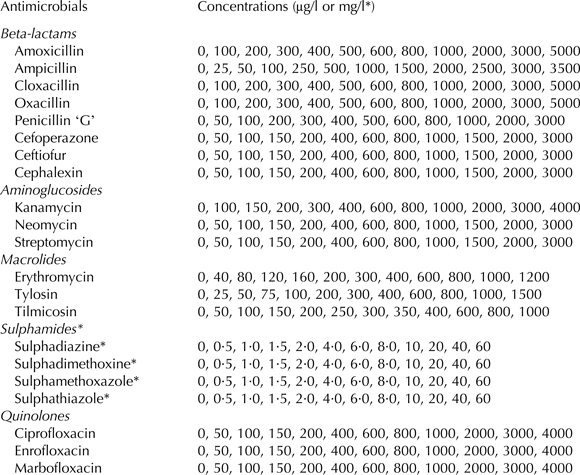
Bioassays were developed using a culture medium (see above) inoculated with 1·6 × 109 spores/ml of B. pumilus and 2500 μg CAP/l. Detection limits were studied for 8 Beta-lactams (amoxicillin, ampicillin, cloxacillin, oxacillin, penicillin ‘G’, cefoperazone, ceftiofur and cephalexin), 3 Aminoglycosides (kanamycin, neomycin and streptomycin), 3 Macrolides (erythromycin, tylosin and tilmycosin), 4 Sulphonamides (sulphadiazine, sulphadimethoxine, sulphamethoxazole, and sulphathiazole) and 3 Quinolones (ciprofloxacin, enrofloxacin and marbofloxacin). For each ATB, concentrations described in Table 1 were tested. For statistical analysis the following logistic regression model was used:
 $$L_{ij} = {\rm Logit}\,[A_{ij} ] = \beta _0 + \beta _1 [{\rm ATB}]_i + \varepsilon _{ij} $$
where: L ij = logistic linear model; [A ij] = relative absorbance; [ATB]i = effect of antibiotic concentration (i = 1, 2,…12 levels, Table 1); β0 and β1 = estimated coefficients and εij = residual error.
Antimicrobial concentrations used to determine the detection limits of the bioassay using Bacillus pumilus

Results and discussion
Spore concentration effect on the response time of the bioassay
The spore concentration effect on the dose-response curve of OTC in milk for the bioassay using B. pumilus indicates significant effects for the linear and quadratic terms (log S, χ2 = 4·795; log2S; χ2 = 3·090, respectively) according to the following equation:
 $${\rm Logit}\,P = {8.353 + 0.014\,\,OTC - 2.919\,\,\log S + 0.162}\log ^2 S\quad (C = 90.95\% )$$
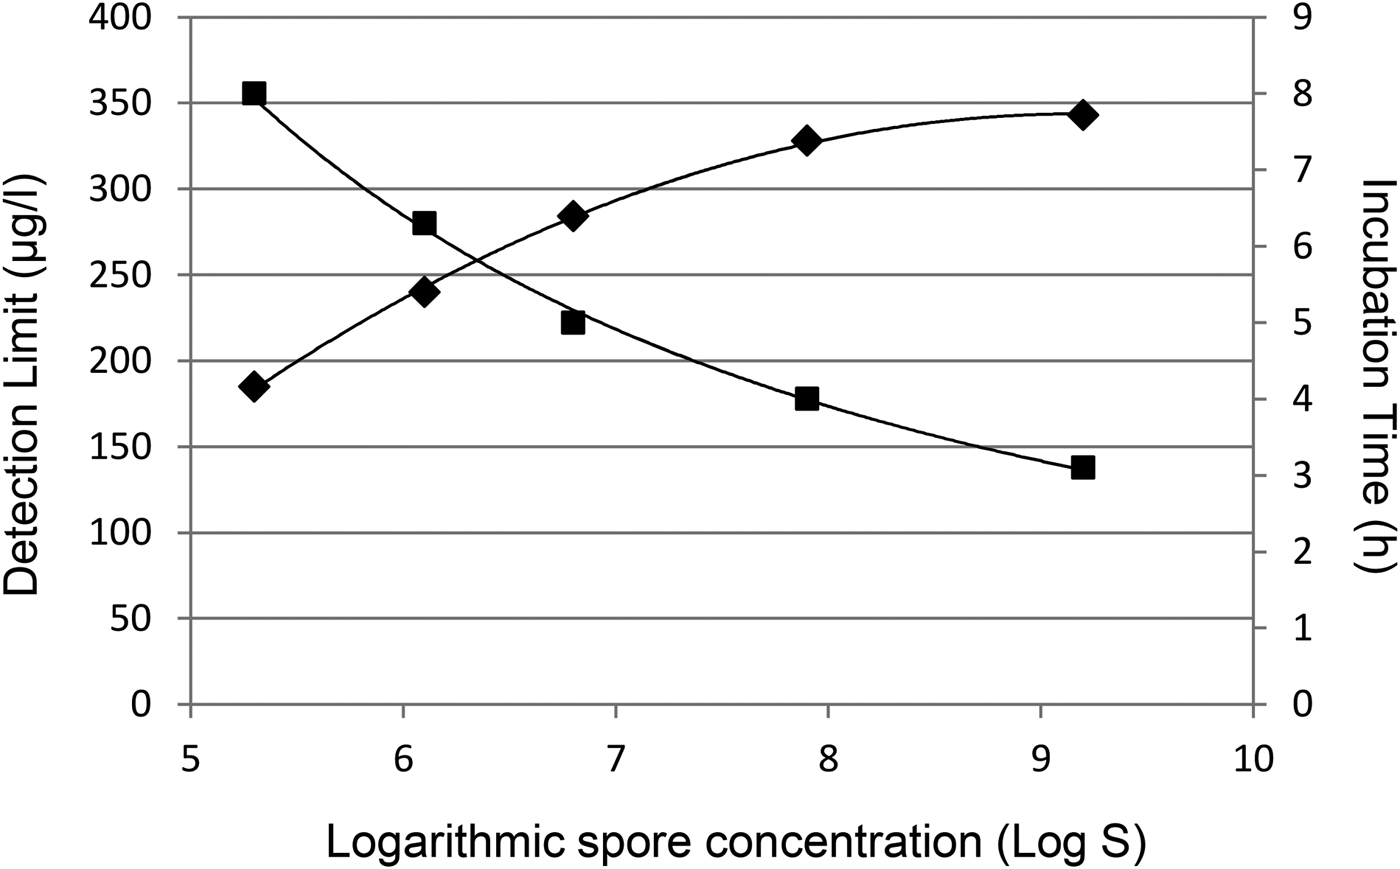
Figure 1 visualises incubation time and detection limit obtained for different B. pumilus levels. An increase in spore concentration produces a rise of OTC detection limit accompanied by a decrease in the response time due to increment in the acidification caused by B. pumilus, which is observed as a faster change in the colour indicator.
Effect of spore concentration on incubation time (■) and detection limits (♦) of the bioassay.
Effect of CAP concentration on TCs detection limits
Table 2 shows χ2 and P-values for the factors included in the model (Eq. 3). The TCs and CAP effects were significant (P < 0·0001) while their interactions were not significant (P > 0·05). For the three TCs assayed, χ2 coefficient of CAP effect was high (χOTC2 = 8·696, χTC2 = 5·416, χCTC2 = 4·560) indicates the importance of CAP incorporation to improve the bioassay sensitivity for this antimicrobials group.
χ2 values and estimated probability for different factors affecting the response of bioassays with addition of CAP for the detection of TCs
TCs, Tetracyclines; CAP, Chloramphenicol
The interaction of both terms (TCs × CAP) was not significant for all three TCs. This indicates that there was not a synergistic effect between these antimicrobials. Therefore, we can determine that an additive model holds for (Eq. 3). This absence of synergism was observed by Nagel et al. (Reference Nagel, Zapata, Basílico, Bertero, Molina and Althaus2009, Reference Nagel, Molina and Althaus2011), who added CAP in the culture medium to improve the sensitivity to TCs of G. stearothermophilus and Bacillus cereus, respectively.
Equations calculated by logistic regression models for factors that significantly affect the response of the bioassay ([TCs] and [CAP]) are summarised in Table 3. All models showed adequate concordance coefficients (OTC = 89·9%; TC = 87·6% and CTC = 87·6%). The ‘β1’ coefficients indicate increases the percentage absorbance relative to the extent that rise concentrations of TCs in milk. These coefficients showed that B. pumilus had greater sensitivity to detect residues of OTC (β1 = 0·0115) than TC (β1 = 0·0090) and CTC (β1 = 0·0070).
Logistic regression models representing the effects of concentration of each TCs and different levels of CAP on the response of the bioassay
TCs, Tetracyclines; CAP, chloranphenicol; CTC, Clortetracycline; OTC, Oxytetracycline; TC, Tetracycline; C%, concordance coefficient
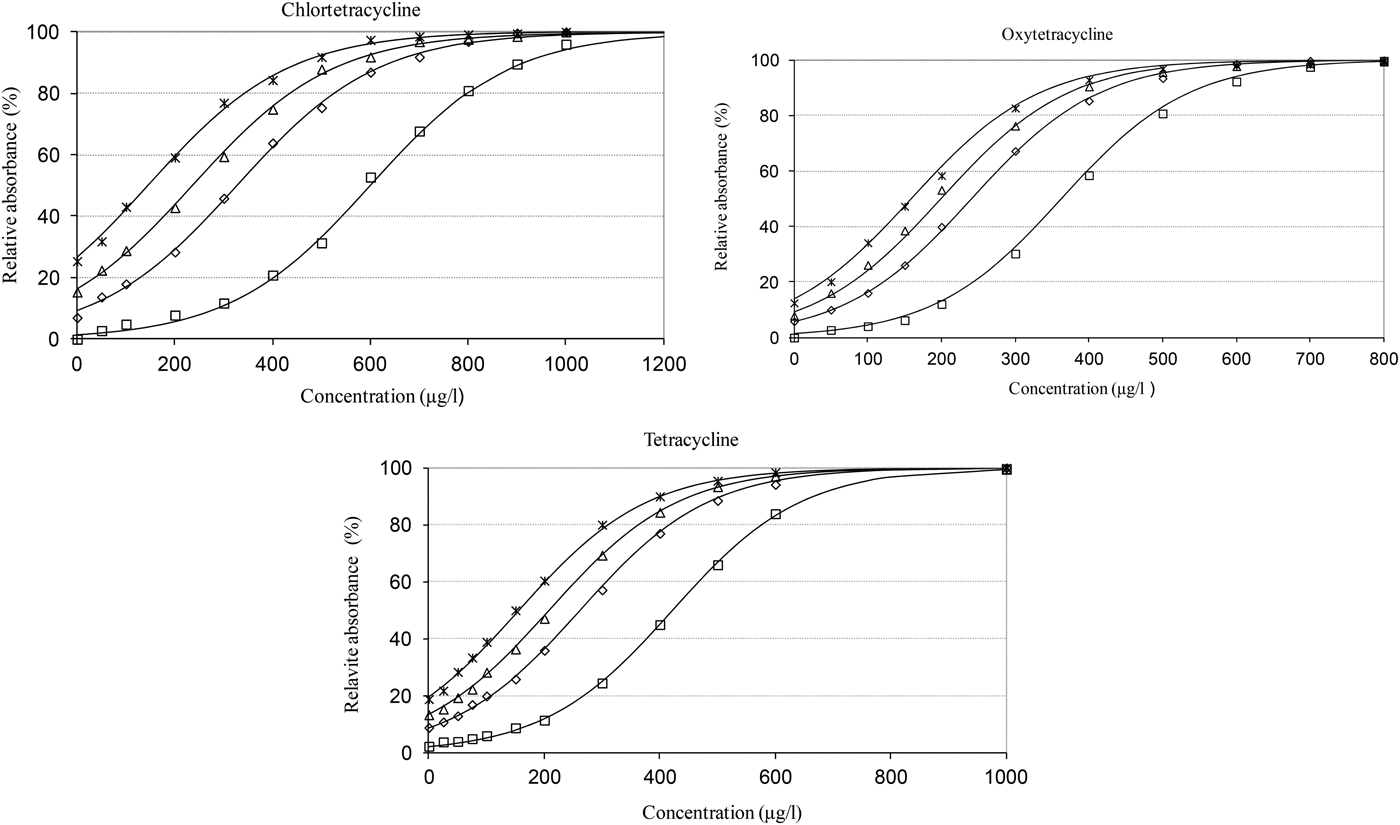
The ‘β2’ coefficients indicate the effect of CAP on the relative absorbance of the bioassay. The CAP addition produces greater effect on the detection of CTC (β2: 0·0013) than OTC (β2: 0·0009) and TC (β2: 0·0009). Therefore, addition of CAP will produce a greater reduction of detection limits for CTC than for OTC and TC. Conversely, Nagel et al. (Reference Nagel, Molina and Althaus2011) obtained higher values of ‘β2’ for OTC (β2: 0·0051) and TC (β2: 0·0057) compared with CTC (β2: 0·0023) in the optimisation of a bioassay employing B. cereus. Figure 2 depicts the effects of [CAP] and [TCs] on the bioassay's relative absorbance. For the three TCs assessed, the percentage of relative absorbance increases as concentrations in milk increase. This addition of CAP produces a displacement of dose-response curves to lower detection levels, which is more marked for CTC than OTC and TC (Fig. 2) due to its higher ‘β2’ coefficient (Table 3). The dose-response curves constructed using the logistic model overestimate the relative absorbances at low TCs concentrations. Therefore, the logistic curves estimated by the model showed absorbances for antibiotic-free samples (TCs concentration = 0 μg/l).
TCs dose-response curves for different chloramphenicol concentrations (□ CAP: 0 μg/l; ◊ CAP: 1500 μg/l; ∆ CAP: 2000 μg/l; × CAP: 2500 μg/l).
The bioassay's detection limits (Table 4) were calculated for the three TCs in milk with different CAP levels using the criterion of 45% of relative absorbance from the equations in Table 3. Also, Table 4 shows MRLs for the three TCs established by the current legislation (100 μg/l).
Effect of the concentration of CAP on the detection limits of TCs in milk samples

TCs, Tetracyclines; CAP, chloramphenicol; MRLs, Maximum residue limits
The incorporation of CAP in the culture medium (from 0 to 2500 μg/l) causes a decrease in the detection limits for OTC (from 346 to 142 μg/l), TC (from 380 to 105 μg/l) and CTC (from 575 to 117 μg/l). The levels detected by bioassay fortified with 2500 μg CAP/l are appropriate and slightly higher than the MRL established by the legislation (100 μg/l). The detection level of TC was similar to the value reported by Nagel et al. (Reference Nagel, Zapata, Basílico, Bertero, Molina and Althaus2009) when 400 μg CAP/l were incorporated into a bioassay using G. stearothermophilus (DLTC:158 μg/l). However, B. pumilus detected lower concentrations of OTC and CTC (Table 4) than G. stearothermophilus (DLOTC: 273 μg/l, DLCTC: 316 μg/l) reason that its use may be recommended for a more efficient control of TCs residues in milk.
In another study, Nagel et al. (Reference Nagel, Molina and Althaus2011) detected 100 μg OTC/l and 109 μg TC/l in milk when optimising a bioassay containing spores of B. cereus (Log S. 5·12) and CAP (470 μg/l), although they did not obtain the levels of sensitivity for CTC detection in milk achieved here with B. pumilus (117 μg/l compared with 250–300 μg/l for B. cereus). Even though the levels of detection of B. cereus are satisfactory, the use of this bacterium could be questioned because it can cause digestive disturbances (Abee et al. Reference Abee, Groot, Tempelaars, Zwietering, Moezelaar and van der Voort2011), conversely B. pumilus is a safe microorganism.
There are no previous studies using bioassay which contains B. pumilus for the detection of ATBs residues in milk. However, Pikkemaat et al. (Reference Pikkemaat, Ostra-van Dijk, Schouten, Rapallini and van Egmond2008) detected 1000 μg OTC/l, 700 μg TC/l and 400 μg CTC/l in renal pelvis fluid when using a method in Petri plates using B. pumilus spores fortified with 7 μg trimethoprim/l in culture medium after incubating for a period of 18 h at 37 °C, values that are higher than calculated in this work for diffusion bioassay in microtubes (40 °C – 5 h).
Microbiological inhibition bioassays commercially available using G. stearothermophilus var. calidolactis does not have adequate sensitivity to detect residues of TCs in milk. For example, Delvotest® detects 600 μg CTC/l and 500 μg OTC/l in milk while the BRT® AiM detects 750 μg OTC/l and 400 μg TC/l (Diserens et al. Reference Diserens, Beck Henzelin, Le Breton and Savoy Perroud2005). Therefore, these microbiological methods do not guarantee the absence of TCs residues at levels similar to MRLs (100 μg/l).
Bioassay specificity
The absolute frequency of non-compliance results was increased from 2 (specificity: 98·9%) to 4 (specificity: 97·9%) when bioassays were prepared with 0 μg CAP/l and 2500 μg CAP/l, respectively. The specificity calculated for the bioassay with 2500 μg CAP/l was similar to 98% reported by Sischo & Burns (Reference Sischo and Burns1993) and 95% indicated by Charm & Zomer (Reference Charm and Zomer1995) when evaluating the Delvotest® method with ATB-free milk samples.
Bioassay cross-specificity: detection limits for other ATBs
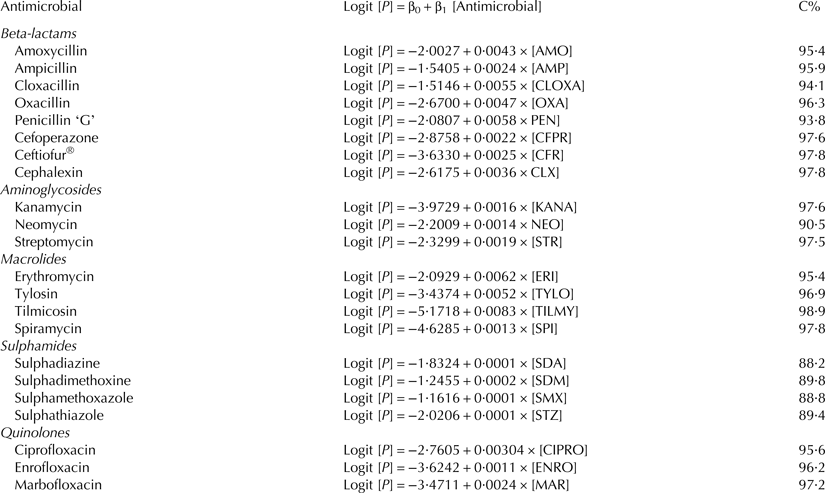
Logistic regression model equations for the detection of others ATBs groups in milk are shown in Table 5. It was observed that the concordance coefficients were high, ranging from 88·2% (sulphadiazine) to 98·9% (tylosine), indicating a good fit with the logistic model. The ‘β1’ coefficients values calculated using (Eq. 5) for Beta-lactams: (0·0022–0·0058), Aminoglycosides (0·0014–0·0019), Macrolides (0·0013–0·0083), Sulphamides (0·0001–0·0002) and Quinolones (0·0011–0·0030) were lower than determined for TCs (β1, OTC = 0·0115; β1, TC = 0·0090 and β1, CTC = 0·0070) pointing out lower sensitivity for detection of other ATBs. Figure 3 shows the DL relative to the corresponding MRLs for all ATB tested. The polygonal figure uses a standardised logarithmic scale (DL/MRLs) proposed by Suhren et al. (Reference Suhren, Reichmuth and Walte1996) for these sensitivity studies. The outside polygon (1) represents concentrations equivalent to 0·1 times the respective MRLs, the (2) polygon corresponds to levels equivalent to MRL, while (3) polygon corresponds to milk samples that contain 10 times MRLs and inside polygon (4) concentrations equal to 100 times MRLs. This figure visualised that this bioassay properly detected TCs and neomycin residues, but did not detect the other ATBs. For this reason, except neomycin (with DL similar to MRL), the rest of ATBs had high levels of detection, between 5 (tilmicosin) and 150 (sulphathiazole) times their respective MRLs. From this, it can be established that the B. pumilus bioassay has low inconveniences of cross-specificity (except neomycin). This screening method can be used to classify TCs in milk by Microbiological System in microtiter plates (SMMP) and replace the B. cereus bioassay proposed by Nagel et al. (Reference Nagel, Molina and Althaus2013), because B. cereus could present certain risks to the health of laboratory workers.
Detection pattern (DL/MRL) of the bioassay. Polygon 1 = 0·1 MRL, Polygon 2 = MRL, Polygon 3 = 10 MRL and Polygon 4 = 100 MRL.
Coefficients of the logistic regression model for the bioassay's dose-response curves
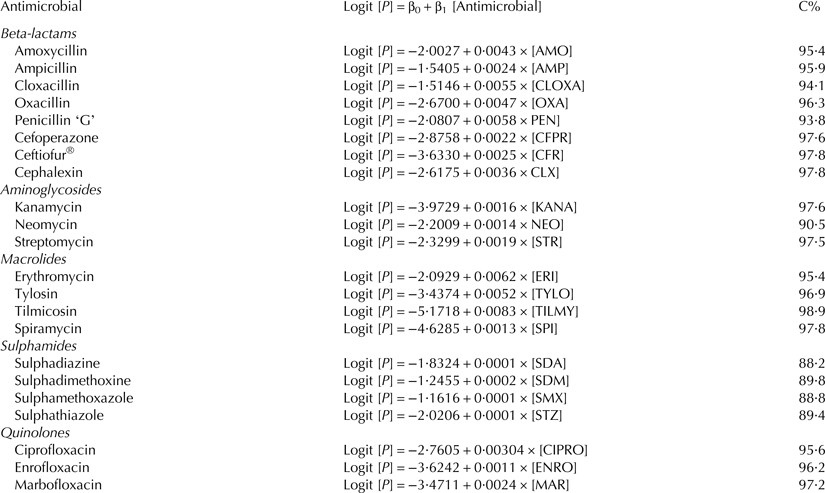
C%, concordance coefficient
Conclusions
A microbiological inhibition bioassay containing 1·6 × 109 spores/ml of B. pumilus fortified with 2500 μg CAP/l allows adequate levels of detection for TCs residues in milk with a response within 5 h. This microbiological method has good specificity (97·9%), with low cross-specificity problems (except neomycin), offering simple interpretation of results and easy implementation in quality control laboratories. In addition, this bioassay may be incorporated into the multi-residue microbiological microplate systems (SMMP) for previous classification of TCs in milk samples before its quantitation by high pressure liquid chromatography (HPLC).