How important is partisan identity to happiness? It might be of considerable importance to the two-thirds of Americans who identify with a political party, given its powerful influence on other dimensions of people's lives. Partisan identity is stable across people's lifetimes (Campbell et al. Reference Campbell, Converse, Miller and Donald1960; Green et al. Reference Green, Palmquist and Schickler2002), causally shaping political preferences and the factual qualities people associate with policies (Cohen Reference Cohen2003). People more frequently live near (Gimpel and Schuknecht Reference Gimpel and Schuknecht2004; Glaeser and Ward Reference Glaeser and Ward2006) and interact with (Gentzkow and Shapiro Reference Gentzkow and Shapiro2011) those who share their partisan identity than with those who do not. Furthermore, partisan identity tends to define media consumption (Prior Reference Prior2007) and other economic behavior (Gerber and Huber Reference Gerber and Huber2009), and can bias social perceptions and favoritism (Caruso et al. Reference Caruso, Mead and Balcetis2009; Rand et al. Reference Rand, Pfeiffer, Dreber, Sheketoff, Wernerfelt and Benkler2009). In short, social, mental, economic, and physical life is shaped by partisan identity.
Given this importance, political outcomes such as the 2012 U.S. Presidential Election could profoundly impact the happiness of both partisan winners (Democrats) and partisan losers (Republicans). This research uses a novel dataset that tracks fluctuations in happiness and sadness to address two questions about the importance of partisan identity to well-being. First, are the shocks to happiness from winning and losing equivalent? Diverse research suggests they might not be. Bad events cause stronger reactions than comparable good ones (Baumeister et al. Reference Baumeister, Bratslavsky, Finkenauer and Vohs2001; Rozin and Royzman Reference Rozin and Royzman2001), similar to predictions from prospect theory's value function about the gain-loss asymmetry (Kahneman and Tversky Reference Kahneman and Tversky1979; McDermott Reference McDermott2004).
Second, how strong is the shock of partisan loss to happiness? We compare the well-being consequences of partisan loss to that of two national tragedies that dominated the national news media for weeks. On December 14, 2012, 20 children and 6 adults were fatally shot at Sandy Hook Elementary School in Newtown, Connecticut (“Newtown shootings”). On April 15, 2013, three people were killed and 283 injured after terrorists attacked the Boston Marathon (“marathon bombings”). While such tragedies are qualitatively different than elections, comparing their well-being consequences to that of partisan loss illustrates simply the relative importance of the partisan identity to well-being. Tragedies have both political repercussions (Gillis Reference Gillis1996) and elicit emotional, financial, and civic responses from people not directly affected by the trauma (Preston and De Waal Reference Preston and De Waal2002; Singer et al. Reference Singer, Seymour, O’Doherty, Kaube, Dolan and Frith2004). Consequently, one might sensibly expect the hedonic (happiness-based) impact of partisan loss to pale in comparison.
Using daily responses from CivicScience, Inc., an online polling and data intelligence company, we employ a quasi-experimental regression discontinuity (RD) design to estimate the happiness shock of specific events. The RD design overcomes many of the sampling bias problems in survey-based studies of happiness by focusing on nearly identical respondents immediately before and after an independent shock (Imbens and Lemieux Reference Imbens and Lemieux2008; Shadish et al. Reference Shadish, Cook and Campbell2002).
We find that the pain of losing an election is much larger than the joy of winning one, but that this happiness loss is short-lived. Election outcomes strongly affect the short-term happiness/sadness of partisan losers, with minimal impact on partisan winners. This result is consistent with studies finding that “bad emotions, bad parents, and bad feedback have more impact than good ones…bad information is processed more thoroughly than good…[and] the self is more motivated to avoid bad self-definitions than to pursue good ones” (Baumeister et al. Reference Baumeister, Bratslavsky, Finkenauer and Vohs2001). Despite the strength of the loss, happiness appears to recover within a week, consistent with research on people's tendency to adapt to bad events more quickly than expected (Gilbert et al. Reference Gilbert, Lieberman, Morewedge and Wilson2004). This temporariness suggests partisan loss impairs emotional well-being rather than broader life satisfaction (Kahneman and Deaton Reference Kahneman and Deaton2010).
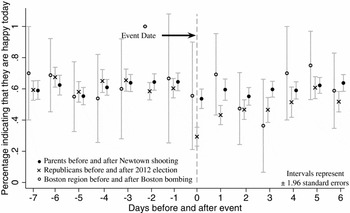
The short-term strength of partisan loss is contrasted with responses to mass national tragedies; partisans are affected twice as much by their candidate losing the U.S. Presidential Election than both respondents with children were to the Newtown shootings and respondents in Boston were to the marathon bombings. The fact that the pain experienced by partisan losers is stronger than that of people for whom the tragedies were self-relevant benchmarks the centrality of partisan identity to the self and well-being.
METHOD
Data
CivicScience polls over 300,000 unique individuals daily across the United States on over 500 third-party websites. Unpaid volunteers answer three questions in embedded polls. Tracking technology allows the company to identify returning respondents across all partner websites, thereby collecting a panel of detailed demographic and attitudinal data for many respondents. One question that is randomly and continuously distributed across all partner websites each day asks “How happy are you today – very happy, happy, so so, unhappy, or very unhappy?” This question is similar to one used in the Euro-Barometer Survey Series and the United States General Social Survey––widely used to study happiness in economics (Alesina et al. Reference Alesina, Di Tella and MacCulloch2004; Argyle Reference Argyle2003; Di Tella et al. Reference Di Tella, MacCulloch and Oswald2003; Easterlin Reference Easterlin2003, Reference Easterlin2006). Consistent with the prior literature, we create an indicator variable “happy” equal to 1 if respondents reported being happy or very happy.Footnote 1
CivicScience also collects extensive socio-demographic information (e.g., gender, income, race, age, and partisan identity) in a pre-determined sequence from return respondents over multiple visits to partner websites. We had access to data on all respondents who had answered the happiness and sadness questions, but not all of these respondents answered all socio-demographic, party affiliation, and parental status questions. For example, for the week before and after the election approximately 67% of respondents with happiness responses and full socio-demographic data had answered the partisan identity question; 85% of such respondents from the week before and after Newtown had answered the parental status question. Missing responses for each question yields a sparse data matrix, which makes imputing missing data very unreliable. We therefore, restrict the data for each analysis to the respondents for whom there are no missing observations.
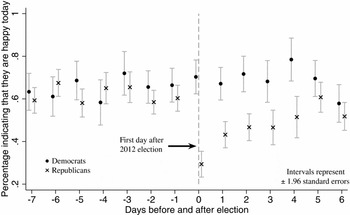
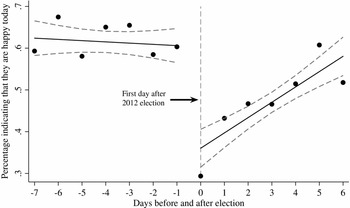
CivicScience asks “Politically, do you consider yourself more of a: Republican, Democrat, or Independent?” Like all surveys, the sample of these individuals is conditioned on the decision to participate in repeated CivicScience polls. CivicScience respondents were somewhat more Republican than the general population. We are unable to observe data on which respondents chose not to answer specific questions. Figure 1 previews our core results. During the two weeks surrounding Election Day, an average of 210 Republicans and 111 Democrats answered an online happiness question each day. Notice the little change in the likelihood that Democrats report being happy, while immediately following the election Republicans’ self-reported happiness drops from approximately 60% to 30%. These data are collected with enough frequency that daily shocks can be clearly identified, a feature unique to most research on happiness. We note, however, that our models’ key identifying assumption is that the sample is similar before and after the election. Additionally, given the self-selection and uneven geographic distribution of the sample, one must be careful in extrapolating specific effect magnitudes to the general population. Finally, we note how days are coded. Across all studies, we code days as being 24-hour periods immediately preceding and following focal events. For instance, the 2012 presidential election was called by the Associated Press at approximately 11 PM EST on Election Day, so the previous day began at 11 PM EST the day before Election Day.
Self-Reported Happiness one Week Before and After the Election

Model
We use quasi-experimental RD models to test how the happiness levels of Democrats and Republicans discretely change immediately following the presidential election. RD models assign observations to treatment and control groups based on a discrete threshold in a continuous assignment variable, which in our case is time (days). The discrete threshold is the focal event (e.g., Election Day or day of the tragedy). Any response after the focal event threshold is considered “treated,” while prior days are in the “control.” RD models are most commonly used in political science, economics, and psychology (Dal Bó et al. Reference Dal Bó, Dal Bó and Snyder2009; Gerber et al. Reference Gerber, Kessler and Meredith2011; Hersh Reference Hersh2014; Pierce et al. Reference Pierce, Dahl and Nielsen2013; Snyder Reference Snyder2010), with many examples applying RD models to time series data, as we do (Busse et al. Reference Busse, Silva-Risso and Zettelmeyer2006; Pierce and Snyder Reference Pierce and Snyder2012).
RD models assume that observations just above and below the threshold are identical on all dimensions except the focal treatment. Table S1–S3 provides detailed evidence that respondents one week before and after the three events in our data are reasonably identical on observable dimensions. Simple t-tests of differences in pre/post means reveal few systematic demographic differences, nor do RD models that replace Happiness with each demographic as the dependent variable in Equation (1) below. Our base specification is as follows at the individual-level respondent:
 $$\begin{equation}
$$\begin{array}{ll}
{\it Happiness}_i &=\, \propto + \beta _1 *{\it PostEvent}_i + \beta _2 *{\it Linear}\;{\it Time}\;{\it Variable}_i\\
&\quad + \,\beta _3 *{\it PostEvent}_i *{\it Linear}\;{\it Time}\;{\it Variable}_i + \varepsilon _i\\
\end{array}
$$\end{equation}
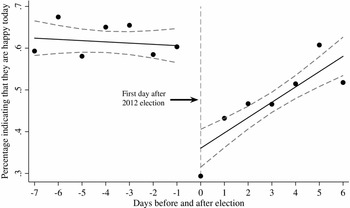
Linear Time Variable runs from −7 to 6, where 0 is the day immediately following the focal event. PostEvent is an indicator equal to 1 if the event has already occurred. Figure 2 illustrates this specification for Republican respondents’ happiness in relation to the election. β1 estimates the discrete jump between the two regression estimates. β2 is the slope prior to the election and β3 is the slope after the election. This specification therefore estimates the size of the break while controlling for the different time trends before and after the event. Other specifications include socio-demographic characteristics and higher order time polynomials for robustness. All results are clustered at the MSA level.
Self-Reported Happiness one Week Before and After the Election for Republicans with Discontinuity Model
To test the persistence of the happiness effect, a second model relaxes the RD assumption to examine weekly happiness rates for Republicans and Democrats, conditioning on socio-demographic information and location. Although this model provides some evidence of effect persistence, we cannot observe the counterfactual time trend in weeks distant from Election Day. Any inference about effect length must assume that happiness would return to pre-election levels absent the election's effect.
 $$\begin{equation}
{\it Happiness}_i =\, \propto + \beta _1 *{\it Week}\;{\it Indicators}_i + \beta _2 *{\it Socio\;Demographic\;Controls} + \varepsilon _i\end{equation}$$
STUDY 1: 2012 U.S. PRESIDENTIAL ELECTION
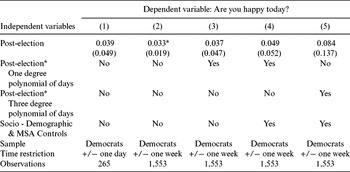
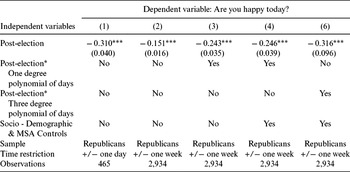
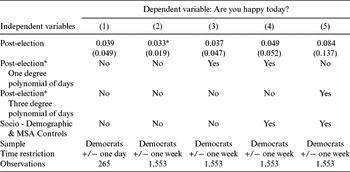
Tables 1(a) and (b) report the results for happiness around the election depicted in Figures 1 and 2, splitting the sample by partisan winners (Democrats) and partisan losers (Republicans). Across specifications there is little robust evidence that Democrats’ responses changed immediately after the election. The sign across specifications is positive, but the statistical significance is inconsistent across specifications. In contrast, partisan losers experienced significantly larger hedonic shocks than partisan winners. Table 1(b) shows a strong negative effect on the baseline level of happiness following the election. The models are robust to including extensive demographic (race, gender, age, income), geographic (metropolitan area fixed effects defined by IP address), and time control variables. This robustness across specifications casts doubt on concerns that results are driven by differences in the types of respondents before and after the election, as do the nearly identical respondent characteristics before and after the election presented in Table S1. The negative happiness impact to partisan losers, for example, actually increases from −0.151 to −0.246 after all controls are added. Across each pair of columns from Tables 1(a) and (b), the coefficients are statistically different from each other at the 5% confidence level.
Democrat Happiness One Week Surrounding 2012 Election
Republican Happiness One Week Surrounding 2012 Election
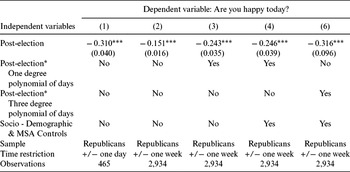
Note: Samples in Table 1(a) include only Democrats, while those in Table 1(b) include only Republicans.
*, **, and *** indicate significance at the 10%, 5%, and 1% confidence levels, respectively. Standard errors are clustered at the Metropolitan level. Socio-demographic controls include gender, age indicators, race indicators, and income indicators. MSA controls included indicators for the metropolitan statistical area.
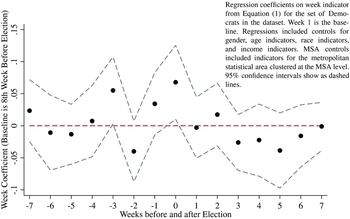
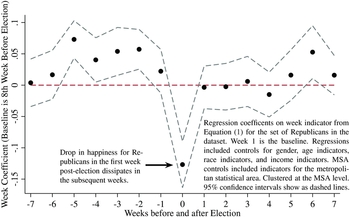
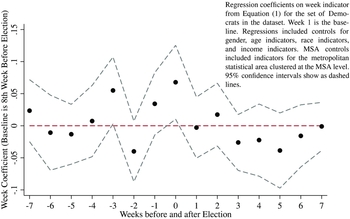
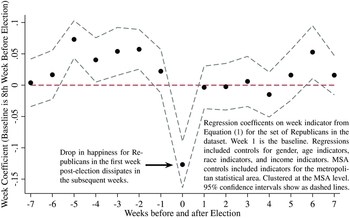
Figures 3(a) and (b) depict parameter estimates and confidence intervals associated with Equation (2). The weekly differences in happiness are all relative to the baseline 8th week before the election and condition on the socio-demographic characteristics described earlier. Over the 8 weeks before and after the election happiness is relatively constant except for Republicans in the week immediately following the election. This evidence again shows that Republicans’ well-being drops after the event, and also suggests that it recovers quickly.
Self-Reported Happiness for Democrats Eight Weeks Before and After the Election
Self-Reported Happiness for Republicans Eight Weeks Before and After the Election
Alternative Explanations
Three possible alternative explanations stand out. First, the asymmetric hedonic response could stem from rational responses to the election's policy implications for Democrats and Republicans (Gerber and Huber Reference Gerber and Huber2009). This seems unlikely, however, since Figures 1 and 2 show happiness levels converging within one week following the election, becoming statistically indistinguishable within four weeks.
Second, the asymmetric hedonic response could reflect different outcome expectations. Overconfidence among partisan losers is common even in blowout elections (Granberg and Brent Reference Granberg and Brent1983), partly because simply supporting a candidate causes people to believe that candidate will win (Krizan et al. Reference Krizan, Miller and Johar2010). In this alternative explanation, Republicans would be more affected because they expected a victory and were disappointed, while Democrats, also expecting a victory, were unsurprised. Supplementary analysis suggests a similar asymmetric shock for only those respondents expecting their candidate to win, casting doubt on this expectations explanation.
Finally Republicans may simply become less happy after an election, regardless of the outcome. This alternative seems unlikely, but we cannot directly test this hypothesis with these data.
STUDY 2: NEWTOWN SHOOTINGS AND MARATHON BOMBINGS
Two major national tragedies that dominated the media for weeks occurred after the election: the Newtown shootings and the Boston Marathon bombings. Many respondents answered the happiness/sadness questions in the weeks surrounding the two tragedies, averaging 445/day for the Newtown shootings and 639/day for the marathon bombings. These data are analyzed using the same strategy as with the election data, defining the post-event treatment dummy by whether each response was before or after the precise time of the event's first news coverage. Of course, learning that one's party lost an election differs in important ways from observing a national tragedy. For example, partisans are personally invested in and occasionally involved in elections, while very few people are personally involved in national tragedies. That said, of the 60% of Americans who identify with a political party, only about 0.40% were personally involved in the 2012 election by donating over $200 to a candidate, party, or PAC (Opensecrets.org). Nonetheless, comparing the hedonic impact of these two national tragedies to that of losing an election can be insightful because they were the most affectively intense events impacting the mass public during this period. This comparison serves simply to benchmark the hedonic intensity of partisan loss, and cannot account for other psychological impacts such as anxiety or fear.
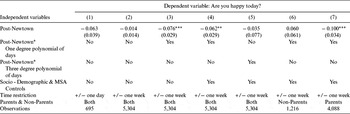
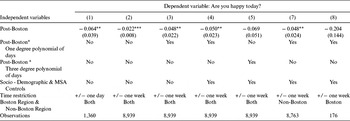
Both the Newtown shootings and marathon bombings caused significant negative hedonic shocks, but they are much smaller than those suffered by partisan losers in the election. Table 2 presents the RD estimates for respondent happiness in relation to the Newtown shootings. Across columns (1)–(5) the results are not consistently statistically significant. The fully-controlled model in column 2 estimates a 7.6% happiness decrease immediately following the Newtown shootings––only one-fifth the size of the decrease experienced by partisan losers. Likewise Table 3, column 4, shows that happiness decreases following the marathon bombings by only 4.8%. The statistical significance varies across multiple reasonable specifications.
Self-Reported Happiness Before and After Newtown Shooting
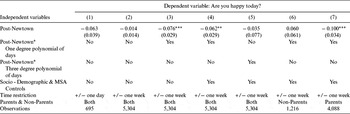
Note: *, **, and *** indicate significance at the 10%, 5%, and 1% confidence levels, respectively. Standard errors are clustered at the Metropolitan level. Socio-demographic controls include gender, age indicators, race indicators, and income indicators. MSA controls included indicators for the metropolitan statistical area.
Self-Reported Happiness Before and After Boston Bombing
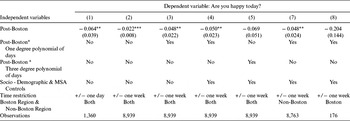
Note: *, **, and *** indicate significance at the 10%, 5%, and 1% confidence levels, respectively. Standard errors are clustered at the Metropolitan level. Socio-demographic controls include gender, age indicators, race indicators, and income indicators. MSA controls included indicators for the metropolitan statistical area.
Election outcomes are relevant to partisans’ identities. As such, it may not mean much to compare the hedonic impact of partisan loss to that of national tragedies to a broad swath of respondents. We therefore assess the hedonic impact of tragedies on those for whom the tragedies are identity-relevant: the Newtown shootings on self-reported parents and the marathon bombings on respondents using Boston-based IP addresses. The RD models are reported in columns (7) and (8) of Tables 2 and 3. As one would predict, these subsamples show larger impacts than the more general sample. However, the effects are still only half those on partisan losers from the election (ps < 0.01). The differences between the coefficient on Post-Newtown in columns (7) and (8) of Table 2 is significant at the 5% confidence level, while the difference between the Boston and Non-Boston region is not statistically significant.
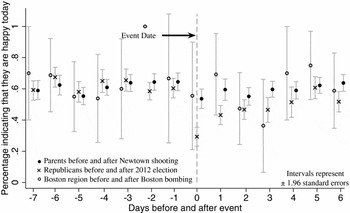
Figure 4 presents the daily happiness and sadness results for all three events (Presidential election, Newtown shootings, and marathon bombings) for the identity-relevant groups (Republicans, parents, and Boston residents). The visual comparison, combined with the regression results, strongly suggests that Republicans’ hedonic response to the election was larger than either response to the two tragedies.
Comparison of Salient Groups Before and After Event
GENERAL DISCUSSION
People's social, physical, economic, and mental lives are shaped by their partisan identities––and these social identities are widely and deeply held. The current research vividly shows that these identities also have important consequences to people's hedonic lives. Winning an election is fine, but losing one is painful, at least in the short run. Losing an election appears to dominate the pain caused by national tragedies, even among those particularly connected to them. While enhancing our understanding of the centrality of people's partisanship to their lived experiences, these results also speak to the growing literature in economics, psychology, and other fields on the factors that affect well-being (Kahneman et al. Reference Kahneman, Diener and Schwarz2003).
In addition to expanding our understanding of the well-being importance of partisan identity, this work makes several methodological contributions. First, it tackles a causal political psychology question by employing a research design (RD) that is under-used in other political psychology research (Shadish et al. Reference Shadish, Cook and Campbell2002). Second, it leverages digital technologies that allow large-scale, yet granular, data collection over time. One will notice in Figure 4 the rapid adaption of partisan losers to losing an election; of parents to the Newtown shootings; and of Boston residents to the marathon bombings. As far as we know, this is the first paper to map the contours of hedonic adaptation to societal events at this level of granularity. This type of data source provides new opportunities for scholars involved in the study and measurement of happiness (Kahneman and Krueger Reference Kahneman and Krueger2006). Finally, by using hedonic reactions to multiple unrelated events that are each associated with distinct identities, we illustrate an approach to comparing the importance of different beliefs, ideologies, or events to people's identities with relatively high ecological validity (Settles Reference Settles2004).
One of our main findings is that the pain of losing the 2012 Presidential Election dominated the joy of winning it. A challenge to making a general claim is the many idiosyncrasies to this specific election. First, the impact of losing the election may be specific to Republicans since partisans appear to have systematic differences in how they process and respond to information (Jost et al. Reference Jost, Federico and Napier2009). Second, it is difficult for us to disentangle the role of party affiliation from simple candidate preferences. Third, since President Obama was the incumbent, partisan winners might have perceived retaining the presidency as maintaining the status quo, thereby muting the joy of winning. In this scenario, however, partisan losers would have viewed the status quo as not attaining the presidency (i.e., losing), making this status quo argument inconsistent with the results. It is also inconsistent with the robust finding that partisans expect their preferred candidates to win, even when the polls show that winning is unlikely (Granberg and Brent Reference Granberg and Brent1983). The current findings should be replicated in future elections to resolve these questions.
Furthermore, the results appear inconsistent with research suggesting that prospect theory's gain-loss asymmetry arises when people forecast their hedonic reactions, but not when people actually experience gains and losses with monetary gambles (Kermer et al. Reference Kermer, Driver-Linn, Wilson and Gilbert2006). One possible explanation for this inconsistency might be that partisans expect to win elections (Granberg and Brent Reference Granberg and Brent1983; Krizan et al. Reference Krizan, Miller and Johar2010), whereas overconfidence may be more muted for monetary gambles.
Finally, we note that although partisan losers appear to be only temporarily affected, such transitive emotional shocks have important personal and social implications. Card and Dahl (Reference Card and Dahl2011), for example, find that upset losses in football games increased local domestic violence reports for a short period following the game.
In sum, partisan identity is even more central to the self than past research suggests. In addition to affecting thinking, preferences, and behavior, it also has sizable hedonic consequences, especially when people experience partisan losses.
SUPPLEMENTARY MATERIALS
To view supplementary material for this article, please visit http://dx.doi.org/10.1017/XPS.2015.8.