Implications
The effects of diet and breed on steer performance and methane (CH4) emissions were measured. Methane emissions on a high concentrate (920 g/kg dry matter (DM)) diet were less (0.68) when compared with a mixed forage/concentrate (500 g/kg DM) diet. Although energy lost as CH4 was reduced on the high concentrate diet, animal performance and carcass quality did not differ between diets. The CH4 to CO2 ratio in expired air did not relate well to daily CH4 production and may therefore have limited use as a proxy for daily CH4 production.
Introduction
Ruminant livestock systems are under continued political pressure to reduce their greenhouse gas (GHG) outputs. Worldwide, beef production systems generate 2.9 Mt of CO2-equivalent emissions per year and CH4 emissions accounted for 44% of total GHG emissions (Gerber et al., Reference Gerber, Steinfeld, Henderson, Mottet, Opio, Dijkman, Falcucci and Tempio2013b). The global human population is expected to exceed 9 billion by 2050, with meat consumption projected to increase by >75% compared with 2005 (Alexandratos and Bruinsma, Reference Alexandratos and Bruinsma2012). Achieving this level of production, whilst reducing the environmental impact of ruminant livestock production, represents a considerable challenge.
Ruminants play a crucial role in food security, being able to convert forages and non-human edible food into products for human consumption through enteric fermentation of cellulosic carbohydrates. However, enteric fermentation is the main source of ruminant emissions, as CH4 is one end product of the microbial digestion process. Methane formation in the rumen depends both on a supply of hydrogen (H2) from fermentation of feed by bacteria and protozoa and the subsequent conversion of H2 and carbon dioxide (CO2) to CH4 by methanogenic archaea. Enteric CH4 emissions also represent a loss of gross energy (GE) to the animal (estimated at 6% to 10%), which could be used by the animal for production (e.g. deposition of lean meat) (Cottle et al., Reference Cottle, Nolan and Wiedemann2011; Gerber et al., Reference Gerber, Hristov, Henderson, Makkar, Oh, Lee, Meinen, Montes, Ott, Firkins, Rotz, Dell, Adesogan, Yang, Tricarico, Kebreab, Waghorn, Dijkstra and Oosting2013a and Reference Gerber, Steinfeld, Henderson, Mottet, Opio, Dijkman, Falcucci and Tempio2013b). Understanding the mechanisms of methanogenesis and the microorganisms involved is important for devising sustainable mitigation strategies to lower the environmental impact of ruminant livestock production.
Recently, Rooke et al. (Reference Rooke, Wallace, Duthie, McKain, de Souza, Hyslop, Ross, Waterhouse and Roehe2014) reported that CH4 emissions were less (0.62 of mixed diet) when a diet containing 900 g concentrates/kg DM (concentrate diet) was fed compared with a diet containing 500 g concentrates/kg DM (mixed diet); further, rumen microbial communities were influenced by the genotype and CH4 emissions by the sire of cattle (Roehe et al., Reference Roehe, Dewhurst, Duthie, Rooke, McKain, Ross, Hyslop, Waterhouse, Freeman, Watson and Wallace2016). In the same study, Wallace et al. (Reference Wallace, Rooke, Duthie, Hyslop, Ross, McKain, de Souza, Snelling, Waterhouse and Roehe2014) demonstrated a positive relationship between the relative abundance of archaea in rumen samples taken at slaughter and the quantities of CH4 produced by individual animals. Furthermore, Wallace et al. (Reference Wallace, Rooke, McKain, Duthie, Hyslop, Ross, Waterhouse, Watson and Roehe2015) has previously demonstrated the influence of microbial communities on CH4 emissions, and Roehe et al. (Reference Roehe, Dewhurst, Duthie, Rooke, McKain, Ross, Hyslop, Waterhouse, Freeman, Watson and Wallace2016) the impact of the host genetics on CH4 emissions. Although accurate measurements of CH4 emissions using respiration chambers are required to develop and test the effectiveness of CH4 mitigation strategies, for genetic selection of cattle producing lower CH4 emissions, methods capable of screening large numbers of animals are required such as sampling animals at slaughter (Wallace et al., Reference Wallace, Rooke, Duthie, Hyslop, Ross, McKain, de Souza, Snelling, Waterhouse and Roehe2014). In the present study, the same nutritional strategy of Rooke et al. (Reference Rooke, Wallace, Duthie, McKain, de Souza, Hyslop, Ross, Waterhouse and Roehe2014) was used. The hypotheses addressed were that CH4 emissions expressed on a live-weight gain or carcass yield basis would be lower on a high concentrate diet and that differences between breeds in CH4 emissions would be greater when genetically more diverse breeds of cattle (Charolais and Luing) were tested.
Material and methods
This study was conducted at the Beef and Sheep Research Centre, Scotland’s Rural College (SRUC), UK. The experiment was approved by the Animal Experiment Committee of SRUC and was conducted in accordance with the requirements of the UK Animals (Scientific Procedures) Act 1986.
Experimental design, animals and diets
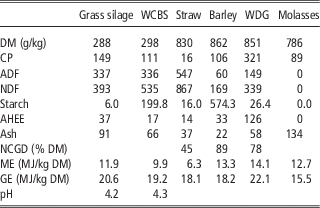
The experiment was of a 2×2 factorial design, comprising two breeds (crossbred Charolais (CHX); purebred Luing (LU)) and two diets (concentrate-based or silage-based). The breed types were selected to represent two commercially relevant breeds where CHX cattle represent a beef breed known for fast growth and excellent carcass conformation, whereas the LU breed is a more extensively managed hardy hill and upland breed. Two diets (as total mixed rations) were generated using a diet mixing wagon and consisted of (g/kg DM) forage to concentrate ratios of either 500 : 500 (Mixed) or 79 : 921 (Concentrate). The ingredient and chemical composition of the experimental diets are given in Table 1 and the chemical composition of individual components in Table 2. The DM contents of individual components were determined on duplicate samples twice weekly. Bulked feed samples (four per component) were analysed for DM, ash, CP, ADF, NDF, acid hydrolysed ether extract (AHEE), starch and neutral cellulase and gammanase digestibility (NCGD) (Ministry of Agriculture Fisheries and Food, 1992) and GE by adiabatic bomb calorimetry. Metabolisable energy (ME) values (Thomas, 2004), were either estimated from NIRS (silage and whole crop barley silage), from NCGD and AHEE (barley and wheat distillers dark grains) or from tabulated values for feed composition (straw and molasses).
Ingredient composition and calculated chemical composition of experimental diets

AHEE=acid hydrolysed ether extract; ME=metabolisable energy; GE=gross energy; DM=dry matter.
1 Ingredient composition is the mean of the daily diets received by the animals across the experiment.
2 Contained (mg/kg): Fe, 6036; Mn, 2200; Zn, 2600; Iodine, 200; Co, 90; Cu, 2500; Se 30; (µg/kg): vitamin E, 2000; vitamin B12, 1000; vitamin A, 151 515; vitamin D, 2500.
3 Chemical composition is the mean of four analyses per diet, apart from DM which is the mean of 44 analyses.
Chemical composition of feeding stuffs (g/kg dry matter (DM))

WCBS=whole crop barley silage; WDG=wheat distillers dark grains; AHEE=acid hydrolysed ether extract; NCGD=neutral cellulase and gammanase digestibility; ME=metabolisable energy; GE=gross energy.
In total, 80 steers were used (n=40 per diet) and each diet was allocated to two pens (four pens in total; 20 steers/pen). Pens were balanced for sire within each breed, farm of origin and BW and were balanced across diets at the start of the experiment. Fresh water was provided ad libitum using a water trough, and diets were offered at ~1.05 times average daily intake to all steers using 32 electronic feeders (HOKO, Insentec, Marknesse, The Netherlands). All steers were bedded on wood fibre and sawdust to ensure that consumption of bedding did not contribute to nutrient intake. All steers were fed the Mixed diet before being adapted to diets. Steers allocated the Concentrate diet, were adapted to the full concentrate inclusion over 4 weeks. Forage to concentrate ratios were increased at weekly intervals such that ratios of 38 : 62, 25 : 75, 13 : 87 and 8 : 92 were offered during adaptation. During this period, steers were trained to use the electronic feed intake recording equipment.
Fifty-six–day performance test
After adaptation to the experimental diets, performance and feed efficiency were characterised for all steers over a 56-day test period (day 0 to day 56). Animals were maintained under controlled conditions, where group sizes within the pen remained constant. Individual DM intakes (DMI, kg/day) were recorded for each animal using the electronic feeding equipment and BW measured weekly before fresh feed was offered using a calibrated weighing scale. Ultrasonic fat depth was obtained at the 12th/13th rib at the start (FD0) and end (FD1) of the 56-day test using industry-standard equipment (Aloka 500: BCF Technology Ltd, Scotland, UK). Images were analysed using Matrox Inspector 8 software (Matrox Video and Imaging Technology Europe Ltd, Middlesex, UK).
Emissions measurement in respiration chambers
Directly after the 56-day performance test, 72 steers were allocated to six respiration chambers over a 12-week period using a randomised block design (six chambers times 4 weeks) which was repeated three times. Within each block, each treatment of the 2×2 factorial (breed×diet) experimental design was replicated once in each respiration chamber. Steers were allocated to blocks to minimise variation in BW (mean BW (kg) 617, SEM 6.6) on entry to the respiration chambers. The steers remained in the respiration chambers for 3 days, during which time they were fed once daily and had ad libitum access to feed. Data for DMI during the 3-day chamber measurement period were averaged per animal. One chamber malfunctioned during weeks 6 to 10, which resulted in the requirement for an additional week of chamber measurement; thus measurements were made from 73 steers.
Full details of the six indirect open-circuit respiration chambers (No Pollution Industrial Systems Ltd, Edinburgh, UK) and their operation are given in Rooke et al. (Reference Rooke, Wallace, Duthie, McKain, de Souza, Hyslop, Ross, Waterhouse and Roehe2014) and Troy et al. (Reference Troy, Duthie, Hyslop, Roehe, Ross, Wallace, Waterhouse and Rooke2015). In addition to CH4, CO2 concentrations were also measured by IR absorption spectroscopy (MGA3000, Analytical Development Co. Ltd, Hoddesdon, UK) after calibration with a gas mixture of known composition. Before the beginning of the experiment, gas recoveries were measured by releasing CO2 at a constant rate into each chamber. To accustom the steers to the chamber environment, 6 days before chamber measurements groups of steers were moved to the building in which chambers were located and loose-housed in single pens (4×3 m) of identical design to pens within the chambers. After 6 days, the steers were then moved to the chambers and remained there for 72 h, with CH4 and CO2 measurements recorded in the final 48 h used in further analysis. Steers were fed (at ~1.05 times average daily intake) once daily and weight of feed within the bins recorded at 10 s intervals using load cells. Front doors of chambers were briefly opened at about 0800 h daily to remove feed bins and again to replace bins with fresh feed at ~0900 h. The pens were cleaned daily between 0800 and 0900 h. The exact times when doors were opened were recorded.
Rumen sampling, volatile fatty acid and microbial analyses
Immediately after the steers (within 2 h) left the respiration chambers, samples of rumen fluid were obtained (one per animal) by inserting a tube (16×2700 mm Equivet Stomach Tube; Jørgen Kruuse A/S, Langeskov, Denmark) nasally and aspirating manually. Approximately 50 ml fluid was strained through two layers of muslin and samples prepared for volatile fatty acid (VFA) analysis and DNA extraction before storage at −20°C as previously described (Rooke et al., Reference Rooke, Wallace, Duthie, McKain, de Souza, Hyslop, Ross, Waterhouse and Roehe2014). Similarly, DNA extraction was carried out using a method based on repeated bead beating plus column filtration and quantitative PCR methodology to quantify relative abundance of microbial groups in rumen samples (Rooke et al., Reference Rooke, Wallace, Duthie, McKain, de Souza, Hyslop, Ross, Waterhouse and Roehe2014).
Pre-slaughter measurements and carcass quality
Other than for measurements of CH4 emissions within the respiration chamber facility, steers remained within the same pens from the end of the 56-day test to slaughter. All steers remained on the same diet throughout the experiment. On the day before slaughter, ultrasonic fat depth (FD2) at the 12th/13th rib was measured in all steers as described above. Steers were slaughtered in five batches of 6, 21, 18, 15 and 19 steers on days 71, 92, 113, 134 and 155, respectively. Steers were selected for slaughter based on BW and visual assessment of fatness. Steers had access to feed until they left the premises. The steers were transported (~1 h) to a commercial abattoir and slaughtered within 2 h of arrival. Cattle were stunned using a captive bolt, exsanguinated and subject to low voltage electrical stimulation. Following hide removal, carcasses were split in half down the mid-line and dressed to UK specification (see Meat and Livestock Commercial Services Limited beef authentication manual, www.mlcsl.co.uk, for full description). EUROP conformation and fat classifications (Fisher, Reference Fisher2007), based on the UK scale, were allocated to all carcasses through visual assessment using a trained assessor.
Video image analysis (VIA) was used to estimate EUROP classifications (conformation and fat), total lean (kg) and total fat (kg) content of the whole carcass. The VIA systems in use in the EU are automatic machines that perform carcass evaluation based on images of the half carcass. The VBS 2000 system used in this study (E+V technology GmbH, Oranienburg, Germany) has been approved by the Department for Environment, Food and Rural Affairs for use in the UK since 2010. The system operated at the end of the slaughter line after all necessary dressing and trimming had been completed. A pneumatically operated cradle presented the left half side of each carcass for imaging. The VIA camera took two images of the half carcass, a two-dimensional image and a pseudo three-dimensional image using structured light (Craigie et al., Reference Craigie, Navajas, Purchas, Maltin, Bunger, Hoskin, Ross, Morris and Roehe2012). The VBS 2000 required information on the category of the carcass (i.e. steer) and hot carcass weight (kg) and, by combining this information with data automatically captured by the VIA system (i.e. carcass dimensions, angles, areas, colour), predicted EUROP classification and total lean and fat content of the whole carcass.
Calculations and statistical analysis
Data from two steers during the 56-day test period and one steer at slaughter were unavailable as the animals were removed from the trial for health reasons unconnected to the diets imposed. Growth was modelled by linear regression of BW against test date, to obtain average daily gain (ADG), mid-test BW (mid-BW) and mid-test metabolic BW (mid-MBW, BW0.75). Mean DMI over the 56-day period was expressed as kg/day or as a proportion of mid-BW and mid-MBW. Feed conversion ratio (FCR) was calculated as average DMI per day (kg/day) divided by ADG. Residual feed intake (RFI) was calculated as deviation of actual DMI (kg/day) from DMI predicted based on linear regression of actual DMI on ADG, mid-MBW and FD1 (Basarab et al., Reference Basarab, Price, Aalhus, Okine, Snelling and Lyle2003). Cold carcass weight (CCW) was calculated as a percentage of slaughter BW (SBW) to determine killing out (KO) percentage. To allow for statistical comparison, the EUROP carcass classification values were expressed on the equivalent 15-point scale (Kempster et al., Reference Kempster, Cook and Grantley-Smith1986). Statistical analyses of performance and carcass data were conducted using the mixed procedure of SAS software with the fixed effects of breed and diet, and the random effect of pen (and slaughter batch for carcass traits). In addition, in the analysis of FD1 and FD2 the deviation from the breed mean of FD0 was included as a covariable. The interaction effects of breed×diet were included in the model when these effects proved significant (P<0.05).
The respiration chamber measurements from three steers were discarded as the DMI decreased substantially (>30%) whilst being housed in the respiration chamber, leaving data from a total of 70 individual steers. Rumen fluid samples were not obtained for two steers and therefore 68 individual animal observations were available. Data were analysed using SAS software using linear mixed models. The fixed effects were breed and diet, whereas the random effects were week and chamber. The effect of the breed×diet interaction was also included in the model when this proved significant (P<0.05).
Data are reported as means with their SEM unless indicated otherwise. Differences between means were tested using a least square means comparison test. Probability values were deemed significant where P<0.05 and indicated a tendency when probability values were between P=0.05 and 0.1. The numbers of steers in treatments are given in each table for clarity.
Results
Performance test
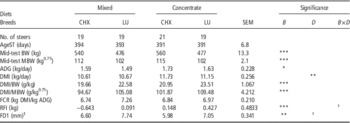
Although there were no differences in age at the start of the trial, CHX steers were significantly (P<0.001) heavier than LU steers (Table 3). However, there were no differences between breeds in daily DMI and therefore on a BW basis, LU steers consumed more DM (g/kg BW or g/kg0.75, P<0.001) than CHX steers. Compared with LU steers, CHX steers had greater ADG (P<0.05) throughout the performance trial and lower FD1 (P<0.01) at the end of the trial. Crossbred Charolais steers were more efficient than LU steers as measured by numerically lower FCR and significantly (P<0.001) lower RFI than LU steers.
Effect of breed (B), diet (D) on growth, feed intake and feed efficiency of Charolais-sired (CHX) and purebred Luing (LU) steers fed either a high concentrate (Concentrate) or mixed forage : concentrate (Mixed) diet during a 56-day performance trial

AgeST=Age at start of test; MBW=mid-test metabolic BW; ADG=average daily gain; DMI=dry matter intake; FCR=feed conversion ratio; RFI=residual feed intake; FD1=fat depth at the 12th/13th rib at the end of the 56-day test.
***P<0.001, **P<0.01, *P<0.05, † P<0.1.
1 Deviation from breed mean of FD0 (measured at start of 56-day performance test) fitted as covariable.
Although steers consumed more of the Concentrate than Mixed diet (P<0.01), there were no differences between diets in either ADG or feed efficiency (expressed as either FCR or RFI). Fat depth (FD1) tended to be lower (P=0.06) on the Concentrate than Mixed diet.
Carcass traits
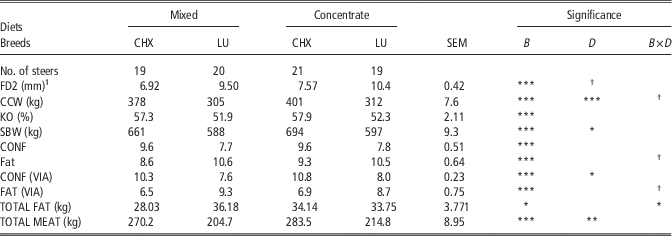
Crossbred Charolais steers were superior to LU steers for most carcass traits recorded (Table 4). Thus, CHX were heavier at slaughter with greater KO resulting in greater CCW (all P<0.001). Regardless of measurement method, CHX steers had superior conformation and fatness scores (P<0.001) which were reflected in greater carcass meat and lower carcass fat yields (predicted by VIA).
Effect of breed (B) and diet (D), and their interaction on carcass traits of Charolais-sired (CHX) and purebred Luing (LU) steers fed either mixed forage-concentrate (Mixed) or high concentrate-based (Concentrate) diets

FD2=pre-slaughter fat depth at the 12th/13th rib; CCW=cold carcass weight; KO=killing out %; SBW=slaughter BW; VIA=video image analysis; CONF=EUROP conformation (15 pt scale) assigned by visual assessor; FAT=EUROP fatness (15-point scale) assigned by visual assessor; CONF (VIA)=conformation grade (15 pt scale) assigned by VIA; FAT (VIA)=fatness grade (15 pt scale) assigned by VIA; TOTAL FAT=total fat content predicted by VIA; TOTAL MEAT=total meat content predicted by VIA.
***P<0.001, **P<0.01, *P<0.05, † P<0.1.
1 Deviation from breed mean of FD0 (measured at start of 56-day performance test) fitted as covariable.
Concentrate-fed steers were heavier at slaughter (P<0.05) and had greater CCW than Mixed-fed steers (P<0.001). Although there were no differences in carcass scores when visually assessed, the VIA system predicted superior conformation scores (P<0.05) and meat yields (P<0.01) for Concentrate-fed steers.
Methane and carbon dioxide production
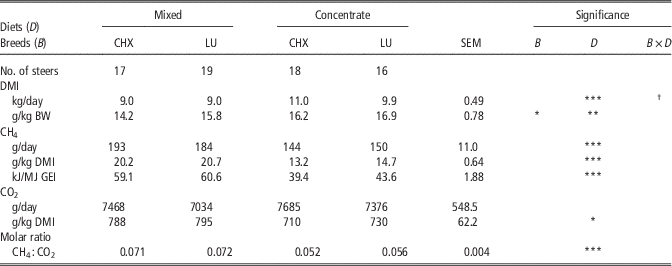
Breed of steer did not influence either CH4 or CO2 production. Methane production (Table 5), whether expressed as g/day, g/kg DMI or kJ/MJ GE intake, was substantially lower when the Concentrate rather than the Mixed diet was fed (P<0.001). There were no differences between diets in total daily CO2 production, but CO2 production expressed as g/kg DMI was greater when the Mixed diet was fed.
Dry matter intakes (DMI) and methane production from Charolais-sired (CHX) and purebred Luing (LU) steers fed either a high concentrate (Concentrate) or mixed forage : concentrate (Mixed) diets

GEI=gross energy intake; CH4=methane; CO2=carbon dioxide.
***P<0.001, **P<0.01, *P<0.05, † P<0.1.
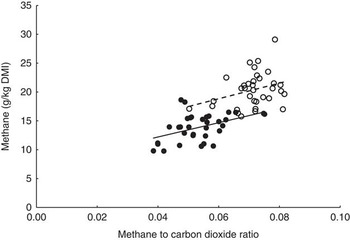
The ratio of CH4 to CO2 production (mole/mole) was greater on the Mixed than Concentrate diet (P<0.001). Although, there was a strong linear relationship between CH4 production (g/kg DMI) and CH4 to CO2 molar ratio (P<0.001) when all animals were considered, this was largely due to between-diet differences as within diets, the relationships were much weaker (Figure 1). However, and irrespective of whether data from all animals were considered together or within diets, essentially most of the variation in CH4 (g/kg DMI) was explained when both CH4 to CO2 ratio and CO2 production (g/kg DMI) were included in models.
Relationships between methane production (g/kg dry matter intake (DMI)) and methane to carbon dioxide molar ratio for steers fed Concentrate (solid line and solid circles; CH4=7.23+124 CH4/CO2 molar ratio, r 2 0.22, P=0.005) and Mixed (broken line and open circles, CH4=10.3+141 CH4/CO2 molar ratio, r 2 0.10, P=0.060) diets.

Overall: CH4 (g/kg DMI)=159 (16.3) CH4 to CO2 molar ratio+0.0099 (0.00135) CO2 (g/kg DMI); r 2 0.74, P<0.001.
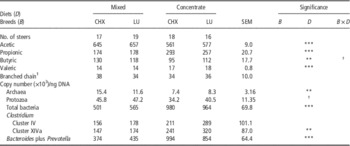
Rumen fluid VFA and microbial populations
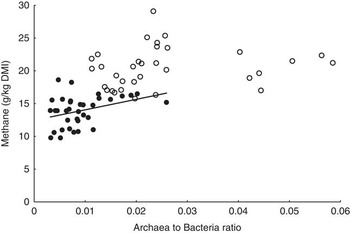
Rumen fluid from Concentrate-fed steers (Table 6) contained greater proportions of propionic and valeric (both P<0.001) acids, but lower proportions of acetic (P<0.001) and butyric (P<0.01) acids than Mixed-fed steers. There were no differences in VFA between breeds. Breed did not influence rumen microbial populations (Table 6). Rumen fluid from Concentrate-fed steers had a lower abundance of archaea (P<0.01) and protozoa (P=0.09) but more bacteria (P<0.001). There were no differences between diets in abundance of Clostridium Cluster IV in rumen fluid, but rumen fluid from Concentrate-fed steers contained more Clostridium Cluster XIVa and Bacteroides plus Prevotella than Mixed-fed steers. When the relationship between CH4 emissions (g/kg DMI) and archaea populations (expressed as ratio of archaea to total bacteria, Wallace et al., Reference Wallace, Rooke, Duthie, Hyslop, Ross, McKain, de Souza, Snelling, Waterhouse and Roehe2014) was explored the relationship was significant (P<0.001, Figure 2), but when the Mixed and Concentrate diets were considered individually the relationships were weaker and only significant (P<0.05) for the Concentrate diet.
Relationships between methane yield and archaea to bacteria ratio for samples from cattle fed Concentrate (solid line and solid circles CH4=12.5+160 Archaea to Bacteria ratio, r 2 0.10, P<0.05) and Mixed (open circles, P>0.05) diets. DMI=dry matter intake.

Volatile fatty acid molar proportions (mmol/mol) and microbial abundance in rumen fluid samples obtained from Charolais-sired (CHX) and purebred Luing (LU) steers fed either a high concentrate (Concentrate) or mixed forage : concentrate (Mixed) diets

1 Branched chain: iso-butyric plus isovaleric acids.
***P<0.001, **P<0.01, † P<0.1.
Discussion
Performance
Diets
There were few differences in performance traits between the Mixed (500 g concentrate DM/kg total DM) and Concentrate diets in the present study. Feed intake was significantly and ADG numerically greater for the Concentrate than Mixed diet but neither FCR nor RFI differed between diets. As there were also few differences in carcass composition, after differences in slaughter weight were accounted for, there was little evidence for any underlying differences between diets in the energy content of deposited tissue. These results are similar to the study of Duthie et al. (Reference Duthie, Rooke, Troy, Hyslop, Ross, Waterhouse and Roehe2016) who used the same breeds and similar diets and experimental protocols to the present study. Thus, FCR did not differ between diets and there was little evidence of differences in carcass composition particularly fat content in either study and therefore, there was no advantage to the Concentrate diet in animal performance either in BW, CCW or energetic terms. This lack of difference between diets is in contrast to the expectation from the literature. For example, Lovett et al. (Reference Lovett, Lovell, Stack, Callan, Finlay, Conolly and O’Mara2003) reported that heifers offered a concentrate diet (900 g concentrate/kg DM) consumed similar DMI but grew faster (1.1 v. 0.8 kg/day) and had superior FCR (8.5 v. 11.4 kg DMI/kg ADG) than heifers fed a 600 g concentrate/kg DM diet. The predicted efficiencies of utilisation of ME for growth (Agriculture and Food Research Council (AFRC) 1993; 0.50 and 0.54 for Mixed and Concentrate diets) would suggest that the Concentrate diet could support superior performance and the higher molar proportion of propionic acid on the Concentrate diet would have supplied more precursors for gluconeogenesis and lean tissue deposition. A likely explanation for the lack of difference between the two diets is that the numerically greater ADG for steers fed the Concentrate diet were the maximum ADG possible.
Breeds
The differences in performance between CHX and LU in the present study were similar to Duthie et al. (Reference Duthie, Rooke, Troy, Hyslop, Ross, Waterhouse and Roehe2016). That is, the CHX steers had greater daily ADG and superior FCR. The differences between breeds in slaughter characteristics were also similar between studies; CHX had greater carcass weights and superior EUROP conformation (visually assessed or predicted from VIA) and lower fat depth. In the present study, the quantitative differences between the breeds in performance were lower. In particular, in Duthie et al. (Reference Duthie, Rooke, Troy, Hyslop, Ross, Waterhouse and Roehe2016) LU steers had greater DMI than CHX, but there were no differences in the present study. The reason for this difference is likely that in Duthie et al. (Reference Duthie, Rooke, Troy, Hyslop, Ross, Waterhouse and Roehe2016), steers entered the performance study at the same BW but LU steers were ~30 days older and thus nearer maturity, especially as LU steers would reach maturity at a younger age than CHX. In this context, if LU are classified as a medium maturing cattle type compared with the CHX, a late maturing type, then from AFRC (1993) the energy value of gain would be 22.2 and 23.3 MJ/kg ADG for CHX and LU, respectively. Using these values, the net energy requirements for the observed ADG of 36.8 and 36.6 MJ net energy/day for CHX and LU, respectively, are little different. Thus in terms of energy efficiency there is little difference between the breeds.
Methane emissions
Diets
In an experiment of similar design to that reported here (Rooke et al., Reference Rooke, Wallace, Duthie, McKain, de Souza, Hyslop, Ross, Waterhouse and Roehe2014) but using different breeds of cattle, mean CH4 emissions (g/kg DMI) were similar (present experiment v. Rooke et al., Reference Rooke, Wallace, Duthie, McKain, de Souza, Hyslop, Ross, Waterhouse and Roehe2014; Concentrate, 13.9 v. 13.6; Mixed, 20.4 v. 21.8). This difference between diets was consistent with both the literature (Hristov et al., Reference Hristov, Oh, Lee, Meinen, Montes, Ott, Firkins, Rotz, Dell, Adesogan, Yang, Tricarico, Kebreab, Waghorn, Dijkstra and Oosting2013) and the observed changes in VFA proportions: increased molar proportions of propionate (hydrogen consuming) and decrease proportions of acetate (hydrogen producing) on the Concentrate diet. Based on many studies, equations to predict CH4 yield which include the proportion of concentrate in the diet have been developed. The equation of Sauvant and Giger-Reverdin (Reference Sauvant and Giger-Reverdin2009) predicted CH4 yields (expressed as kJ CH4/MJ total GE) of 48 and 79 kJ CH4/MJ GE intake for the Concentrate and Mixed diets, respectively, compared with observed means of 42 and 60. The more recent equation for non-lactating cattle developed by Hristov et al. (Reference Hristov, Oh, Lee, Meinen, Montes, Ott, Firkins, Rotz, Dell, Adesogan, Yang, Tricarico, Kebreab, Waghorn, Dijkstra and Oosting2013) produced values of 59 and 65 kJ CH4/MJ GE intake. Both equations thus over-predicted CH4 produced from the Concentrate diet. This may be because of under-representation or absence of high concentrate diets from the prediction data sets. Rooke et al. (Reference Rooke, Wallace, Duthie, McKain, de Souza, Hyslop, Ross, Waterhouse and Roehe2014) noted that the value of 39 kJ CH4/MJ GE for the Concentrate was higher than values observed for North American feedlot diets (20 to 30 kJ MJ CH4/MJ GE) based on maize grain and that this was due to the greater cell wall concentration in barley grain (Beauchemin and McGinn Reference Beauchemin and McGinn2005; Doreau et al., Reference Doreau, van der Werf, Micol, Dubroeucq, Agabriel, Rochette and Martin2011). For the Mixed diet, the value predicted by Hristov et al. (Reference Hristov, Oh, Lee, Meinen, Montes, Ott, Firkins, Rotz, Dell, Adesogan, Yang, Tricarico, Kebreab, Waghorn, Dijkstra and Oosting2013) was in closer agreement with the observed value than that from Sauvant and Giger-Reverdin (Reference Sauvant and Giger-Reverdin2009) likely because the Hristov et al. (Reference Hristov, Oh, Lee, Meinen, Montes, Ott, Firkins, Rotz, Dell, Adesogan, Yang, Tricarico, Kebreab, Waghorn, Dijkstra and Oosting2013) equation included terms for NDF and ether extract which more accurately described the nutrient composition of the diet.
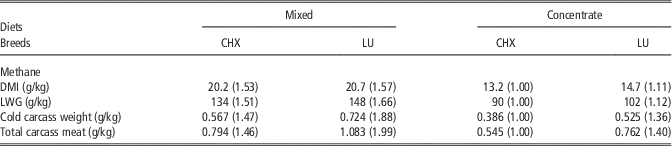
Breed had no overall effect on CH4 yield in the present experiment. This was in agreement with our own (Rooke et al., Reference Rooke, Wallace, Duthie, McKain, de Souza, Hyslop, Ross, Waterhouse and Roehe2014; Duthie et al., Reference Duthie, Rooke, Hyslop and Waterhouse2015; Troy et al., Reference Troy, Duthie, Hyslop, Roehe, Ross, Wallace, Waterhouse and Rooke2015) and other previous studies (Boadi and Wittenberg Reference Boadi and Wittenberg2002; Fraser et al., Reference Fraser, Fleming and Moorby2014; Richmond et al., Reference Richmond, Wylie, Laidlaw and Lively2015) using different breeds. However, Hristov et al. (Reference Hristov, Oh, Lee, Meinen, Montes, Ott, Firkins, Rotz, Dell, Adesogan, Yang, Tricarico, Kebreab, Waghorn, Dijkstra and Oosting2013) have argued that emissions intensity (CH4 produced per unit animal product) most accurately represented the potential of a mitigation strategy. As detailed animal performance records and CH4 emissions were measured in this experiment, it was appropriate to estimate emissions intensities for the diets fed. In so-doing, the limitations imposed by recording animal performance, CH4 emissions and carcass characteristics consecutively should be noted. As an example, feed intakes expressed as a proportion of BW were greater during the performance trial than the CH4 measurement period and therefore CH4 emissions (g/kg DMI) during the performance measurement would likely have been less than those measured later (e.g. Sauvant and Giger-Reverdin Reference Sauvant and Giger-Reverdin2009). Table 7 shows that whilst the difference between diets within breed remained relatively independent of the method of measurement, the effect of breed was substantial particularly when CH4 emissions were based on carcass and estimated meat weights with the LU cattle fed the Mixed diet producing nearly twice the amount of CH4 on a carcass meat basis than CHX cattle fed the Concentrate diet.
The effect of different metrics on methane emissions from Charolais-sired (CHX) and purebred Luing (LU) steers fed either a high concentrate (Concentrate) or mixed forage : concentrate (Mixed) diets

Values expressed as a proportion of those for CHX steers fed the Mixed diet are given in brackets.
Rumen microbiota
In Rooke et al. (Reference Rooke, Wallace, Duthie, McKain, de Souza, Hyslop, Ross, Waterhouse and Roehe2014), there was a significant relationship between archaea populations (ratio of archaea to total bacteria) and CH4 emissions (Wallace et al., Reference Wallace, Rooke, Duthie, Hyslop, Ross, McKain, de Souza, Snelling, Waterhouse and Roehe2014) and there were also differences in rumen microbiota between breeds (Rooke et al., Reference Rooke, Wallace, Duthie, McKain, de Souza, Hyslop, Ross, Waterhouse and Roehe2014). In the present study, there was a similar relationship between CH4 emissions and archaeal populations (Figure 2) to Wallace et al. (Reference Wallace, Rooke, Duthie, Hyslop, Ross, McKain, de Souza, Snelling, Waterhouse and Roehe2014) where the relationship was positive and significant for the Concentrate but not the Mixed diet, suggesting that the archaea populations and CH4 emissions were limited by available hydrogen on the Concentrate diet (Janssen, Reference Janssen2010). However, in contrast to Rooke et al. (Reference Rooke, Wallace, Duthie, McKain, de Souza, Hyslop, Ross, Waterhouse and Roehe2014) there were no differences in rumen microbiota or CH4 emissions between breeds of cattle. This was despite the fact that the breeds used in the present experiment (CHX and LU) were more genetically divergent than the genotypes used by Rooke et al. (Reference Rooke, Wallace, Duthie, McKain, de Souza, Hyslop, Ross, Waterhouse and Roehe2014; Limousin×Aberdeen Angus and Aberdeen Angus×Limousin). A possible explanation for this difference may be the source of the cattle used, whereas the steers used by Rooke et al. (Reference Rooke, Wallace, Duthie, McKain, de Souza, Hyslop, Ross, Waterhouse and Roehe2014) were raised on the farm in which the experiment was carried out, in the present experiment, steers were obtained from nine different farms. It is thus possible that the different farm environments the cattle used in the present experiment were derived from had a greater effect on rumen microbiota than differences between breeds.
Methane and carbon dioxide emissions
Quantifying CH4 emissions using respiration chambers is a costly and relatively low throughput procedure, and there is therefore considerable interest in establishing proxy procedures which are low cost, more rapid and more applicable to the normal farm environment. A possible option within dairy systems is the measurement of CH4 and CO2 concurrently from sampling points, for example, in the dairy parlour (Lassen et al., Reference Lassen, Lovendahl and Madsen2012; Bell et al., Reference Bell, Saunders, Wilcox, Homer, Goodman, Craigon and Garnsworthy2014). Both the above studies concluded that the CH4 to CO2 phenotype was repeatable. It was proposed by Madsen et al. (Reference Madsen, Bjerg, Hvelplund, Weisbjerg and Lund2010) that by calculating heat production by the animal and converting heat production to CO2 production, CH4 to CO2 ratios could be converted to daily CH4 emissions. However, Bell et al. (Reference Bell, Saunders, Wilcox, Homer, Goodman, Craigon and Garnsworthy2014) found only a poor relationship between average CO2 production estimated according to Madsen et al. (Reference Madsen, Bjerg, Hvelplund, Weisbjerg and Lund2010) and measured CO2 concentrations. Factors proposed to explain this lack of agreement by Bell et al. (Reference Bell, Saunders, Wilcox, Homer, Goodman, Craigon and Garnsworthy2014) were animal to animal variation including differences in diurnal pattern of CH4 to CO2 ratio, feed intake and fasting heat production itself. This is confirmed in the present study where measurements were made over a 48 h period thus excluding short-term changes in breath CH4 and CO2 concentration. Further, as all animals were gaining weight, CO2 derived from body tissue mobilisation would not have influenced the results. The diets fed influenced CO2 production and therefore CH4 to CO2 ratio with CO2 production (g/kg DMI) being greater for the Mixed diet as expected from differences in VFA pattern. More importantly and particularly within diets, the correlation between CH4 production (g/kg DMI) and CH4 to CO2 ratio was poor (Figure 1), but variation in CO2 production in conjunction with CH4 to CO2 ratio explained most of the variation in CH4 production. Thus, although the phenotype of CH4 to CO2 ratio may be repeatable, the present experiment suggests that it may not relate well to daily CH4 production because of animal to animal variation in extent of digestion, efficiency of utilisation of absorbed nutrients and tissue CO2 turnover.
Conclusions
This large scale, integrative study reported animal performance including carcass characteristics together with measurement of CH4 emissions and characterised rumen VFA and microbial abundance. In agreement with previous studies (Rooke et al., Reference Rooke, Wallace, Duthie, McKain, de Souza, Hyslop, Ross, Waterhouse and Roehe2014; Duthie et al., Reference Duthie, Rooke, Troy, Hyslop, Ross, Waterhouse and Roehe2016) CH4 emissions were less (0.68 of mixed diet) when a high concentrate diet was fed compared with a mixed forage : concentrate diet. However, although energy lost as CH4 was reduced by 18 kJ/MJ GE intake, there were no differences in animal performance or carcass characteristics between the diets fed. Although breed of steer had no effect on CH4 emissions, ADG was less and feed conversion efficiency was poorer for LU compared with CHX steers. Assessment of the CH4 to CO2 ratio as a proxy measurement for CH4 emissions made using respiration chambers, suggests that the ratio may not relate well to daily CH4 production because of animal to animal variation in digestion and utilisation of feed.
Acknowledgements
The authors are grateful to all support staff at SRUC’s Beef and Sheep Research Centre and to Nest McKain at the Rowett Institute of Nutrition and Health, for their technical assistance. SRUC receives funding from Scottish Government’s Rural and Environmental Science and Analytical Services Division. The research was funded by the Scottish Government and the UK Department for Environment, Food and Rural Affairs and the devolved administrations through the UK Agricultural Greenhouse Gas Inventory Research Platform (http://www.ghgplatform.org.uk).