NOMENCLATURE
- CFD
computational fluid dynamics
- HRIC
high-resolution interface capturing
- LJIC
liquid jet in crossflow
- K–H
Kelvin–Helmholtz
- SST
shear-stress transport
- TAPS
twin annular premixing swirler
- VOF
volume of fluid
Symbols
- c p
specific heat capacity, J/kg/K
- c s
volume concentration of component
 $s$
- $C$
constant
- d
diameter, m
- div
vector symbol
- D
diffusion coefficient
- E
energy, J
- F
force, N
- k
heat transfer coefficient, W/m/K
- Oh
Ohnesorge number
- P
pressure, Pa
-
$q$
jet-to-crossflow momentum flux ratio
-
${\rm{Re}}$
Reynolds number
-
$S$
source term
-
$t$
time, s
-
$T$
temperature, K
-
$u\;$
velocity vector, m/s
-
$v$
velocity, m/s
- W
mass flow rate, kg/s
-
$We\;$
Weber number
-
$x$
axial distance, m
-
$y$
radial distance, m
-
${{\rm{\alpha }}_q}$
the q-phase fluid volume fraction in the unit
-
$\mu $
dynamic viscosity, kg/m/s
-
${\mu _t}$
turbulent viscosity
-
$\sigma $
surface tension, N/m
-
$\rho $
density, kg/m3
-
$\tau $
viscous stress, Pa
-
$\omega $
specific dissipation rate


Subscripts
- $ch$
channel
-
$g$
gas
-
$j$
jet
-
$w$
water


1.0 INTRODUCTION
Liquid Jet in gaseous Crossflow (LJIC) technology provides good fuel atomisation characteristics and enables fuel and air mixing uniformly over a short distance, having good application prospects for use in low-emissions combustion systems. Although LJIC technology has various applications, the main concern here is its application in the combustor of an aero-engine. One famous case is the Twin Annular Premixing Swirler (TAPS) technology that was developed by General Electric company, which employs LJIC in the main stage fuel injection, showing a 50% margin of NOx emission relative to the CAEP 6 standard(Reference Stickles and Barrett1).
Whether the liquid jet is non-turbulent or turbulent affects the shape of the primary breakup. Wu et al.(Reference Wu, Miranda and Faeth2) proposed criteria for the occurrence of non-turbulent and turbulent liquid jets. At high  $\;{\rm{R}}{{\rm{e}}_j}$, when the length/diameter ratio of the nozzle is less than 4–6, the surface of the liquid jet is smooth without reattachment, which means a non-turbulent flow. In contrast, when the length-to-diameter ratio is relatively high, a fully developed turbulence flow with high
 $\;{\rm{R}}{{\rm{e}}_j}$ appears at the nozzle exit. Most nozzles in aero-engines produce non-turbulent jets. Therefore, non-turbulent jets are mainly discussed in this paper.
Many empirical diagrams have been proposed in the literature for predicting the primary breakup regimes of non-turbulent liquid jets injected into subsonic gaseous crossflows. The most commonly used of these diagrams was the  $W{e_g} - q$ diagram, which was first proposed by Wu et al.(Reference Wu, Kirkendall, Fuller and Nejad3). It classified the breakup features of liquid jets observed in the crossflow and is shown in Fig. 1. Wu et al. believed that, because the breakup of liquid jets and droplets in crossflow is caused by aerodynamics, the knowledge of the secondary breakup of droplets caused by aerodynamics may apply to the primary breakup of liquid jets. Using
 $q$ and
 $W{e_g}$, they divided the breakup characteristics of the liquid jet observed in crossflow into two main regimes (i.e. column breakup and surface breakup). They concluded that column breakup occurred at low
 $q$ and/or low
 $W{e_g}$, and surface breakup can be observed at high
 $q$ and/or high
 $W{e_g}$. The column breakup area is also divided into four sub-areas on the map based on
 $W{e_g}$. For
 $W{e_g} < 11$, the breakup phenomenon showed as the enhanced capillary breakup. At increased Weber numbers (
 $11 < W{e_g}<30$), transitions occur; both column breakup and bag breakup exist. In the case of
 $30 < W{e_g}<90$, the breakup process is multi-mode, and the final shear breakup process occurs when
 $W{e_g}>90$. The breakup regime map shows different jet breakup regimes, and visual observations based on the work of Wu et al. indicated the transition boundary between the column and the surface breakup. However, the transition is a gradual process, there is no clear threshold to distinguish the two systems and further research needs to be done to determine the mechanism of this transition.
Regime diagram of breakup of LJIC(Reference Wu, Kirkendall, Fuller and Nejad3).

The trajectory of the liquid jet is an important characteristic of LJIC because it directly affects the distribution of the fuel spray in the combustion zone, and therefore the evaporation of the fuel and its mixing rate with the air. To describe the trajectory of LJIC, researchers have proposed many empirical and phenomenological correlations based on non-dimensional parameters (such as  $q$,
 $R{e_j}$,
 $R{e_g}$,
 $W{e_g}$,
 $W{e_j}$, viscosity ratio and density ratio). However, because of the complex physics of the two-phase flow field of LJIC, the trajectory of the liquid jet depends on many variables, such as the liquid properties, airflow conditions, shape of the nozzle and measurement instruments, which resulted in considerable dispersion of these correlations. These dispersions are difficult to eliminate completely but can be minimised by classifying these correlations into different categories based on test conditions. Although most published studies have been performed under atmospheric conditions, some studies have been performed at elevated crossflow temperature and pressure. The trajectory of LJIC changes with the test conditions since the changes in the test conditions cause changes in liquid and gas properties. Table 1 presents a few published correlations regarding the LJIC trajectory at elevated conditions.
Correlations of trajectory of LJIC at elevated conditions

Although the correlations in Table 1 cover a wide range of  $q$,
 $W{e_g}$, crossflow temperature and pressure, there are still some operating conditions of aero-engine combustors beyond this scope. At the cruise condition of a typical civil turbofan engine, the LJIC in the combustor may have much lower
 $q$, less than 2, much higher
 $W{e_g}$, over 2,000, and also higher crossflow temperature. Whether these existing correlations can be used in extended range needs further investigation.
Because of safety considerations and limitations in the ability of test facilities, in experimental research, it is difficult to meet the high-temperature and high-pressure conditions in the real operating conditions of the engine. But with the development of high-performance computing technology, CFD has begun to enter the arena of LJIC research(Reference Ng, Sallam, Metwally and Aalburg10–Reference Herrmann, Arienti and Soteriou17). The effects of various parameters such as liquid viscosity, liquid/gas density ratio, momentum flux ratio and crossflow Weber number on liquid jets were investigated using numerical methods. The VOF method was the most commonly used technique to capture the precise free boundary surface. Results showed that the predicted liquid jet trajectory matched well with published experimental data sets. The numerical simulation has shown its potential to be a useful tool in studying LJIC.
This article aims to assess the ability of the commercial CFD software STAR-CCM+ to simulate LJIC and study the flow and breakup characteristics of LJIC under real engine operating conditions and predict the jet trajectory of LJIC simultaneously. Because of the lack of available test data at high-temperature and high-pressure conditions, the numerical method was validated and calibrated through comparing with the public test data at atmospheric conditions. Then, the verified numerical method was applied to simulate the breakup of LJIC at the real engine operating condition. A database of numerical models was created to be further evaluated, validated and calibrated from a planned experimental campaign. Finally, the existing correlations will be compared with the numerical results to assess their applicability at real engine operating conditions.
2.0 NUMERICAL METHODS
Numerical simulations were performed on STAR-CCM+ (version 14.04.013/R8) through the high-performance computation centre of Cranfield University.
2.1 Control equations
Control equations, including the mass conservation equation, momentum conservation equation, energy conservation equation and component mass conservation equation, are listed in (1)-(6):
 \begin{equation}\frac{\partial \rho }{\partial t}{\rm +}\frac{\partial \left(\rho u\right)}{\partial x}{\rm +}\frac{\partial \left(\rho v\right)}{\partial y}{\rm +}\frac{\partial \left(\rho w\right)}{\partial z}{\rm =0\ }\dots\end{equation}
 \begin{equation}\frac{\partial \left(\rho u\right)}{\partial t}{\rm +div}\left(\rho u{\mathbf u}\right){\rm =-}\frac{\partial p}{\partial x}{\rm +}\frac{\partial {\tau }_{xx}}{\partial x}{\rm +}\frac{\partial {\tau }_{yx}}{\partial y}{\rm +}\frac{\partial {\tau }_{zx}}{\partial z}{\rm +}F_x{\rm \ }\dots\end{equation}
 \begin{equation}\frac{\partial \left(\rho v\right)}{\partial t}{\rm +div}\left(\rho v{\mathbf u}\right){\rm =-}\frac{\partial p}{\partial y}{\rm +}\frac{\partial {\tau }_{xy}}{\partial x}{\rm +}\frac{\partial {\tau }_{yy}}{\partial y}{\rm +}\frac{\partial {\tau }_{zy}}{\partial z}{\rm +}F_y\dots\end{equation}
 \begin{equation}{\rm \ }\frac{\partial \left(\rho w\right)}{\partial t}{\rm +div}\left(\rho w{\mathbf u}\right){\rm =-}\frac{\partial p}{\partial z}{\rm +}\frac{\partial {\tau }_{xz}}{\partial x}{\rm +}\frac{\partial {\tau }_{yz}}{\partial y}{\rm +}\frac{\partial {\tau }_{zz}}{\partial z}{\rm +}F_z{\rm \ }\dots\end{equation}
 \begin{equation}\frac{\partial \left(\rho T\right)}{\partial t}{\rm +div}\left(\rho {\mathbf u}T\right){\rm =div}\left(\frac{k}{c_p}{\rm grad\ }T\right){\rm +}S_T\dots\end{equation}
 \begin{equation}\frac{\partial \left(\rho c_s\right)}{\partial t}{\rm +div}\left(\rho {\mathbf u}c_s\right){\rm =div}\left(D_s{\rm \ grad\ }\left(\rho c_s\right)\right){\rm +}S_s\dots\end{equation}
2.2 Turbulence model
The Shear-Stress Transport (SST)  $k - \omega $ model has seen fairly wide application in the aerospace industry. The transport equations for the kinetic energy
 $k$ and specific dissipation rate
 $\omega $ are
 \begin{equation}\frac{\partial \left(\rho k\right)}{\partial t}+\nabla \cdot \left(\rho k\overline{{\mathbf u}}\right)=\nabla \cdot \left[\left(\mu +{\sigma }_k{\mu }_t\right)\nabla k\right]+P_k-\rho {\beta }^*f_{{\beta }^*}\left(\omega k-{\omega }_0k_0\right)+S_k\dots\end{equation}
 \begin{equation}\frac{\partial \left(\rho \omega \right)}{\partial t}+\nabla \cdot \left(\rho \omega \overline{{\mathbf u}}\right)=\nabla \cdot \left[\left(\mu +{\sigma }_{\omega }{\mu }_t\right)\nabla \omega \right]+P_{\omega }-\rho \beta f_{\beta }\left({\omega }^2-{\omega }^2_0\right)+S_{\omega }\dots\end{equation}
where  $\bar{u}$ is the mean velocity,
 $\;\mu $ is the dynamic viscosity,
 ${\sigma _k}$ and
 ${\sigma _\omega }$ are model coefficients,
 ${P_k}$ and
 ${P_\omega }$ are production terms,
 ${f_{{\beta ^*}}}$ is the free-shear modification factor,
 ${f_\beta }$ is the vortex-stretching modification factor,
 ${S_k}$ and
 ${S_\omega }$ are the user-specified source terms and
 ${k_0}$ and
 ${\omega _0}$ are the ambient turbulence values that counteract turbulence decay.
2.3 Near-wall treatment
The near-wall area can be roughly divided into three layers. The innermost layer adjacent to the wall is the viscous sublayer; the outer layer is the log-law layer; between them, is the buffer layer. In STAR-CCM+, the continuous functions which are called blended wall functions (all y+ wall treatment) are used to cover all three sublayers. They represent the buffer layer by appropriately blending the viscous sublayer and the log layer.
2.4 VOF model
The VOF model is a tracking technique for two or more immiscible fluid interfaces on a fixed Eulerian grid. In the calculation equation of the VOF model, each phase fluid shares a system of equations, and the volume fraction of each phase is tracked throughout the computational domain. In each control volume, the sum of the volume fractions of all phases is one. As long as the volume fraction of each phase at each point in the calculation domain is known, the fields of all variables and physical properties are shared by the phases and represent the volume average. Thus, depending on the value of the volume fraction, the variables and physical properties within any unit are either representatives of one phase or representative of a multiphase mixture. By solving the continuity equation for one or more phase volume fractions, the interface between the phases can be tracked. The continuity equation for the q-phase volume fraction is
 \begin{equation} \frac{1}{{\rho }_q}\left[\frac{\partial }{\partial t}\left({\alpha }_q{\rho }_q\right)+\nabla \cdot \left({\alpha }_q{\rho }_q\overrightarrow{v_q}\right)=S_{{\alpha }_q}+\sum^n_{p=1}{\left({\dot{m}}_{pq}-{\dot{m}}_{qp}\right)}\right]\dots\end{equation}
where  ${\alpha _q}$ is the fluid volume fraction of the q-phase,
 ${\rho _q}$ is the physical density of the q-phase,
 $\overrightarrow {{v_q}} $ is the velocity of the q-phase,
 ${\dot m_{qp}}$ is the mass transfer from phase q to phase p,
 ${\dot m_{pq}}$ is the mass transfer from phase p to phase q, and
 ${S_{{\alpha _q}}}$ is the source term with a default value of zero and can also be specified as a constant or user-defined quality source term.
Phase interface tracking is the focus of two-phase flow simulation. An important quality of a system of immiscible phases (for example, air and water) is that the fluids always remain separated by a sharp interface. The High-Resolution Interface Capturing (HRIC) scheme is designed to mimic the convective transport of immiscible fluid components, resulting in a scheme that is suited for tracking sharp interfaces.
2.5 Gridding strategy and refinement
A trimmed grid was generated in the computational domain using the built-in meshing module of STAR-CCM+ software. Since a very fine mesh was required in the VOF model to accurately capture the free boundary surfaces of fluids between different phases, the mesh in the areas where the free boundary surfaces of fluids between different phases exist in the calculation domain was refined. The refinement process of the grid was artificially processed during the calculation process. Both the validation case and the simulation of LJIC at real engine operating condition employed the same gridding strategy and refinement method.
2.6 Model selection
The calculation used an implicit unsteady solver, and the time step was set to be 0.1 $\mu s$ (1 × 10⁻⁷s). The turbulence model adopted the SST k–ω double-equation eddy-viscosity model, and the near-wall area adopted all y+ wall treatment. The multiphase model adopted the VOF model to capture the accurate free boundary surface.
3.0 VALIDATION OF NUMERICAL METHOD
Before performing the simulation of LJIC at real engine conditions, the numerical method must be validated through experimental data. Because of the absence of experimental data under high-temperature and high-pressure conditions, the validating simulation was performed at atmospheric conditions. Parameters for comparison between simulation and experimental data included jet trajectory, and morphology and mechanism of the primary breakup. The experiment performed by Stenzler et al.(Reference Stenzler, Lee and Santavicca18) was chosen to validate the numerical simulation method.
3.1 Calculation domain
In the experiment, the crossflow pipe had a rectangle cross-section with dimensions of 25.8mm  $ \times $ 28.9mm
 $ \times $ 100mm (height
 $ \times $ width
 $ \times $ length). In the calculation, to save calculation time, the setting of the calculation domain was smaller than the real experimental pipeline, which was 25.8mm
 $ \times $ 2.54mm
 $ \times $ 25.4mm (height
 $ \times $ width
 $ \times $ length) and is shown in Fig. 2. The axial location of the nozzle was 5.08mm after the crossflow inlet, and the liquid used in the experiment was acetone.
Schematic of calculation domain.

3.2 Calculation grid
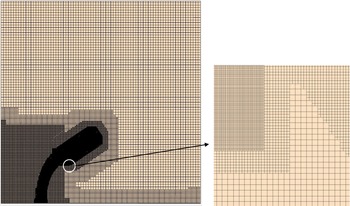
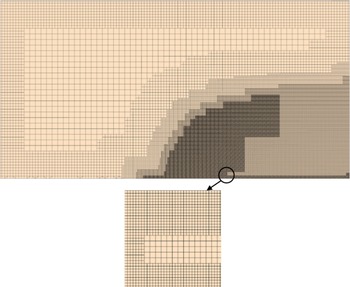
The refined mesh is shown in Fig. 3. After the final refinement, the finest grid size was 0.00635mm, and the size of the grid was approximately 22.1m.
3.3 Boundary conditions
Since the computing domain used a smaller width to save computing resources, the wall boundaries on both sides of the computing domain were set to periodic boundaries. The liquid was set to acetone in the simulation to be consistent with the test. The detailed boundary conditions for crossflow and liquid jet are presented in Table 2.
Boundary conditions of crossflow and liquid jet

Mesh at centre plane and zoomed view of mesh refinement.

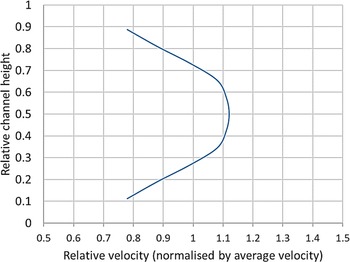
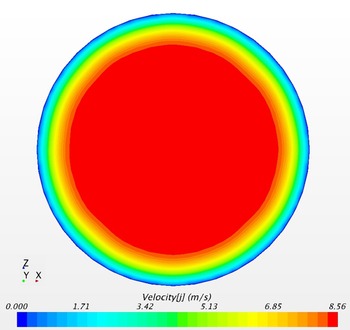
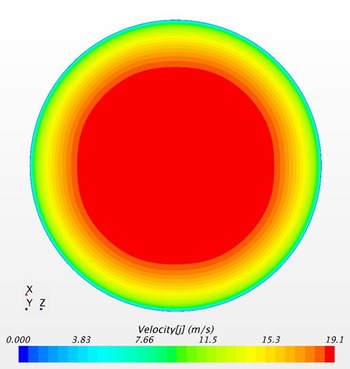
Since the crossflow velocity distribution in the wind tunnel had been measured in the reference, here the crossflow velocity distribution in the height direction at the air inlet boundary used the fitted experimental data, as shown in Fig. 4. Considering that the width of the calculation domain was small, the crossflow velocity distribution in the width direction was assumed to be uniform. At the same time, as the complete geometry of the nozzle was given, the nozzle was modelled and simulated before the simulation of LJIC, and the detailed velocity distribution at the nozzle exit was obtained and set as the liquid inlet boundary condition. The contour map of the velocity distribution at the nozzle exit is shown in Fig. 5. As can be seen from the figure, the velocity in the central area of the liquid jet was about 8.5m/s, which was higher than the average velocity of 7.1m/s that was calculated based on the volume flux and the nozzle area. Conversely, the liquid velocity near the nozzle wall area was lower than the average velocity.
Fitted velocity profile at injection plane.

Contour map of velocity distribution at nozzle exit.

3.4 Results and discussion
The unsteady calculation reached a relatively stable state after about 2.8ms, and then the time-averaged liquid jet trajectory was obtained after a further 1ms of calculation. The contour map of volume fraction of acetone in the centre plane of the calculation domain is shown in Fig. 6. It can be seen from this figure that the liquid jet was uniformly cylindrical at the exit of the nozzle. With its development in the height direction, under the action of crossflow aerodynamics, the jet was gradually deflected downstream.
Contour map of volume fraction of acetone in centre plane (t = 3.83ms).

It can be seen from Fig. 6 that the penetration height of the liquid jet was only about one-third of the height of the crossflow channel. Considering the vertical velocity distribution tested in the experiment, it can be inferred that the crossflow velocity corresponding to the root of the liquid column was lower than the average value of the crossflow velocity, and the crossflow velocity corresponding to the curved and breakup region at the top of the liquid column was greater than the average value of the crossflow velocity. The distribution of the crossflow velocity along the height direction causes the change in crossflow and liquid column velocity discrepancy, and the discrepancy in crossflow and liquid column velocity was the cause of K–H instability, which directly affected the breakup of the liquid column.
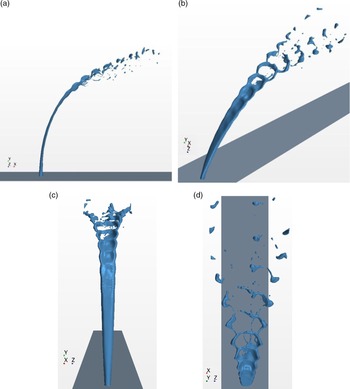
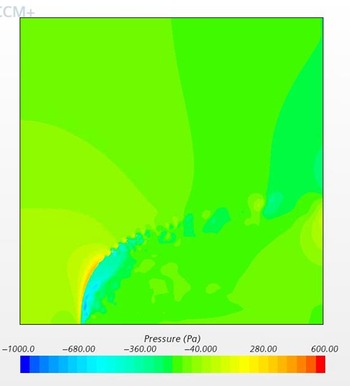
Figure 7 shows the boundaries of the liquid jet (the iso-surface with a volume fraction of liquid of 0.5) at different viewing angles. It can be seen from the figure that the round jet gradually became flat under the aerodynamic effect of crossflow, and the width of the liquid column on the windward side gradually increased in the Y direction. The K–H instability waves developed along the surface of the liquid column until the wavelength corresponded to the width of the liquid column. Because of the blockage of the liquid column, the crossflow decelerated and stagnated on the surface of the liquid column, causing the pressure on the windward surface of the liquid column to be greater than the pressure on the leeward side, as shown in Fig. 8. Under the effect of the air pressure difference, a bag-shaped liquid membrane was formed. As the distance along the liquid column increased, the bag expanded in the crossflow direction, and then gradually began to break up at the tip of the liquid column. The droplets formed by the membrane were very small because the membrane was very thin at the point of breakup. Subsequently, the ring-shaped region with a larger diameter at the edge of the bag broke at the wave node. The two semi-circular liquid columns formed after the disconnection deformed into large droplets under the surface tension, then spread out to each side. The droplets formed by the node itself were also large, and these big droplets flowed downstream along the trajectory of the jet centre.
Various views of boundaries of liquid jet (t = 3.83ms).

Contour map of gauge pressure in centre plane (t = 3.83ms).

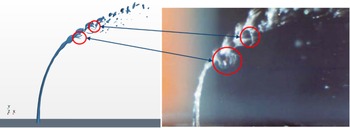
A comparison of the simulation result of the liquid jet trajectory and penetration with the experimental photo is illustrated in Fig. 9. Although the simulation accurately described the main characteristics of the bag breakup, including the fluctuation of the surface of the liquid column, the initial formation and deformation of the bag, and the breakup of the wave node, compared with the experimental photo, the simulation still cannot capture the detailed features of the membrane near the deformation limit and breakup.
Comparison of simulation result with experiment photo (t = 3.83ms).

Wang et al.(Reference Wang, Huang, Wang and Liu19) investigated the bag breakup process of round liquid jets in crossflows. The formation and breakup process of bags in a water jet is shown in Fig. 10. The figure shows that, although in the early stage of bag development, the membrane on the tip of the bag was very thin. At this position, however, in the current study’s numerical simulations, when the thickness of the membrane was less than the minimum mesh size, for the VOF model, the liquid phase was no longer continuous from a mathematical perspective. If the liquid phase is not continuous, the force balance between the pressure divergence and surface tension cannot be built up, hence the membrane cannot be formed. Furthermore, it was very difficult to accurately capture the precise phase boundary and find the right normal direction to establish the force balance of the membrane in a turbulent transient simulation. How to simulate all the details in bag breakup still needs further investigation.
Bag breakup process of water jet (Wang et al.(Reference Wang, Huang, Wang and Liu19)).

An intuitive comparison of liquid jet trajectory is shown in Fig. 11. It can be seen from the figure that when accurately simulating the velocity distribution of liquid jet and crossflow under the same experimental conditions, the numerical method used in this article can precisely simulate the trajectory and penetration of LJIC. In the range of  $x/{d_j} < 20$, the error between the simulated LJIC trajectory and the experimental measurement was less than ±5%.
Comparison of liquid jet trajectory (experiment data from Stenzler et al.(Reference Stenzler, Lee and Santavicca18)).

The results show that the CFD is valid for predicting jet trajectory and main characteristics of the breakup but not for predicting the finer flow features associated with jet breakup.
4.0 SIMULATION OF LJIC AT REAL ENGINE CONDITION
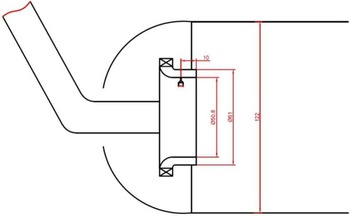
After the validation in section 3, it can be considered that the existing numerical method can be used to simulate LJIC under real engine operating conditions. Before the simulation, a real engine performance model was developed and the preliminary design of the combustor was completed to provide a proper physical model and flow boundary conditions for the LJIC simulation. The LEAP-1B engine was chosen to be the base model. A model of an engine similar to the LEAP-1B engine using information available in the public domain and making educated modelling assumptions (e.g. for component efficiencies, TET, etc.) for information not available in the public domain was modelled using GasTurb (version 11) software. The general performance parameters of different working conditions and aero- and thermodynamic parameters at different stations were calculated. This article selected the cruise point at which the engine had the longest working time and required higher atomisation quality to achieve better temperature profile pattern at the outlet of the combustor for LJIC simulation. The sketch of the structure of the liner in the dome region is shown in Fig. 12 (size in millimetres).
Sketch of structure of liner in dome region.

4.1 Calculation domain
Although the main stage passage was actually an annular channel, to show the details of the flow conveniently, the sector calculation domain was transformed into a rectangular calculation domain. The size of the final calculation domain was 10mm  $ \times $ 5.1mm
 $ \times $ 6mm (length
 $ \times $ height
 $ \times $ width), as shown in Fig. 13. The axial position of the nozzle was 5mm after the crossflow inlet.
Schematic of calculation domain.

4.2 Calculation grid
It is generally believed that when droplet size is less than 0.01mm, the droplet tends to follow the airflow because of its small mass, which has little influence on the main breakup characteristics of the liquid jet. Considering that the main objects studied in this paper are liquid jet trajectory and primary breakup characteristics, the minimum grid size is set to 0.01mm here. The refined mesh is shown in Fig. 14. After the final refinement, the size of the grid was approximately 13.7m.
Mesh at centre plane and zoomed view of mesh refinement.

4.3 Boundary conditions
The detailed boundary conditions for crossflow and liquid jet are shown in Table 3.
Boundary conditions of crossflow and liquid jet

The crossflow inlet velocity distribution used a fully developed turbulent velocity distribution, which was obtained from the simulation of a channel 200 times longer than the height of the passage, as shown in Fig. 15. The geometry of the nozzle used a structure similar to that of the validation case, and the velocity distribution at the nozzle exit is shown in Fig. 16.
Velocity profile at injection plane.

Contour map of velocity distribution at nozzle exit.

4.4 Results and discussion
The calculation was performed in 0.19ms.
4.4.1 Flow-field structure
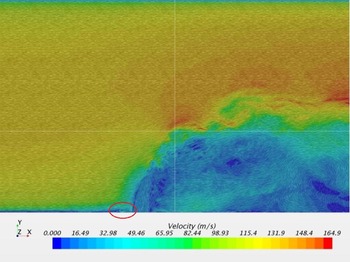
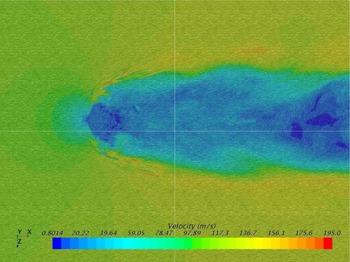
Figures 17 and 18 show the velocity distribution at the centre plane and Y = 1.25 d j plane, respectively.
Velocity distribution at centre plane (t = 0.19ms).

Velocity distribution at Y = 1.25 d j plane (t = 0.19ms).

It can be seen from the figures that, because of the blocking effect of the liquid jet, the crossflow decelerated and stagnated on the windward side of the liquid jet, and the static pressure increased. The crossflow formed a small corner recirculation zone (circle in Fig. 17) at the front side of the liquid jet root. The stagnated crossflow accelerated along the windward side of the liquid jet; one part flowed up and one part flowed around the liquid column. A large area of low speed was formed downstream of the liquid column, which was full of irregular vortices of various sizes.
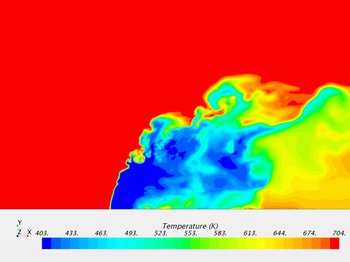
Figure 19 shows the temperature distribution at the centre plane. Because the temperature of the liquid jet was low and the temperature of the crossflow was high, the interaction between the liquid jet and the crossflow was accompanied by heat exchange. But since the calculated time scale was very small, the degree of heat exchange was relatively low, and the temperature distribution also showed the distribution of the liquid spray in the flow field.
Temperature distribution at centre plane (t = 0.19ms).

4.4.2 Breakup mechanism
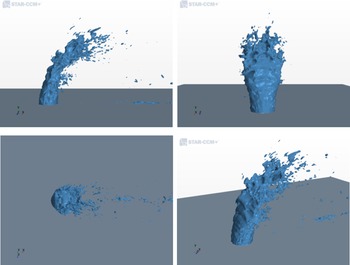
Figure 20 shows the boundaries of the liquid jet at different viewing angles. It can be seen that, at real engine operating conditions, the breakup mode of LJIC was surface shear breakup. The liquid column became flat under the aerodynamic force of the crossflow and bent downstream. The liquid column showed a small amount of deformation in the width direction. As the airflow accelerated on the surface of the liquid column, the velocity difference between the liquid column and the airflow on the gas–liquid boundary gradually increased, which caused the liquid surface to fluctuate because of K–H instability. The waves developed along the surface of the liquid column upwards and to both sides, forming a thin liquid film on the sides of the liquid column, and finally breaking into small droplets under the action of shear force. The droplets formed on the sides of the liquid column were very small (less than 0.01mm in diameter), and the current grid size cannot show the subsequent movement of such small droplets in detail.
Various views of boundaries of liquid jet (t = 0.19ms).

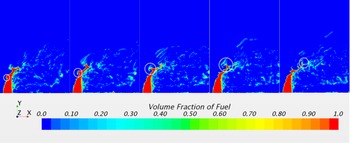
The contour map of the volume fraction of fuel in the centre plane is illustrated in Fig. 21. The time interval of each figure was 0.01ms. This figure shows the full development period of a surface wave, from the initial formation to the breakup at the tip of the liquid column. The initial wave was small, and the disturbance gradually increased as the airflow accelerated on the surface of the liquid. However, because of the surface tension of the liquid, the turbulent structure of the liquid surface eventually formed a vortex structure. The airflow decelerated and stagnated within the vortex, the static pressure increased and a pressure difference was formed on the liquid vortex. The pressure differential drove the vortex to develop rapidly on the liquid surface, and finally broke into large droplets at the top of the liquid column, moved downstream along the edge of the liquid plume, and further broke up into small droplets under the action of aerodynamic force. The observation of the development of surface waves can provide references for subsequent experimental measurements, such as that an appropriate high-speed camera response frequency is needed to capture the characteristics of surface waves.
Contour map of volume fraction of fuel in centre plane.

4.4.3 Trajectory of the LJIC
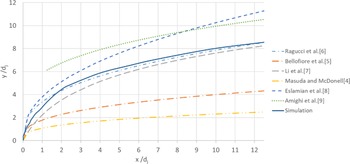
Figure 22 shows a comparison between the simulation result and the correlation predictions of the liquid jet trajectory.
Comparison between simulation result and correlation prediction of liquid jet trajectory.

At position  $x/{d_j}=12$ downstream of the nozzle, the penetration height of the liquid jet was about two-thirds of the height of the annular channel. Because the range of experimental conditions corresponding to different correlations and the boundary conditions of the velocity distribution of crossflow and liquid jets are very different, the results obtained by calculating the working conditions of this study with different correlations also show a big variation. This is not to say that the accuracy of these correlations is not good, but that it may not be suitable for the working conditions of this study. Compared with many correlations for predicting the trajectory of liquid jets, the simulation result was closest to the correlation of Ragucci et al.(Reference Ragucci, Bellofiore and Cavaliere6), and the accuracy of the simulation result is yet to be verified by subsequent experiments. Table 4 presents a comparison of the operating range provided by Ragucci and the simulation of this research. The trajectory of LJIC is affected by various parameters as presented in Table 4, as well as the velocity profile of both airflow and liquid jet. It can be seen from the comparison in Table 4 that the magnitude of
 $q$ and T is closer, and there is a great difference of
 $W{e_g}$ and P. It can be preliminarily concluded that
 $q$ and T have a greater impact on the trajectory of the liquid jet under typical aero-engine working conditions. But this is only a preliminary conclusion, which needs to be verified by experiments.
 $\;$
Comparison of operating range

5.0 CONCLUSIONS
LJIC simulation was performed using commercial CFD software. When accurate flow boundary conditions are given, this simulation can accurately predict the jet trajectory of LJIC (with a prediction error less than ±5% at atmospheric conditions) and capture most of the flow details.
Through the simulation of LJIC at real engine operating conditions, the flow-field characteristics were demonstrated, and the breakup mechanism of LJIC under high-temperature and high-pressure conditions was shown to be strong surface shear breakup mode. Under the research conditions of this project, the following correlation is most suitable for the prediction of LJIC trajectory. A database of numerical models was created to be further evaluated, validated and calibrated from a planned experimental campaign.
 \begin{equation*}\frac{y}{d_j}=2.28q^{0.422}{\left(\frac{x}{d_j}\right)}^{0.367}{We}^{-0.015}_g{\left(\frac{{\mu }_g}{{\mu }_{air,300K}}\right)}^{0.186}\end{equation*}
The results can be used to guide the design of transverse jet atomising nozzles in gas turbine combustor. At the preliminary design phase, the atomisation and mixing distribution features can be obtained with considerable accuracy to shorten the research and development period and reduce the test cost.
ACKNOWLEDGEMENTS
The authors gratefully acknowledge the financial support from the China Scholarship Council for Mr Yu Zhu which enabled him to enrol in and complete the MSc Thermal Power course at Cranfield University, where this research was conducted.