1. Introduction
Concentrated suspensions of microorganisms exist in nature and are closely related to health and ecological issues. For example, biofilms consisting of communities of bacteria generally form on solid–liquid interfaces. They are encased in a matrix of extracellular polymeric substances secreted by microorganisms (Jang, Rusconi & Stocker Reference Jang, Rusconi and Stocker2017), and cause infection (Bjarnsholt et al. Reference Bjarnsholt, Alhede, Alhede, Eickhardt-Sørensen, Moser, Kühl, Jensen and Høiby2013) and contamination of medical devices (Harding & Reynolds Reference Harding and Reynolds2014). The gut flora is also composed of many bacterial species. It contributes to the production of dietary components and is related to pathological conditions, so is involved in health (Ishikawa et al. Reference Ishikawa, Pedley, Drescher and Goldstein2020). Volvox microalgae accumulate at the free surface of bodies of fresh water due to their negative gravitaxis and attracting flow produced by other cells (Drescher et al. Reference Drescher, Leptos, Tuval, Ishikawa, Pedley and Goldstein2009; Ishikawa, Omori & Kikuchi Reference Ishikawa, Omori and Kikuchi2020). They perform photosynthesis and form the bottom layer of the food chain in ecological systems. To predict their colonisation and growth, it is necessary to clarify mass transport in concentrated suspensions of microorganisms.
It has been reported that the flow induced by microbial swimming alters mass transport in such suspensions (Wu & Libchaber Reference Wu and Libchaber2000; Sokolov et al. Reference Sokolov, Goldstein, Feldchtein and Aranson2009; Ishikawa et al. Reference Ishikawa, Yoshida, Ueno, Wiedeman, Imai and Yamaguchi2011). The bacteria Bacillus subtilis and Escherichia coli generate mesoscale coherent structures in dense suspensions ( ${\sim }10^{10}\ {\rm cell}\ {\rm ml}^{-1}$) through cell–cell interactions (Dombrowski et al. Reference Dombrowski, Cisneros, Goldstein and Kessler2004; Zhang et al. Reference Zhang, Be'er, Florin and Swinney2010; Ishikawa et al. Reference Ishikawa, Yoshida, Ueno, Wiedeman, Imai and Yamaguchi2011; Wensink et al. Reference Wensink, Dunkel, Heidenreich, Drescher, Goldstein, Löwen and Yeomans2012; Dunkel et al. Reference Dunkel, Heidenreich, Drescher, Wensink, Bär and Goldstein2013). The coherent structures cause mesoscale turbulent-like flow in their suspensions, hence diffusivity is enhanced significantly. Wu & Libchaber (Reference Wu and Libchaber2000) investigated the diffusivity of tracer beads in quasi-two-dimensional dense suspensions of E. coli. They showed that the diffusivity was proportional to the concentration of E. coli and was two to three orders of magnitude greater than Brownian diffusivity. Ishikawa et al. (Reference Ishikawa, Yoshida, Ueno, Wiedeman, Imai and Yamaguchi2011) reported a similar result for the diffusivity of tracer beads in a three-dimensional bacterial suspension. Sokolov et al. (Reference Sokolov, Goldstein, Feldchtein and Aranson2009) showed that the oxygen diffusion coefficient in a B. subtilis suspension exceeded that in a dilute suspension by at least one order of magnitude. Miño et al. (Reference Miño, Mallouk, Darnige, Hoyos, Dauchet, Dunstan, Soto, Wang, Rousselet and Clement2011) focused on the swimmers’ own activity, rather than the flow driven by swimmers, concerning enhanced diffusion in dense suspensions and the proportional relationship between the diffusivity and cell concentration. They used E. coli and self-propelled Au–Pt rods as active swimmers, and studied the effect of active swimmers on diffusivity at a solid surface. They showed that the tracer effective diffusivity
 $D_{eff}$ was enhanced with respect to Brownian diffusivity in their concentrated suspensions, and the increase was linearly related to the active fluxes of swimmers as
 \begin{equation} D_{eff} = D^B_0 + \kappa J_A, \end{equation}
where  $D^B_0$ is the Brownian diffusivity in the absence of active swimmers,
 $J_A$ is the active flux, the product of the number density of cells and the swimmers’ average velocity, and
 $\kappa$ is the prefactor coefficient. They suggested that the diffusivity increased with higher cell concentration due to the higher collision frequency between swimmers and tracers, and this claim is consistent with the scaling proposed theoretically by Ishikawa, Locsei & Pedley (Reference Ishikawa, Locsei and Pedley2010) and Burkholder & Brady (Reference Burkholder and Brady2017). In contrast to these linear trends, Kasyap, Koch & Wu (Reference Kasyap, Koch and Wu2014) showed that the tracer diffusivity corresponding to high bacterial concentration did not follow a linear trend and was much larger. Thus diffusivity in dense suspensions of swimming microorganisms has been investigated actively, but the details of the transport mechanism are not yet fully understood.
Several theoretical and numerical models have been developed to elucidate the mass transport mechanisms in suspensions of swimming microorganisms. Thiffeault & Childress (Reference Thiffeault and Childress2010) introduced the so-called ‘scattering event’, a closed-loop-like motion of tracer particles induced by swimmer–tracer hydrodynamic interactions, and expressed the net displacement of tracers as the sum of the advective displacement due to the event, to derive the diffusion coefficient in the high-Reynolds-number regime. Lin, Thiffeault & Childress (Reference Lin, Thiffeault and Childress2011) extended the theory to the low-Reynolds-number regime using the spherical squirmer model. Jepson et al. (Reference Jepson, Martinez, Schwarz-Linek, Morozov and Poon2013) applied this theory to bacterial dilute suspensions and showed that (1.1) held even in the dilute case, and  $\kappa$ was largely dependent on a run distance of E. coli. Miño et al. (Reference Miño, Dunstan, Rousselet, Clément and Soto2013) also calculated
 $\kappa$ in the same way, but the value was one order of magnitude lower than the value obtained by Jepson et al. (Reference Jepson, Martinez, Schwarz-Linek, Morozov and Poon2013), since they assumed that the run distance
 $\lambda$ of the E. coli was infinite, while Jepson et al. (Reference Jepson, Martinez, Schwarz-Linek, Morozov and Poon2013) assumed it to be finite. If
 $\lambda$ is infinite, then the net displacement due to a single scattering event is very small. Such a dependence of displacement on
 $\lambda$ has also been asserted by Morozov & Marenduzzo (Reference Morozov and Marenduzzo2014) using theory and simulation. In addition, although the entrainment by swimmers (Pushkin, Shum & Yeomans Reference Pushkin, Shum and Yeomans2013) is considered to be one of the important factors in mass transport (Jin et al. Reference Jin, Chen, Maass and Mathijssen2021), the theoretical
 $\kappa$ value obtained by Jepson et al. (Reference Jepson, Martinez, Schwarz-Linek, Morozov and Poon2013) was almost consistent with their experimental value, indicating that the effect of the entrainment was negligibly small. The above studies focus mainly on swimmers with pusher type such as E. coli, and Underhill, Hernandez-Ortiz & Graham (Reference Underhill, Hernandez-Ortiz and Graham2008) reported that active pusher type particles in a dilute suspension make the diffusivity greater than puller type. Thus the mechanism of diffusion has been clarified in detail for a dilute suspension of active swimmers. Theoretical and numerical analyses have also been performed for semi-dilute suspensions. Ishikawa et al. (Reference Ishikawa, Locsei and Pedley2010) studied the effect of tracer size on diffusivity in a squirmers’ suspension. They used inert spheres without Brownian motion as tracer particles, and investigated their flow-induced diffusion. Their results showed that the diffusivity was almost independent of the size of inert spheres. This was consistent with the trend in concentrated suspensions (Miño et al. Reference Miño, Mallouk, Darnige, Hoyos, Dauchet, Dunstan, Soto, Wang, Rousselet and Clement2011), but differed from that reported by Patteson et al. (Reference Patteson, Gopinath, Purohit and Arratia2016), who found that diffusivity of particles with Brownian motion was enhanced with increasing particle size in a dilute suspension. Ishikawa et al. (Reference Ishikawa, Locsei and Pedley2010) also showed that the flow-induced diffusivity was proportional to the volume fraction of active swimmers. Delmotte et al. (Reference Delmotte, Keaveny, Climent and Plouraboué2018) incorporated Brownian motion of inert particles into the model. They showed that the diffusivity was proportional to the volume fraction of swimmers in the dilute regime, while a nonlinear increase was seen in the semi-dilute regime rather than the linear trends reported by Ishikawa et al. (Reference Ishikawa, Locsei and Pedley2010). In terms of nutrient uptake, Ishikawa et al. (Reference Ishikawa, Kajiki, Imai and Omori2016) showed that the nutrient uptake rate increased as the square of the microbial volume fraction in semi-dilute regions, due to the agitation effect of microbial swimming. The agitation effects on nutrient uptake have also been reported by Magar, Goto & Pedley (Reference Magar, Goto and Pedley2003) and Magar & Pedley (Reference Magar and Pedley2005). As described, the mechanisms of mass transport for semi-dilute suspensions have been discussed actively as the same as the case of dilute suspensions. However, theoretical and numerical analyses in three-dimensional concentrated suspensions have been carried out only under limited conditions, such as in thin-film regions (Lambert et al. Reference Lambert, Picano, Breugem and Brandt2013), and have rarely been examined quantitatively despite their importance.
Taylor dispersion is another important theory that has long been used to discuss diffusion in flows. Taylor dispersion is the theory first proposed by Taylor (Reference Taylor1953), with which substances in a unidirectional flow field diffuse in the longitudinal direction much more than they diffuse only by the Brownian motion. This enhanced diffusion occurs when substances repeatedly cross streamlines with different longitudinal velocities by thermal diffusion, i.e. it occurs under the condition with velocity variation in the cross-section. The effective diffusivity is expressed by the following scaling with respect to the Péclet number:
 \begin{equation} \frac{D_{eff}}{D^B_0} = 1 + \alpha\,Pe^2, \end{equation}
where  $\alpha$ is the coefficient determined by the boundary condition, flow field, and so on (Broeck Reference Broeck1990). This theory has been extended widely, for example, to the curvilinear flow (Shapiro & Brenner Reference Shapiro and Brenner1986) and to the laminar flow through a porous media (Brenner Reference Brenner1980; Koch et al. Reference Koch, Cox, Brenner and Brady1989). These three papers showed that scaling (1.2) holds even in such conditions. It was also shown that even if the flow oscillates with time, the trend remains the same, and
 $\alpha$ became a function of the frequency of the oscillation (Broeck Reference Broeck1982; Jansons Reference Jansons2006; Levesque et al. Reference Levesque, Bénichou, Voituriez and Rotenberg2012). Crossing between streamlines of substances is caused not only by thermal diffusion but also by advection such as cross-flow (Lin & Shaqfeh Reference Lin and Shaqfeh2019; Wang et al. Reference Wang, Jiang, Chen and Tao2022). Lin & Shaqfeh (Reference Lin and Shaqfeh2019) introduced a constant cross-flow into a plane Poiseuille flow and investigated the effect of the cross-flow strength on Taylor dispersion. They showed that the diffusivity in the direction of the mainstream followed (1.2) for an identical strength cross-flow, and the effect of cross-flow suppressed Taylor dispersion when the effect became dominant, i.e. the diffusivity was also determined by the heterogeneity of cross-flow. Cross-flows could also occur in a dense microswimmer suspension that forms a heterogeneous flow field and cause diffusion increases similar to Taylor dispersion, but the extent of the cross-flow contribution is not determined independently in such a suspension. In other words, as the Péclet number in a suspension becomes higher, the heterogeneity of cross-flow becomes correspondingly stronger, and the diffusivity in a suspension of swimming microorganisms can no longer be described by the scaling (1.2). The scaling of diffusivity in such highly complex flow fields has not been discussed extensively, so it needs to be established to better understand diffusion in an active fluid.
In this study, we simulated numerically mass diffusion in a packed lattice of squirmers, which are fixed in space, as a model of a concentrated suspension of swimming microorganisms. Packed lattices of swimming microorganisms can be found in nature, e.g. Volvox colonies accumulated by phototaxis and gravitaxis at the surface of water bodies (Drescher et al. Reference Drescher, Leptos, Tuval, Ishikawa, Pedley and Goldstein2009), and Tetrahymena accumulated at the air–liquid interface (Ferracci et al. Reference Ferracci, Ueno, Numayama-Tsuruta, Imai, Yamaguchi and Ishikawa2013). Diffusion tensors are obtained from trajectories of passive particles in the lattice of squirmers. Details of the problem setting and numerical methods are described in § 2. In § 3, we investigate the effects of the volume fraction, Péclet number and lattice configuration of squirmers on the diffusivity, and then propose a scaling law that differs from the conventional theory (1.2) to predict diffusion tensors in § 4. We conclude in § 5.
2. Basic equations and numerical methods
2.1. Problem setting
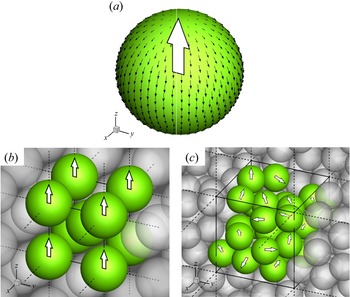
Swimming microorganisms were modelled by squirmers, as first proposed by Lighthill (Reference Lighthill1952) and then extended by Blake (Reference Blake1971). They have been used for the analysis of mass transport in suspensions of swimming microorganisms in a number of studies (Magar et al. Reference Magar, Goto and Pedley2003; Magar & Pedley Reference Magar and Pedley2005; Ishikawa et al. Reference Ishikawa, Locsei and Pedley2010; Lambert et al. Reference Lambert, Picano, Breugem and Brandt2013; Ishikawa et al. Reference Ishikawa, Kajiki, Imai and Omori2016; Pedley Reference Pedley2016). The squirmer swims, generating slip velocities on its body surface, as shown in figure 1(a). In this study, the squirmer is assumed to be a rigid sphere with surface slip velocities that are tangential, axisymmetric and time-independent. Moreover, we omit squirming modes larger than the second following Ishikawa et al. (Reference Ishikawa, Locsei and Pedley2010). The surface slip velocity is given by
 \begin{equation} u_s = \tfrac{3}{2}U\sin\theta \left(1+\beta \cos\theta\right), \end{equation}
where  $U$ is the swimming speed of a solitary squirmer swimming freely in a fluid otherwise at rest,
 $\beta$ is the swimming mode, and
 $\theta$ is the angle from the orientation vector
 $\boldsymbol {e}$ of the squirmer. The squirmer becomes a puller with positive
 $\beta$, a neutral swimmer with
 $\beta = 0$, and a pusher with negative
 $\beta$.
Problem setting. (a) Swimming microorganism is modelled by a squirmer. Black vectors are slip velocities on the surface ( $\beta = 0$). The white arrow indicates the orientation vector. (b) Configuration of squirmers: the body-centred cubic lattice with uniform orientation. The orientation vectors
 $\boldsymbol {e}$ were set in the
 $z$-direction as
 $\boldsymbol {e}=(0,0,1)$. (c) Configuration of squirmers: the random positions and orientations. The regions bounded by solid lines in (b,c) indicate the unit domains.

The packed suspension of swimming microorganisms is represented by a lattice of squirmers that are fixed in space by external forces. We assume two states. (i) In one state, squirmers are aligned in the body-centred cubic (BCC) lattice, and all squirmers are oriented in the same direction,  $\boldsymbol {e} = (0,0,1)$ in the Cartesian coordinate system, as shown in figure 1(b). (ii) In the other state, both the configuration and orientations of squirmers are random (cf. figure 1c). For both cases, the configurations and orientations of squirmers are assumed to remain at all time points due to their fixed state. Here, the setting (i) may appear when many Volvox colonies are present at a free surface directed upwards due to phototaxis and gravitaxis, or many Tetrahymena cells are present at an air–liquid interface directed towards the air phase due to chemotaxis; although the swimming microorganisms directing interfaces try to translate, cells at the interface are stuck geometrically, and other cells below the interface also become stuck. We analysed the diffusivity in such settings (cf. §§ 3.1, 3.2, 3.3 and 3.4), and further analysed the case of (ii) representing general suspensions in § 3.4, to better understand mass transport in a dense suspension of swimming microorganisms. As the configuration of squirmers is a lattice, we apply the triply periodic boundary condition to squirmers and the flow field, which results in an infinite suspension. Moreover, the net fluid velocity is set to zero, so there are flows that cancel each other out on average, e.g. there are upward and downward flows in the setting (i).
2.2. Fluid mechanics
Typically, swimming microorganisms range in size from one to hundreds of micrometres, and the Reynolds number based on their size and velocity is sufficiently small that the flow around them can be approximated as Stokes flow. The velocity  $\boldsymbol {u}$ at any point
 $\boldsymbol {x}$ in the fluid phase is given by the boundary integral equation (Pozrikidis Reference Pozrikidis1992):
 \begin{equation} \boldsymbol{u}(\boldsymbol{x})-\langle\boldsymbol{u}\rangle ={-}\frac{1}{8{\rm \pi}\eta}\sum^{N}_{n=1}\int\boldsymbol{\mathsf{J}}^{E}(\boldsymbol{x},\boldsymbol{y})\,\boldsymbol{q}(\boldsymbol{y})\,{\rm d}A_{n}, \end{equation}
where  $\langle \boldsymbol {u}\rangle$ is the fluid velocity averaged over a plane in a unit domain,
 $\eta$ is the viscosity,
 $N$ is the number of squirmers in a unit domain,
 $\boldsymbol{\mathsf{J}}^{E}$ is the Green function for the triply periodic lattice based on the Ewald summation (Beenakker Reference Beenakker1986), and
 ${\boldsymbol {q}}$ is the traction force induced at
 $\boldsymbol {y}$ on the squirmer surface
 $A$. Ewald summation expresses the Green function as a summation in real and Fourier spaces, which accelerates the convergence of the velocity field and makes it possible to represent a system with an infinite number of squirmers by finite periodic domains. Though
 $\langle \boldsymbol {u}\rangle$ can be set arbitrarily (Brady et al. Reference Brady, Phillips, Lester and Bossis1988), we set it to zero to achieve no net flow in the domain. The boundary condition is
 $\boldsymbol {u}(\boldsymbol {x}) = \boldsymbol {u}_s$ when
 $\boldsymbol {x}$ is on the surface of a squirmer.
2.3. Tracer particle motion
We calculated the motion of passive tracer particles in a lattice of squirmers to evaluate the diffusivity of the particles. We assumed that particles are sufficiently small and show Brownian motion, so they move by advection caused by the squirming velocities and Brownian diffusion. The position of a particle at time  $t+\Delta t$ is expressed by the Lagrange description (Ermak & McCammon Reference Ermak and McCammon1978)
 \begin{equation} \boldsymbol{r}(t+\Delta t) = \boldsymbol{r}(t)+\int^{t+\Delta t}_{t}\boldsymbol{u}(\boldsymbol{r}, t^{\prime})\,{\rm d}t^{\prime}+\boldsymbol{r}^B(\Delta t), \end{equation}
where  $\boldsymbol {u}$ is the velocity at
 $\boldsymbol {r}(t^{\prime })$, and
 $\boldsymbol {r}^B$ indicates the displacement due to Brownian motion. Brownian motion follows a Gaussian distribution with
 \begin{equation} \mu = \mu_i = \left\langle r^B_i(\Delta t)\right\rangle = 0,\quad \sigma = \sigma_i = \left\langle\left(r^B_i(\Delta t)\right)^2\right\rangle = 2D^B\,\Delta t, \end{equation}
where  $D^B$ is the isotropic diffusion coefficient of tracer particles in free space, and the angle brackets
 $\langle \ \rangle$ indicate the ensemble average (Ermak & McCammon Reference Ermak and McCammon1978). According to the Box–Muller method (Box & Muller Reference Box and Muller1958), Brownian random displacement
 $\boldsymbol {r}^B(\Delta t)$ is given by
 \begin{equation} r^B_i(\Delta t) = \mu + \sqrt{-2\sigma\ln(R_1)}\cos(2{\rm \pi} R_2), \end{equation}
where  $\ln$ is the natural logarithm, and
 $R_1$ and
 $R_2$ are uniform random numbers between 0 and 1. As a boundary condition, the absorption of particles by the squirmer is not taken into account, so there is no advection and diffusion flux normal to the surface. However, the sliding velocity of the surface is given when the particles reach the squirmer surface:
 $\boldsymbol {u} = \boldsymbol {u}_s$.
To discuss whether mass transport is advection- or diffusion-dominated, the Péclet number is introduced here and defined as
 \begin{equation} Pe = \frac{Ua}{D^B}, \end{equation}
where  $a$ is the radius of a squirmer. Advection is dominant when the Péclet number is high, while diffusion is dominant when the Péclet number is low.
2.4. Flow-induced diffusivity
The flow-induced diffusion tensor is calculated based on the mean-square displacement (MSD) of particles to each axis. If the MSD grows with the square of time, then the spread of particles is advective. On the other hand, if it grows linearly with time, then it is diffusive. We follow Ishikawa et al. (Reference Ishikawa, Locsei and Pedley2010), and calculate the dispersion tensor with time duration  $\Delta t$ by
 \begin{equation} \boldsymbol{\mathsf{D}}^{F\prime}(\Delta t)=\frac{\left\langle\left(\boldsymbol{r}(t+\Delta t) - \boldsymbol{r}(t)\right) \otimes \left(\boldsymbol{r}(t+\Delta t) - \boldsymbol{r}(t)\right)\right\rangle}{2\Delta t}. \end{equation}
The flow-induced diffusion tensor is then given by
 \begin{equation} \boldsymbol{\mathsf{D}}^F=\lim_{\Delta t \to \infty}\boldsymbol{\mathsf{D}}^{F\prime}(\Delta t). \end{equation}
2.5. Numerical methods
The boundary integral equation is calculated by the boundary element method (Pozrikidis Reference Pozrikidis1992), as in our previous paper (Kitamura, Omori & Ishikwa Reference Kitamura, Omori and Ishikwa2021). The spherical surface of each squirmer is discretised by 1280 triangles, and the integration on each triangle is performed by Gaussian quadrature with six Gaussian nodes. We solve the simultaneous equation (2.2) with the boundary condition (2.1) to determine the traction forces on squirmers. Once  $\boldsymbol {q}$ distribution on the squirmer surfaces is obtained, the velocity field can be calculated from (2.2) at arbitrary positions in the fluid phase. The number of tracer particles used in the simulation is 10 000, and their initial positions are set uniformly randomly. The velocities of particle motion are interpolated from the database of velocity fields constructed as the combination of the Cartesian mesh in a unit domain and the polar mesh centred at the centre of each squirmer. The accuracy of the calculated diffusivities is guaranteed by the number of particles and the database resolution used in this study. Time marching is performed using a second-order Runge–Kutta method. The parameters varied in the present study were
 $\beta$,
 $Pe$ and the volume fraction of squirmers
 $\phi$. In addition, the lattice configuration of squirmers was changed to investigate its effect on diffusivity.
3. Results
3.1. Trajectories of particles
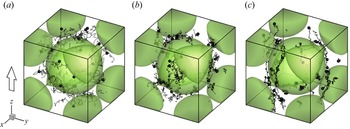
As the positions and orientations of squirmers are fixed geometrically, the flow field within the suspension is independent of time. Motion of particles can then be characterised by the Péclet number under a given volume fraction, swimming mode and lattice configuration. Figure 2 shows the trajectories of particles with various  $Pe$. When
 $Pe$ is low, the motion of particles is governed mainly by Brownian motion, and the trajectories of particles are likely to be random, as shown in figure 2(a). On the other hand, when
 $Pe$ is high, the motion of the particle is less affected by Brownian motion and follows the streamlines; cf. figure 2(c). The MSD of particles in the swimming direction of squirmers,
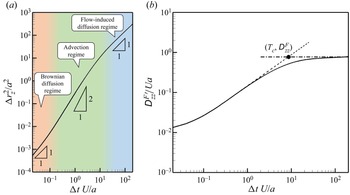
 $\Delta r^2_z$, is shown as a double logarithmic plot in figure 3(a). The volume fraction, swimming mode and Péclet number were set to
 $\phi = 0.50$,
 $\beta = 0.0$ and
 $Pe = 1.0\times 10^{2}$, respectively. We saw three different particle motions, depending on the time duration
 $\Delta t$: Brownian diffusion, advection and flow-induced diffusion regimes. The Brownian diffusion regime is when
 $\Delta t\,U/a$ was much smaller than 1, the motion of particles was diffusive, and the MSD was proportional to time even under conditions with high Péclet number. The advection regime is when
 $\Delta t\,U/a \sim O(1)$, and the displacement due to Brownian motion was sufficiently small compared to that due to advection, so the motion of particles was advection-dominated and the MSD was proportional to the square of time. Note that the slope in figure 3(a) was not exactly 2 because it contained a small Brownian effect. The flow-induced diffusion regime is when
 $\Delta t\,U/a$ was sufficiently large, and the MSD was again proportional to time. This indicated that the motion of particles became diffusive over a long duration even when particle motion was governed mainly by advection.
Trajectories of passive particles when (a)  $Pe=1.0\times 10^0$, (b)
 $Pe=1.0\times 10^1$, and (c)
 $Pe=1.0\times 10^2$ in a unit BCC. The volume fraction of squirmers is
 $\phi =0.50$, and the white arrow indicates the orientation vector.

(a) The MSD of particles in the squirmers’ orientation direction as a function of  $\Delta t$ when
 $\phi =0.50$,
 $\beta =0.0$ and
 $Pe=1.0\times 10^2$. The orange area represents the Brownian diffusion regime, the green area represents the advection regime, and the blue area represents the flow-induced diffusion regime. (b) The dispersion component
 ${\mathsf{D}}^{F\prime }_{zz}$ in the orientation direction of squirmers as a function of
 $\Delta t$. The dashed line is the tangent line at the point where the slope has its maximum. The dash-dotted line indicates the converged
 ${\mathsf{D}}^{F\prime }_{zz}$. The cross-section is
 $(T_c, {\mathsf{D}}_{zz}^F)$.

To determine the time scale of flow-induced diffusion, we introduced the time scale  $T_c$ at which particles start to show flow-induced diffusion. Figure 3(b) shows the time evolution of the dispersion component
 ${\mathsf{D}}^{F\prime }_{zz}$ in the orientation direction of squirmers (
 $\phi = 0.50$,
 $\beta = 0.0$ and
 $Pe = 1.0\times 10^2$). The dashed line shows the tangent line at the point where the slope reaches its maximum, i.e. when the advection effect is the maximum, and the dash-dotted line shows the converged
 ${\mathsf{D}}^{F\prime }_{zz}$. The eventual diffusivity
 ${\mathsf{D}}_{zz}^F$ and the time scale
 $T_c$ were defined as the intersection of these two lines. In the following subsections, we discuss the effects of
 $\phi$,
 $\beta$ and lattice configuration on the flow-induced diffusion.
3.2. Effect of  $\phi$

Figure 4 shows the relationship between the volume fraction of squirmers  $\phi$ and the diffusion tensors (
 $Pe = 1.0\times 10^2$). Flow-induced diffusion was anisotropic, differed from Brownian diffusion and tended to be more diffusive in the
 $z$-direction than the
 $x$- and
 $y$-directions:
 ${\mathsf{D}}_{zz}^F\gg {\mathsf{D}}_{yy}^F$ and
 ${\mathsf{D}}_{yy}^F$, where
 ${\mathsf{D}}_{zz}^F$ is the diffusion component in the orientation direction of squirmers, and
 ${\mathsf{D}}_{yy}^F$ and
 ${\mathsf{D}}_{yy}^F$ are the diffusion components perpendicular to it. As shown in figure 4,
 ${\mathsf{D}}_{yy}^F$ and
 ${\mathsf{D}}_{yy}^F$ are almost independent of
 $\phi$, whereas
 ${\mathsf{D}}_{zz}^F$ increases with
 $\phi$. The flow-induced diffusion component
 ${\mathsf{D}}_{zz}^F/Ua$ is of the order of
 $O(10^{-1})$ (cf. figure 4a), while the thermal Brownian diffusion coefficient can be derived as
 $D^B/Ua = 0.01$, as the Péclet number is set to
 $Pe = 1.0\times 10^2$. Flow-induced diffusivity is then from tens to a hundred times larger than Brownian diffusivity, and the diffusivity is greatly enhanced by the squirming velocities.
Diffusion components as a function of  $\phi$ with
 $Pe=1.0\times 10^2$: (a) in the orientation direction of squirmers; (b) in the direction perpendicular to the orientation direction.

When the volume fraction  $\phi$ is less than 0.3, we also see a linear increase of
 ${\mathsf{D}}_{zz}^F$ regardless of the swimming mode
 $\beta$ (cf. figure 4a). These linear trends in the dilute regime are in good agreement with bacterial and Chlamydomonas suspensions (Wu & Libchaber Reference Wu and Libchaber2000; Leptos et al. Reference Leptos, Guasto, Gollub, Pesci and Goldstein2009; Jepson et al. Reference Jepson, Martinez, Schwarz-Linek, Morozov and Poon2013). In high-concentration regimes (
 $\phi \ge 0.4$), however,
 ${\mathsf{D}}_{zz}^F$ is no longer linear and is almost a plateau when
 $\beta = 0$. These results show that changes in the flow field caused by different swimming modes dominate flow-induced diffusion, and that the diffusivity is not a simple function of the volume fraction of squirmers.
3.3. Effect of $Pe$

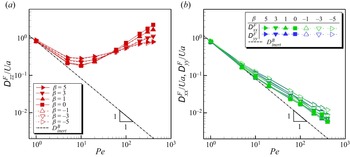
We next investigated the effects of the Péclet number. Diffusion tensors as a function of  $Pe$ are shown in figure 5. The volume fraction
 $\phi$ was set to
 $\phi = 0.50$ for all cases. Although
 ${\mathsf{D}}_{yy}^F$ and
 ${\mathsf{D}}_{yy}^F$ were approximately inversely proportional to
 $Pe$,
 ${\mathsf{D}}_{zz}^F$ tended to increase with
 $Pe$ in high Péclet number regimes. This trend was completely different from the diffusivity in a lattice of inert spheres, which was inversely proportional to
 $Pe$. Accordingly, when
 $Pe \ge 1.0\times 10^2$, the flow-induced diffusivity was more than 100 times larger than in a lattice of inert spheres, and the diffusivity was comparable to that in low
 $Pe$. These results indicate that even large molecules can be transported into a cluster of swimming microorganisms by the flow generated by the microorganisms themselves. By aggregating, microorganisms gain the ability to transport substances of any molecular weight, from low-molecular-weight substances such as oxygen and carbon dioxide, to high-molecular-weight substances such as proteins. This may help them to form colonies and expand their habitats.
The relationship between diffusion components and  $Pe$ with
 $\phi =0.50$. The dash-dotted line with slope
 $-1$ indicates the diffusion coefficient in a lattice of inert spheres that are arranged to the same configuration as squirmers (
 $D^B_{inert}$). (a) Diffusion components in the orientation direction of squirmers (
 ${\mathsf{D}}_{zz}^F$). (b) Diffusion components in the direction perpendicular to the orientation direction (
 ${\mathsf{D}}_{yy}^F$ and
 ${\mathsf{D}}_{yy}^F$).

3.4. Effect of lattice configuration
To discuss the effects of the configuration of squirmers, we compared the diffusion tensors in different lattice configurations and different orientations of squirmers. Figure 6 shows the diffusion tensors in the simple cubic (SC), body-centred cubic (BCC), and face-centred cubic (FCC) lattices when  $\phi = 0.50$,
 $\beta = 0.0$ and
 $Pe = 1.0\times 10^2$. The orientation direction of squirmers was
 $(0, 0, 1)$ for all lattice configurations.Component
 ${\mathsf{D}}_{zz}^F$ in the SC lattice was the largest, followed in order by that in the BCC lattice and that in the FCC lattice. Components
 ${\mathsf{D}}_{yy}^F$ and
 ${\mathsf{D}}_{yy}^F$ were maximum at the FCC lattice, although their magnitudes were smaller than
 ${\mathsf{D}}_{zz}^F$. The diffusivity differed substantially depending on the lattice configuration.
The relationship between diffusion components and the configuration of squirmers. The schematic diagram represents the lattice configurations SC, BCC and FCC. (a) Diffusion components in the orientation direction of squirmers ( ${\mathsf{D}}_{zz}^F$). (b) Diffusion components in the direction perpendicular to the orientation direction (
 ${\mathsf{D}}_{yy}^F$ and
 ${\mathsf{D}}_{yy}^F$).

We next investigated the effects of squirmer orientation. The lattice configuration was kept to the BCC, but the orientation was varied from the  $z$-axis with angle
 $\theta _1$ or
 $\theta _2$ (definitions are presented in figure 7a). We also define
 ${\mathsf{D}}_{ee}^F$ as the diffusivity in the orientation direction of squirmers, i.e.
 ${\mathsf{D}}_{ee}^F = {\mathsf{D}}_{zz}^F$ with
 $\theta = 0$. Here,
 ${\mathsf{D}}_{ee}^F$ decreased significantly with both
 $\theta _1$ and
 $\theta _2$, indicating that the diffusivity in the same lattice configuration varied greatly due to the orientation direction of squirmers. These results indicate that the diffusivity depends not only on the configuration but also on the orientation of squirmers.
(a) Schematic diagram of the definitions of  $\theta _1$ and
 $\theta _2$, the angles of squirmers’ orientation from the
 $z$-axis. Here,
 $\theta _1$ is defined in the
 $x$–
 $z$ plane, whereas
 $\theta _2$ is defined in the
 $x=y$ plane. (b) Diffusion components in the orientation direction of squirmers
 ${\mathsf{D}}_{ee}^F$ as a function of the angles.

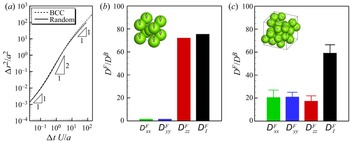
We simulated, at last, the effect of the randomness of lattice configurations and orientations on the diffusivity in order to gain a better understanding of mass transport in general situations. As seen in figure 1(c), 24 squirmers are set randomly in a unit domain, and their orientations are also set randomly. Then the triply periodic boundary condition is applied to this system. Figure 8(a) shows the MSD of tracer particles,  $\Delta r^2$, as a function of
 $\Delta t$ when
 $\phi =0.47$ and
 $Pe=1.0\times 10^2$ in the BCC lattice and a random array of neutral swimmers. The MSD in the random array had the same trend as the BCC case, which indicates that flow-induced diffusion occurs even when both configuration and orientations are random. Figures 8(b) and 8(c) show the ratio of flow-induced diffusivities to the Brownian diffusivity: in figure 8(b) when squirmers are set to the BCC lattice and they are oriented in the same direction, and in figure 8(c) when both are random. Shown by the black bars,
 ${\mathsf{D}}_{I}^F$ indicates the first invariant of diffusion tensors, i.e.
 ${\mathsf{D}}_{I}^F={\mathsf{D}}_{yy}^F+{\mathsf{D}}_{yy}^F+{\mathsf{D}}_{zz}^F$. In the random case,
 ${\mathsf{D}}_{I}^F$ was below the value for the case of the BCC lattice and the same oriented direction, indicating again that the diffusivity differed depending on the lattice configurations and squirmers’ orientations. However, the order of the enhanced ratio was
 $O(10)$, which means even in the random case, the diffusivity can be significantly promoted. The enhanced direction of diffusion became isotropic when the orientation direction is random, and the diffusivity in each axial direction was about 20–30 times the Brownian diffusion coefficient. These results show that although the direction in which diffusion occurs depends on the orientation distribution of the squirmers, aggregation of squirmers enhances the flow-induced diffusivity regardless of the configuration.
(a) The MSD of tracer particles as a function of  $\Delta t$ when
 $\phi =0.47$,
 $\beta =0.0$ and
 $Pe=1.0\times 10^2$ in the BCC lattice and a random array. (b,c) The ratio of flow-induced diffusion components to the Brownian diffusivity: (b) when the configuration of squirmers is the BCC lattice and their orientations are in the same direction, and (c) when both configuration and orientation are uniformly random. Here,
 ${\mathsf{D}}_{I}^F$ indicates the first invariant of the diffusion tensor. For the random case,
 $D^F/D^B$ is the average of 16 independent cases, and error bars are the standard deviations.

3.5. Comparison with Taylor dispersion
When swimming microorganisms were oriented in the same direction, the flow-induced diffusivity in the orientation direction was greatly enhanced with increasing  $Pe$ (cf. figure 5). Although this trend resembles the conventional Taylor dispersion theory, which claims that the diffusivity is scaled as
 $(1+\alpha \,Pe^2)D^B_{inert}$, the slopes of the diffusivity in a high-
 $Pe$ regime of figure 5(a) differ depending on the size of
 $\beta$. In this subsection, we compare the flow-induced diffusivity under study with the Taylor dispersion theory, and examine the effect of squirming modes on it.
We adjust the vertical axis in figure 5(a) to the ratio between flow-induced diffusivity in the squirmers’ orientation direction and the Brownian diffusivity in the BCC lattice of inert spheres,  ${\mathsf{D}}_{zz}^F/D^B_{inert}$, and then see if the diffusivity obtained in the present study follows (1.2), i.e. Taylor dispersion theory. Figure 9(a) shows
 ${\mathsf{D}}_{zz}^F/D^B_{inert}$ as a function of
 $Pe$, which is a replotting of the data in figure 5(a). Although the slopes in the high-
 $Pe$ regime vary with
 $\beta$, they would all follow the equation
 \begin{equation} \frac{{\mathsf{D}}_{zz}^F}{D^B_{inert}} = 1 + \alpha\,Pe^n. \end{equation}
Figure 9(b) indicates the exponent  $n$ of
 $Pe$ when fitting the data in figure 9(a) with (3.1). Since diffusion can be considered as Taylor dispersion when
 $n=2$, diffusion for all
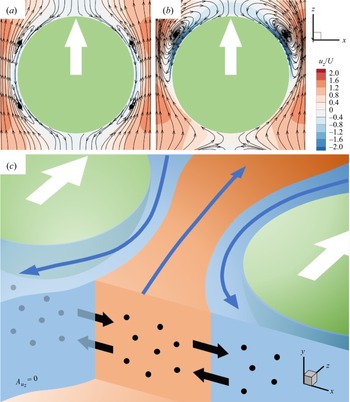
 $\beta$ did not precisely follow Taylor dispersion. This is due to the presence of cross-flows in a suspension of squirmers. When cross-flow is present, the increase in diffusivity in the mainstream direction is weakened as the heterogeneity of cross-flow increases (Lin & Shaqfeh Reference Lin and Shaqfeh2019). Figures 10(a) and 10(b) show streamlines on a
 $y=0.0$ plane with
 $\beta =0.0$ and
 $\beta =3.0$, respectively. For both
 $\beta$ values, there were vortex flows, which caused cross-flows in the direction vertical to the
 $z$-direction. In this case, as
 $Pe$ becomes higher, the heterogeneity of cross-flow becomes correspondingly stronger; therefore
 $n$ became lower than 2. Furthermore, when
 $|\beta |>1$, recirculation regions were formed in front of or behind a squirmer, as seen in figure 10(b), which increased the intensity of cross-flows, and correspondingly
 $n$ deviates from 2 more strongly with increasing
 $|\beta |$. Thus the diffusivity in a complicated flow such as those found in a microorganisms’ suspension can no longer be described by the conventional Taylor dispersion theory.
The scaling of diffusivity with respect to  $Pe$:
 ${\mathsf{D}}_{zz}^F/D^B_{inert}=1+\alpha \,Pe^n$. (a) The ratio of diffusivity in the squirmers’ orientation direction to the Brownian diffusivity in the BCC lattice as a function of
 $Pe$ when
 $\phi =0.50$. (b) The exponent
 $n$ of
 $Pe$ with various
 $\beta$. The values were obtained by least squares fitting of the data in (a). The dotted line indicates the case of conventional Taylor dispersion, i.e.
 $D_{eff}/D^B=1+\alpha \, Pe^2$.

Flow fields in the BCC lattice of squirmers. Green circles and half-spheres represent squirmers, and white arrows indicate their orientation. Streamlines on a plane  $y=0.0$ with (a)
 $\beta =0.0$ and (b)
 $\beta =3.0$ (
 $\phi =0.50$). The colour contour indicates the
 $z$-component of the fluid velocity – upstream and downstream in both cases – and the recirculation region is generated in front of the puller type with
 $\beta =3.0$. (c) The schematic diagram of a flow field. Blue arrows show the flow direction; the orange area represents upward flow (
 $u_z>0$), and the light blue area represents downward flow (
 $u_z<0$). The curved surface with
 $u_z=0$ is the interface of two areas, where area
 $A$ is defined. Black dots represent particles, and black arrows indicate the fluxes involving both the advection fluxes and the fluxes due to Brownian diffusion. Particles cross the two areas by the fluxes.

4. Scaling
Diffusivity has units  $\mathrm {m}^2\ \mathrm {s}^{-1}$, and so can be scaled as
 ${\mathsf{D}}_{zz}^F \sim U^2_cT_c$. In this section, we provide a scaling argument for predicting
 $T_c$ and
 $U_c$, which leads to estimation of
 ${\mathsf{D}}_{zz}^F$. Our scaling is applicable to cases where the effects of mainstream and cross-flow vary together, and differs from the traditional approach of considering cross-flow as independent. The scaling argument is useful to understand the mechanism of flow-induced diffusion, because the effects of parameters on the diffusivity are described mathematically.
4.1. Particle flux crossing upstream and downstream
To predict flow-induced diffusion theoretically, we introduce a flux-based scaling law. As total net flow in the suspension was zero, there were upward and downward flows within the suspension (cf. figure 10). Under high- $Pe$ conditions, passive particles move mainly along their respective streamlines and are transported in one direction, either upwards or downwards. However, they occasionally cross the interface, where the flow direction is reversed by Brownian motion and advection fluxes perpendicular to the interface. The motion of particles is then considered to be diffusive as they pass repeatedly through the interface.
Based on the mass conservation law, flux crossing the boundary of  $u_z = 0$ per unit time and unit area can be decomposed into two terms:
 \begin{equation} f=f_a+f_B, \end{equation}
where  $f_a$ is the advection flux crossing the boundary, and
 $f_B$ is the flux due to Brownian diffusion. The advection flux
 $f_a$ is given by
 \begin{equation} f_a=c\left|u_n\right|, \end{equation}
where  $c$ is the number density of particles, and
 $u_n$ is the velocity normal to the curved surface of
 $u_z = 0$.
The diffusion flux  $f_B$ may be estimated using a one-dimensional random walk model (Berg Reference Berg1984) because the flux in (4.1) is normal to the surface of
 $u_z = 0$. Let
 $M(x)$ be the number of particles at grid
 $x$. The grid for the random walk is placed with interval
 $\delta$, where
 $\delta ^2$ is the MSD in time duration
 ${\rm d}t$ and satisfies
 $\delta ^2 = 2D^B\,{\rm d}t$. The flux through a plane at
 $x+\delta /2$ can be expressed as
 \begin{equation} f_B=\frac{M(x+\delta)+M(x)}{2A\,{\rm d}t}, \end{equation}
where  $M(x+\delta )$ is the number of particles at
 $x+\delta$, and
 $A$ is the unit area. The two terms in the numerator are both positive, because they do not imply a net flux, but rather account for all fluxes in both directions. Equation (4.3) is then transformed into
 \begin{align} f_B&=\frac{M(\boldsymbol{x}+\boldsymbol{\delta})+M(\boldsymbol{x})}{2A\delta}\,\frac{\delta^2}{2\,{\rm d}t}\,\frac{2}{\delta}\nonumber\\ &=cD^{B}\,\frac{2}{\delta}\nonumber\\ &=c\sqrt{\frac{2Ua}{Pe\,{\rm d}t}}. \end{align}
Substituting (4.2) and (4.4) into (4.1), the total flux can be rewritten as
 \begin{equation} f=c\left|u_n\right|+c\sqrt{\frac{2Ua}{Pe\,{\rm d}t}}. \end{equation}
Integrating (4.5) in a unit domain and dividing it by the volume of a unit domain, total mass crossing the boundary of  $u_z = 0$ per unit time and unit volume is given by
 \begin{align} F &= \frac{1}{V}\int_{A_{u_z=0}}\left(c\left|u_n\right|+c\sqrt{\frac{2Ua}{Pe\,{\rm d}t}}\right){\rm d}A\nonumber\\ &= \frac{c}{V}\int_{A_{u_z=0}}\left|u_n\right|{\rm d}A + \frac{cA_0}{V}\,\sqrt{\frac{2Ua}{Pe\,{\rm d}t}}, \end{align}
where  $V$ is the volume of a unit domain, and
 $A_0$ is the surface area of the boundary per unit domain. The concentration field is assumed to have no effect on the velocity field, so the first term on the right-hand side of (4.6) is independent of
 $Pe$, whereas the second term is proportional to
 $Pe^{-0.5}$. The swimming mode
 $\beta$ and volume fraction
 $\phi$ change the flow structure in the suspension and determine the balance between the advection and diffusion flux in (4.6).
4.2. Time scale $T_c$

We first investigated the relationship between the flux and the time scale  $T_c$. The time scale of flow-induced diffusion should be dependent on the frequency for particles to pass the boundary between positive and negative streamlines, because it corresponds to a direction change in the random walk model. We then assumed that the time scale is inversely proportional to the mass transport through the boundary per unit time and unit volume:
 $T_c \propto F^{-1}$. In the case of a neutral squirmer (
 $\beta = 0$), there is no recirculation region, so the advection flux across the boundary
 $|u_n|$ is sufficiently small compared to the diffusion flux:
 $\int _{A_{u_z = 0}}|u_n|\,{\rm d}A \ll A_0\sqrt {2Ua/(Pe\,{\rm d}t)}$. Therefore,
 $T_c$ should be proportional to the square root of
 $Pe$. Figure 11 shows the relationship between
 $T_c$ and
 $Pe$ with
 $\phi = 0.50$ and the BCC lattice. We see the
 $Pe^{0.5}$ trend when
 $\beta = 0$, while the slope is less than 0.5 when
 $\beta \ge 3$. In the case of pushers or pullers with
 $|\beta | > 1$, recirculation regions are generated around the squirmer, and
 $|u_n|$ becomes relatively large. Due to the flux enhancement by advection,
 $T_c$ becomes smaller than the 0.5 power law of
 $Pe$ when
 $|\beta | > 1$.
The relationship between  $T_c$ and
 $Pe$ when
 $\phi =0.50$ in the BCC lattice.

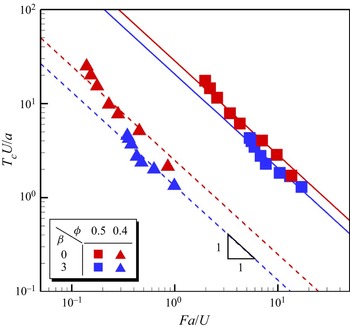
We then calculated  $F$ directly from the numerical simulation, and the relationship between
 $T_c$ and
 $F$ is shown in figure 12. Here,
 $T_c$ is almost inversely proportional to
 $F$ regardless of
 $\beta$ and
 $\phi$, confirming the reliability of our scaling.
The relationship between  $T_c$ and
 $F$. The solid and dashed lines are fitted using the least squares method with slope
 $-1$.

4.3. Velocity scale $U_c$

Next, we discuss the velocity scale  $U_c$ under given
 $\beta$ and
 $\phi$ conditions. We define the characteristic velocity
 $U_c$ as
 $U_c \equiv \sqrt {{\mathsf{D}}_{zz}^F/T_c}$, where
 ${\mathsf{D}}_{zz}^F$ and
 $T_c$ were defined as in figure 3(b). Figure 13 shows the relationship between
 $U_c$ and
 $Pe$ with
 $\phi = 0.50$ and the BCC lattice. Here,
 $U_c$ was almost invariant with
 $Pe$, but changed slightly with
 $\beta$. Thus the flow scale is independent of
 $Pe$, which is consistent with the condition that the flow field is not changed by the concentration field.
The relationship between  $U_c$ and
 $Pe$ when
 $\phi =0.50$ in the BCC lattice.

To estimate the velocity scale without solving the mass transport equation, and fit the results of  ${\mathsf{D}}_{zz}^F$ as in figure 3(b), we introduce another characteristic velocity
 $U_z$ defined by the volume average of
 $u_z$:
 \begin{equation} U_z = \frac{\displaystyle\int\left|u_z\right|{\rm d}V}{V}. \end{equation}
The relationship between  $U_c$ and
 $U_z$ is shown in figure 14(a). There is a linear correlation between
 $U_c$ and
 $U_z$, which indicates that the velocity scale
 $U_c$ can be estimated simply by the volume average velocity
 $U_z$. Accordingly, as shown in figure 14(b), the flow-induced diffusion
 ${\mathsf{D}}_{zz}^F$ can be scaled as
 ${\mathsf{D}}_{zz}^F \propto U_z^2T_c$ regardless of
 $\beta$ and
 $\phi$, without introducing
 $U_c$.
Scaling of  $U_c$. (a) The trend between
 $U_c$ and
 $U_z$. Here,
 $U_c$ is averaged over
 $Pe$, and the results with different
 $\beta$ are plotted (small
 $|\beta |$ results in small
 $U_c$). Each error bar indicates the standard deviation. The line is fitted using the least squares method with slope 1. (b) The scaling of diffusivity in the orientation direction of squirmers using
 $U_z$.

4.4. Diffusivity
Finally, we attempted to scale  ${\mathsf{D}}_{zz}^F$ without using
 $T_c$ and
 $U_c$, instead using only the information of the flow field and Brownian diffusivity
 $D^B$. This treatment is important because it enables us to estimate
 ${\mathsf{D}}_{zz}^F$ without solving the mass transport equation.
From the definitions of velocity and time scales, the following relationship holds:  ${\mathsf{D}}_{zz}^F \propto U^2_c T_c$. By estimating
 $T_c \propto F^{-1}$ as discussed in § 4.2, and
 $U_c \propto U_z$ as discussed in § 4.3, the flow-induced diffusivity can be scaled as
 \begin{equation} {\mathsf{D}}_{zz}^F \propto \frac{\left(\displaystyle\int\left|u_z\right|{\rm d}V\right)^2}{\displaystyle cV\int\nolimits_{A_{u_z=0}}\left|u_n\right|{\rm d}A + cA_0V\sqrt{\dfrac{2Ua}{Pe\,{\rm d}t}}} \equiv \gamma. \end{equation}
Component  ${\mathsf{D}}_{zz}^F$ as a function of
 $\gamma$ with different
 $\beta$ and
 $\phi$ is shown in figure 15. The figure shows that the relationship is close to linear, but the slope is not exactly 1 (the best fit was seen with slope 1.27). The reduced accuracy in the analytical estimation of diffusion fluxes
 $f_B$ may be responsible for the discrepancy of the slope from 1. However, the diffusivity can be predicted roughly from the flow field and Brownian diffusivity of particles without solving the advection–diffusion equation for mass transport.
The scaling of diffusivity in the orientation direction of squirmers using  $U_z$ and
 $F$, i.e.
 $\gamma$ defined by (4.8). The line is fitted using the least squares method with slope
 $1$.

5. Conclusion
We evaluated diffusivity quantitatively in a packed lattice of squirmers by tracking passive particles within it. We investigated the effects of the volume fraction, Péclet number and lattice configuration on diffusivity. Even in the high- $Pe$ regime, the trajectories of particles became diffusive over a long duration due to Brownian diffusion. The direction of flow-induced diffusion depended on the squirmers’ orientations, and the diffusivity was enhanced over the Brownian diffusion regardless of the configuration of squirmers. In particular, when their orientation directions were aligned in the same direction, flow-induced diffusion was anisotropic and the diffusivity in the orientation direction of the squirmer could become 100 times larger than Brownian diffusivity in the high-
 $Pe$ regime. The present flow-induced diffusion did not follow
 $Pe$ dependency of the conventional Taylor dispersion due to cross-flows. The discrepancy was more significant with large
 $|\beta |$ conditions, because the intensity of the cross-flows increased with
 $|\beta |$. The time and velocity scales were proposed by averaging over the domain, which enabled us to predict the flow-induced diffusivity from the data of the flow field and Brownian diffusivity without solving the mass conservation equation. The results presented here can be utilised to improve our understanding of transport phenomena in packed suspensions of microorganisms, such as biofilms, gut flora and clustered cells, as well as providing insights into their colonisation and growth.
Funding
The authors acknowledge the support of JSPS KAKENHI (21H04999, 21H05308 and 23KJ0177) and JST PRESTO (JPMJPR2142).
Declaration of interests
The authors report no conflict of interest.
Appendix. Validation of the accuracy of the Lagrangian method
We quantified flow-induced diffusivity by tracking individual tracer particles in a Lagrangian manner, rather than representing a continuous concentration field and solving the advection–diffusion equation. In this appendix, we demonstrate the accuracy of the present method by quantifying the Brownian diffusivity in a lattice of inert spheres as a function of the spheres’ volume fraction. Figures 16(a,b,c) show the ratio of them to the Brownian diffusion coefficient, for the SC lattice, the BCC lattice and the FCC lattice, respectively. The plots are the results obtained by our present simulation, and solid lines indicate the analytical solutions (Blees & Leyte Reference Blees and Leyte1994). For all lattices, the present values and trends are in good agreement with the analytical solutions; the validity of the Lagrangian method is confirmed.
Comparison of the effective diffusivity between the present study and Blees & Leyte (Reference Blees and Leyte1994). The effective diffusivity is normalized by the Brownian diffusivity and obtained in cubic lattices of inert spheres: (a) the SC lattice, (b) the BCC lattice, and (c) the FCC lattice.