I. INTRODUCTION
In shock loading processes like high-speed crash or detonation shock, the failure of metals subjected to this extreme loading condition is a series of complex phenomena, and one of the predominant modes of failure in shock loading is dynamic tensile damage (spallation). Spallation damage occurs when the interaction of two release waves leads to tensile stresses in a metal in excess of the threshold required for damage initiation. It has been verified that the spall process is due to void nucleation, growth, and coalescence during tensile loading in ductile metals, ultimately resulting in the formation of a spall layer. Reference Antoun, Seaman, Curran, Kanel, Razorenov and Utkin1
Researches over the past decades have obtained ample experimental data concerning the influence of the shock stress, pulse duration, and microstructure on spallation response. Reference Sencer, Maloy, George and Gray2,Reference Yang, Peng, Chen, Guo, Tang, Hu and Zhang3 Gray Reference Gray, Bourne, Livescu, Trujillo, MacDonald and Withers4,Reference Gray, Hull, Livescu, Faulkner, Briggs and Cerreta5 investigated Ta using plate impact and sweeping detonation and demonstrated that the spall strength remains similar with different shock stresses under the same loading type, whereas a lower spall strength than that in plate impact loading was obtained in Ta when the loading condition changes into sweeping detonation-wave instead. Historically, the experimental quantifications of spallation evolution were limited to two-dimensional (2-D) metallographic level using conventional techniques like optical microscopy (OM) as well as electron back-scattered diffraction (EBSD). With the development of technology, the widespread usage of X-ray computer tomography (XRCT) into the investigation of spallation affords a direct way to visualize the distribution of spall damage. Reference Bingert, Henrie and Worthington6 Brian Reference Patterson, Escobedo, Koller and Cerreta7 studied the damage of primary spalled copper with XRCT and derived the critical number of voxels used for the quantification of voids to ensure an absolute error below 10%. Yang Reference Yang, Peng, Guo, Luo, Tang, Hu and Zhang8 and Qi Reference Qi, Bie, Zhao, Hu, Fan, Ran, Xiao, Yang, Li and Luo9 characterized the spall damage of soft-recovered plate Cu and Al with metallography and X-ray tomography, respectively. And their results indicated that the statistics in the metallurgical conditions have a certain difference of 10–15% with the quantitative damage characterized by XRCT. Recently, spalled copper samples with varying thermomechanical histories were investigated by Brown, Reference Brown, Wayne, Pham, Krishnan, Peralta, Luo, Patterson, Greenfileld, Byler, Mcclellan, Koskelo, Dickerson and Xiao10 and different shapes of voids were observed in the 3-D reconstruction map of different samples, which indicates the different types of damage.
However, in previous studies, XRCT was merely applied for the visualization of the spatial distribution of damage produced by the plant impact, and the 3-D quantitative study of characteristic damage parameters in a cylindrical copper sample was less studied. In this paper, the technology of Photon Doppler Velocimetry (PDV) and XRCT was united to investigate the damage evolution of spallation behavior in a copper cylinder under the complex compressive stress, and a detailed 3D quantification on different shapes of voids in cylindrical copper with different shock stresses was investigated.
II. EXPERIMENT PROCEDURES
A. Materials
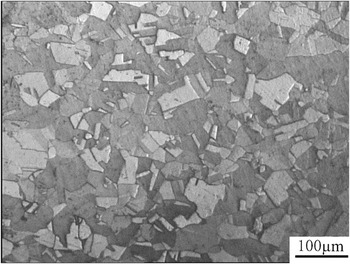
All samples studied in this investigation were prepared from 99.99% pure oxygen-free high-conductivity (OFHC) copper extruded bar with the original size of 40 × 82 mm. The original samples were annealed at 973 K (700 °C) for 1 h with water quench treatment to yield uniform microstructures (see Fig. 1), and then machined to obtain a hollow copper cylinder with the final size of Ф35.70 × 5.75 × 82 mm [Fig. 2(a)]. The result of the final metallographic characterization is shown in Fig. 1. The average grain size of the annealed samples is about 40 μm.
Optical micrograph of the sample before detonation.

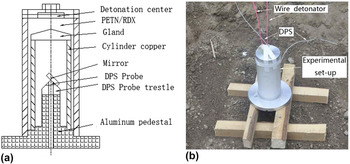
The sweeping detonation experimental configuration of cylindrical copper. (a) The schematic diagram. (b) The experimental set-up for sweeping detonation.

B. Sweeping detonation experiments
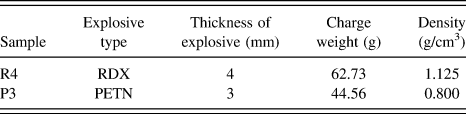
Dynamic shock experiments were performed via sweeping detonation (in Table I), whose testing was completed at China Academy of Engineering Physics (CAEP). An illustration of the experimental configuration for sweeping detonation is shown in Fig. 2(a). The powder explosive which has the thickness of 3 mm or 4 mm was filled in the outside copper cylinder. The explosive line was detonated at 20 kV in the detonation center which was next to the end of the copper cylinder. The sweeping detonation experiments were carried out in the sand to avoid the secondary damage that may occur when the shocked sample reaches the ground. To monitor the process of spall fracture, real-time-resolved free surface velocity profiles were measured with PDV and the measurement points were located in the center of the inner face of the cylinder samples [shown in Fig. 2(a)]. Figure 2(b) indicates the experimental set-up for sweeping detonation in this experiment.
Experimental parameters of the sweeping detonation experiments.

C. X-ray computer tomography
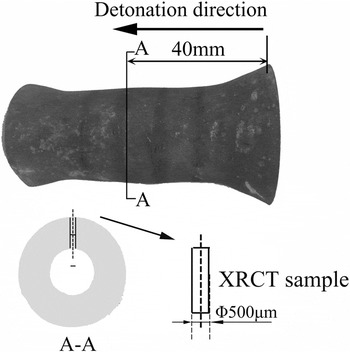
XRCT was used to investigate the distribution and characteristic parameters of spallation damage. Cylindrical samples with a diameter of Φ500 μm were extracted from the soft-recovered sample parallel to the radical direction (the detailed position of the observation sample is shown in Fig. 3). The high-resolution X-ray CT experiment was carried out at the Shanghai Synchrotron Radiation Facility (SSRF) using the X-ray imaging beam lines BL13W1. The beam line utilizes a monochromatic X-ray beam with a photon energy of 50 keV. A charge-coupled device (CCD) detector with a field of view of 2048 × 2048 pixels was used to capture radiographs. The CCD detector was positioned 10 mm away from the sample. The isotropic voxel size achieved a resolution of 0.65 × 0.65 × 0.65 μm3 in the reconstructed photo. The sample was scanned 180° with a rotation speed of 0.25° per 10 s during acquisition, and 720 radiographs were obtained in total.
Soft-recovered sample and position of the XRCT sample.

A back projection algorithm called Gidec algorithm was used to change the CT radiographs into the reconstruction of image slices using software named PITER, and the analysis of the reconstructed areas with various damage characteristics were executed with software called Amira 5.4, subsequently the reconstructions were separated into copper matrix and voids with the gray threshold algorithm followed with the watershed-segmentation algorithm (both of them were the algorithms for separation), and the 3-D reconstruction of void distribution was then eventually obtained. 11 The size of reconstructed volume in samples in this paper is 0.65 × 0.65 × 0.65 μm3. It has been reported that at least 80 voxels were needed to correctly measure the surface area of an object, ∼120 for the volume, and ∼1000 for the 3D Feret shape to maintain 10% or less absolute error. Reference Bingert, Henrie and Worthington6 In this paper, the pixel size is 0.65 μm, resulting in the voxel bulk of 0.275 μm3. To extract the voids for the quantitative analysis, a local threshold of volume was assigned and only those greater than 120 connected voxels (corresponding void volume 33 μm3) were selected.
The equivalent diameter for a sphere of equal volume, the sphericity, the elongation, and the flatness were defined as follows: Reference Toda, Oogo, Horikawa, Uesugi, Takeuchi, Suzuki, Nakazawa, Aoki and Kobayashi12,Reference Isaac, Sket, Reimers, Camin, Sauthoff and Pyzalla13
 $${\rm{Sphericity}},\;\;{S_{\rm{p}}} = \root 3 \of {{{36\pi {V^2}} \over A}} \quad ,$$
 $${\rm{Mean\ sphericity}},\;\;{\bar S_{\rm{p}}} = \left( {{1 \over {\sum\limits_{{\rm{c}} = 1}^{\rm{c}} {{V_{\rm{c}}}} }}} \right)\sum\limits_{{\rm{c}} = 1}^{\rm{c}} {{S_{{\rm{pc}}}}{V_{\rm{c}}}} \quad ,$$
 $${\rm{Elongation,}}\;\;{\rm{El\ }} = {{2B} \over {B + L}}\quad ,$$
 $${\rm{Flatness,}}\;\;{\rm{Fl}} = {T \over B}\quad ,$$
where V and A are the volume and surface area of voids; L, B, and T are the largest, the medium, and the minor ellipsoid semi-axes, respectively.
III. RESULTS AND DISCUSSION
A. Free surface velocity profiles
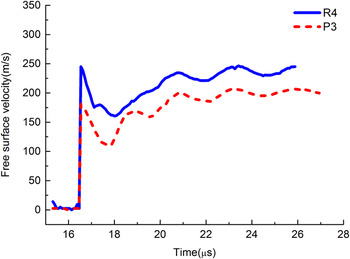
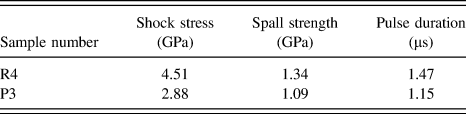
To probe the dynamic tensile properties of samples, the free surface velocity (FSV) histories for experiments reported herein are presented in Fig. 4. The times in the curve were shifted so that the drop from the peak state starts at the same time, a clear pullback signal can be identified on the velocity–time curves, and the wave profiles for the two experiments seem to vary as a function of the shock loading. The peak free surface velocities range from 150 to 250 m/s, corresponding to peak shock stresses of 2.88–4.51 GPa. These values were calculated as Reference Drennov and Mikhailov14
 $${\sigma _{\rm{s}}} = {\rho _0}\left( {{c_{\rm{b}}} + \lambda u} \right)u\quad ,$$
where σs is the shock stress (GPa), the density of copper ρ0 = 8.93 g/cm3, bulk sound speed c b = 3.94 mm/μs, λ = 1.49; using the approximation u = W/2, where u is half of peak velocity, the shock wave reaches the free surface and W is the corresponding peak free surface velocities.
Traces of the free surface velocity.

The spall strength may be expressed in terms of the free-surface velocity drop (pullback, or ΔFSV) as Reference Kanel15
 $${\sigma _{\rm{f}}} = {\rho _0}{c_{\rm{b}}}\Delta {\rm{FSV}}{\left( {1 + {{{c_{\rm{l}}}} \over {{c_{\rm{b}}}}}} \right)^{ - 1}}\quad ,$$
where σf is the spall strength (GPa), c l = 4.77 km/s is the longitudinal sound speed, and ΔFSV is the difference in free surface velocity from the peak state to the minimum (m/s). The measured and calculated key parameters are listed in Table II.
Experimental parameters obtained from the velocity traces.

B. 3-D perspective views of voids in spalled sample
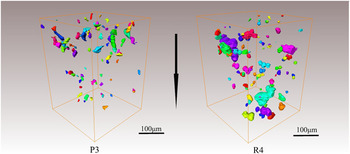
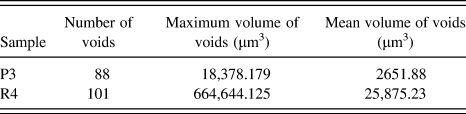
The effect of shock stresses on the spallation behavior was investigated using X-ray tomography; the 3-D spatial isosurface reconstructions of the spall region were obtained in each soft-recovered sample, respectively. Different locations of voids were symbolized with different colors, shown in Fig. 5. The shape and distribution of voids can be clearly seen from the figure. In sample P3, the voids were quite small and seldom coalesced; this means the nucleation and growth of voids occur in an independent and isolated manner under a lower shock stress. In the perspective views of R4, a similar distribution of voids can be found except for the large size of voids, and the growth and coalescence of voids have occurred. The quantification of the void size for the reconstruction maps above is plotted which is shown in the form of volume in Table III. To reduce the absolute error, the volumes less than 300 μm3 were ignored in this statistic. Comparing the quantification of voids in P3 with R4, the volume of voids increases with the increasing of shock stress, note that coalescence is likely the main contributor to the large increase in the void volume without a corresponding large increase in void numbers. From Table III, there was a noticeable change in volume as the maximum volume of void in R4 is 30 times than that was found in P3. The similar observation was illustrated by McDonald Reference McDonald, Cotton, Millett and Withers16 in Ta-W during shock loading using X-ray.
3-D reconstruction of voids’ distribution in spall samples P3 and R4. The direction of the arrow represents the shock direction.

The quantification of voids within the reconstructed sample.

The level of damage was induced to vary as a function of shock stress Reference Gray, Bourne, Livescu, Trujillo, MacDonald and Withers4 and pulse duration Reference McDonald, Cotton, Millett and Withers16 in different samples. On the one hand, the increase of shock stress increases the rate of growth and coalescence of voids; on the other hand, the pulse duration of samples P3 and R4 obtained in Fig. 4 is 1.15 and 1.47 μs, respectively. The increase of duration in R4 results in a longer process of voids’ nucleation, growth, and coalescence, and ultimately produces the huge difference in the volume of voids in different samples. The total void volume in R4 is ∼11 times than that in P3.
C. Quantitative analysis of voids in spallation zone
The observations of reconstruction figures shown above indicate that the level of spall damage varies as a function of peak shock stress. To assess the effect of shock stress on the shape of the void in the spalled zone, the quantitative analyses of characteristic parameters such as sphericity, elongation, and flatness of voids in spalled samples were carried out.
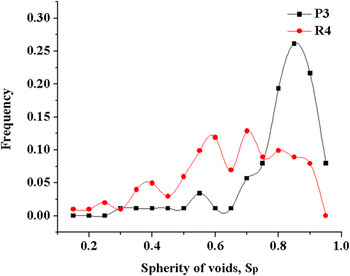
Sphericity (S p) is a measure of how spherical an object is. For the sphere, S p = 1. The sphericity of voids in spalled samples with different shock stresses is shown in Fig. 6. In sample P3, most voids have S p ranging from 0.6 to 1.0 and in sample R4, S p is low, the lower sphericity data of R4 show that the voids are far from spherical. Comparing the tendencies illustrated from Fig. 6, it was found that S p of voids decreases with the increasing of shock stress.
Distribution of voids’ spherity in samples P3 and R4, respectively.

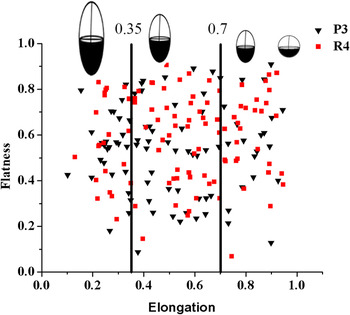
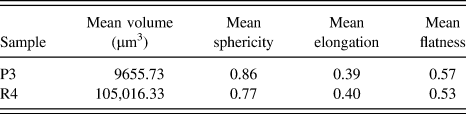
For a detailed description of voids in the spatial shape and orientation, the parameters ‘elongation’ and ‘flatness’ were used to quantify the typical shape of voids. Elongation and flatness provide a quantitative approach to evaluate the evolution of voids and classify the voids into the typical cavity shapes as spheres, ellipsoids, and rods. The ‘elongation’ and ‘flatness’ values are obviously 1.0 when it comes to the spherical void. To limit the statistical error, a scatter of 30% of these parameters was allowed for the definition of sphere, Reference Brown, Wayne, Pham, Krishnan, Peralta, Luo, Patterson, Greenfileld, Byler, Mcclellan, Koskelo, Dickerson and Xiao10 the voids with the ‘elongation’ range from 0.35 to 0.7 shall be defined as ellipsoidal, and the elongated void which has an ‘elongation’ less than 0.35 will be considered as a rod. The relationship between shape descriptors flatness–elongation and the shape of voids is shown in Fig. 7, and similar distribution patterns of the characteristic parameters flatness and elongation were obtained in samples under different shock stresses. In samples P3 and R4, most voids hold the value of elongation El > 0.35, this means most voids were in the shape of sphere or ellipsoid, meanwhile, some rod voids (El < 0.35) existed in P3 and R4 too. In a previous investigation of plate copper under sweeping detonation, Reference Patterson, Escobedo, Koller and Cerreta7 the voids were all in the shape of spheres or ellipsoids and no rods in the spalled copper with a similar shock stress of 2.90 GPa were obtained. Therefore, the calculated values of the void shape for the biggest 10 voids in samples were characterized, shown in Table IV. A clear discrepancy on the mean volume of voids in samples can be found from the statistics, while the similar lower mean elongation value and lower mean flatness illustrated that the rod voids existed in both sample P3 and R4. Namely, the big voids existed in spalled samples in the shape of rod.
Relationship between shape descriptors ‘flatness’ and ‘elongation’ and the shape of voids in samples PA3 and R4.

The characteristic parameters of shape for the biggest 10 voids in samples.

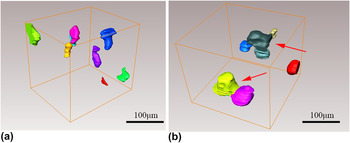
The rod voids observed in both samples P3 and R4 illustrate the different growth types of voids with the effect of shock stress. In sample P3, the voids in the spallation zone remain independent and isolated under a lower shock stress, and seldom coalescence of voids occurred, shown in Fig. 8(a). It had been affirmed that damage is prone to nucleate at grain boundaries (GBs) in polycrystalline copper. Reference Wayne, Krishnan, Digiacomo, Kovvali, Peralta, Luo, Greenfield, Byler, Paisley, McClellan, Koskelo and Dickerson17 So the rod voids observed in P3 may be the result of growth of voids independently along the GBs. During the sweeping detonation, voids were preferentially nucleated at GBs; simultaneously the curvature of the cylindrical sample induced an inhomogeneous stress state which may cause voids’ grown anisotropy toward the site of stress concentration, resulting in the formation of rod voids. However, in sample R4, the growth that dominated occurred due to the higher shock stress and the longer pulse duration, and the coalescence of growth voids may arise when the distance of voids is below the threshold, leading to the rod voids eventually, and the coalesced rod void can be seen in Fig. 8(b).
The rod shaped voids can be observed in the partial 3-D reconstruction map of samples P3 and R4; (a) P3, (b) R4, the coalesced rod void was indicated as red arrows.

The shape of voids in sample P3 is different from that found in plate spalled copper under sweeping detonation (Tyler wave) with a similar shock stress of 2.88 GPa Reference Yang, Peng, Guo, Luo, Tang, Hu and Zhang8 ; the difference may arise from the geometry of the cylindrical sample. The spall damage occurred when a region of tension in the interior of the sample is caused by the reflection of the shock wave from the inner surface. The strain and the stress of plate and cylindrical shock loading can be expressed as follows if the obliquity of the shock wave for 1-D supported shock wave loading in the plate is ignored. The expressions are
 $$\left\{ {\matrix{ {{\varepsilon _{\rm{y}}} = {\varepsilon _{\rm{z}}} = 0} \cr {{{{\sigma _{\rm{x}}}} \over {{\sigma _{\rm{y}}}}} = {{{\sigma _{\rm{x}}}} \over {{\sigma _{\rm{z}}}}} = {{1 - \nu } \over \nu }} \cr} } \right.\quad ,$$
where x is the shock direction, ε is strain, σ is shock stress, and ν is Poisson’s ratio.
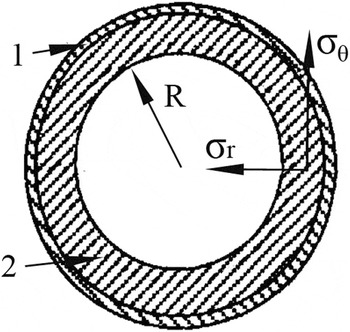
The stress configuration of a cylindrical sample under shock loading is shown in Fig. 9, and the expressions of strain and shock stress in the cylinder sample during spallation are Reference Zhang, Liu, Li and Liu18
 $$\left\{ {\matrix{ {{\varepsilon _{\rm{\theta }}} = {{{V_{\rm{r}}}\Delta t} \over R} = {{{V_r} \times 2\delta } \over {{C_{\rm{l}}}R}}} \cr {{{{\sigma _{\rm{r}}}} \over {{\sigma _{\rm{\theta }}}}} = {{1 - \nu } \over {\nu \,+\, {{2\delta } \over R}{{\left( {1 + \nu } \right)\left( {1 - 2\nu } \right)} \over {1 - \nu }}}}} \cr} } \right.\quad ,$$
where εθ is circumferential strain, V r is radial velocity, Δt is the oscillator period of the shock wave after spallation, δ is spall thickness, R is the radius of the spall plane, and σθ and σr were circumferential stress and radial stress, respectively.
The stress configuration of the cylindrical sample under shock loading. 1. Explosive; 2. cylinder.

In plane shock loading, it can be observed that the strain normal to the shock direction is zero. However, in cylindrical samples, the circumference was in compression (σθ > 0) when the shock wave propagated to the inner surface, and the circumference may remain with compression when the incident wave changes from a compression to a rarefaction wave. During the sweeping detonation, circumferential compressions exist in the cylinder samples, corresponding to a pre-strain imposed on the sample. The voids are prone to nucleate at the sites of stress concentration. In tension areas of the cylindrical sample during sweeping detonation, an extra circumferential strain can be found in the spalled area except for the dynamic tension, causing a complex stress state with stress concentration occurring more easily, and the voids may grow along the principle axis of the stress, forming rod voids. However, in the plate sample, the one-dimensional isotropic kinetics cause the voids to tend to grow as octahedron and become spherical shaped voids finally.
IV. CONCLUSION
The effect of the peak shock stress on the spallation damage in the copper cylinder under sweeping detonation was presented. The free surface velocity curve was measured by the Doppler Pin System (DPS) and the quantitative investigation of voids in the spalled sample was carried out using XRCT. The main findings are the following:
-
(1) The damage degree increased with increasing shock stress in the spallation zone, the mean volume of voids in R4 is 10 times more than that in P3. The increase of shock stress and pulse duration that promotes the growth and coalescence of voids is the main reason.
-
(2) The sphericity of voids decreases with the increasing of shock stress, and the rod shaped voids existed in the spallation zone of samples P3 and R4. The rod voids observed in P3 may be the result of the independent growth of voids along the GBs; while the coalescence of voids were increased due to the higher stress in sample R4, and the coalesced voids formed the shape of rod.
-
(3) The shape of voids in the spalled cylindrical sample P3 is different from that in the spalled plate copper which was illustrated before under sweeping detonation with similar shock stresses of 2.88 GPa; in P3 sample the rod shaped voids can be found in the reconstruction map of the spallation zone, while in the plate sample all the voids were in the shape of spheres or ellipsoids. The effect of geometry of spalled samples on the stress state in the spallation zone is the main reason.
ACKNOWLEDGMENTS
This work was supported by the NSAF (No. U1330126), the National Natural Science Foundation of China (No. 51274245, No. 51574290), the PhD. Programs Foundation of Ministry of Education of China (No. 20120162130006), the Hunan Provincial Natural Science Foundation of China (No. 14JJ2011), and the Key Project of State Key Laboratory of Explosion Science and Technology (No. KFJJ11-1).