

There may be no more vexing question in the minds of many today than why some people support Donald Trump while others do not. Individuals on both sides of the attitudinal divide express bewilderment, wondering what could cause their counterparts to fail to recognize Trump’s obvious merits or demerits. Politics is, of course, inherently divisive, concerning as it does the management of competing interests. But, in the case of Trump, the source of the division has attracted an unusual amount of scholarly interest. Many studies have examined the psychological characteristics of Trump’s supporters or detractors (e.g., Buyuker et al., Reference Buyuker, D’Urso, Filindra and Kaplan2021; Geiger & Reny, Reference Geiger and Reny2024; Goldsmith & Moen, Reference Goldsmith and Moen2025). The overarching hypothesis has been that Trump’s personality and the discursive elements of his communications may either strongly attract or strongly repel members of the electorate depending on psychological variables. This hypothesis immediately extends the importance of studying Trump’s appeal (or lack thereof) beyond Trump himself. Given Trump’s considerable influence and electoral success, other aspiring leaders in a post-Trump electoral landscape may attempt to mimic his personality and rhetoric.
One psychological variable that has been extensively studied as a potential determinant of Trump support/opposition is authoritarianism (Adorno et al., Reference Adorno, Frenkel-Brunswik, Levinson and Sanford1950) and, more specifically, right-wing authoritarianism (RWA). RWA is a multidimensional construct characterized by submission to established authorities, conventional thinking, and punitiveness toward groups or individuals seen as challenging either authority or conventionalism (Altemeyer, Reference Altemeyer1996). American presidential candidates have utilized authoritarianism as a discursive frame since at least the 1950s, but Trump’s usage in 2016 and 2020 was far higher than any previous candidate (Bonikowski et al., Reference Bonikowski, Luo and Stuhler2022; see also Baptist & Clark, Reference Baptist and Clark2024). Some have argued that Trump’s authoritarian rhetoric, and by extension the rhetoric of future candidates who may use similar language, uniquely appeals to individuals who are high in RWA, securing votes and other forms of support (Burston, Reference Burston2017; Hetherington & Weiler, Reference Hetherington and Weiler2018; MacWilliams, Reference MacWilliams2016; Stenner & Haidt, Reference Stenner, Haidt and Sunstein2018).
The study of RWA in relation to Trump support has unquestionably proven fruitful, as our review of the literature below will show, but at the same time, it leaves unexplained why some individuals are high in RWA in the first place. In addition, a simple RWA drives Trump support model ignores evidence that RWA is correlated with Trump support primarily for White voters and much less so, or not at all, for non-White voters (Liu et al., Reference Liu, Stickney and Batt2020; for similar findings regarding support for the MAGA agenda more broadly, see Wolf et al., Reference Wolf, Kim, Brisbane and Junn2025). To answer the call for a better understanding of why some people choose to follow contemporary leaders who employ authoritarian rhetoric (Harms et al., Reference Harms, Wood, Landay, Lester and Lester2018; Helms, Reference Helms2025), we must delve deeper into the origins and consequences of RWA.
In the present research, launched before Trump’s first electoral victory, we were interested in the neuro- and social-cognitive bases of Trump support. Specifically, we were interested in how neurocognitive factors might give rise to RWA and how the effect of RWA on Trump support might be filtered through the lens of race-based social cognition. To our knowledge, no one has previously studied Trump support from an integrated neuro- and social-cognitive perspective. The importance of our work, as we saw it, rested less on understanding Trump qua Trump and more on understanding him as an exemplar of the type of politician who makes muscular use of authoritarian rhetoric—a relative rarity in modern U.S. history (Bonikowski et al., Reference Bonikowski, Luo and Stuhler2022), but conceivably more common in the future.
Let us first review key findings from the literature on RWA’s relationship with Trump support, highlighting both the compelling evidence that RWA is associated with Trump support and the reasons to question a simple RWA drives Trump support model.
In an influential early study, MacWilliams (Reference MacWilliams2016) surveyed likely Republican primary voters in late 2015. More authoritarian respondents, as measured by the American National Election Studies (ANES) childrearing items, were more likely to name Donald Trump as their top choice for the Republican nomination. Subsequently, Choma and Hanoch (Reference Choma and Hanoch2017) found that more authoritarian individuals, as measured by Altemeyer’s (Reference Altemeyer1996) Right-Wing Authoritarianism Scale, had more favorable attitudes about Trump and expressed greater intention to vote for him should he become the 2016 Republican nominee.Footnote 1 This was true regardless of political party identification, extending MacWilliams’ (2016) finding, which had applied only to Republican voters. Knuckey and Hassan (Reference Knuckey and Hassan2022) then used ANES data to examine White Americans’ vote choice in the 2016 presidential general election, as well as the preceding five elections. Authoritarianism, as measured by the childrearing items, robustly predicted vote choice for Donald Trump over Hillary Clinton. The effect of authoritarianism was stronger in 2016 than in the preceding elections. The effect was again independent of political party identification and was also found to be independent of liberal/conservative ideology. After the 2016 election, in the early years of Trump’s first term, Dunwoody and Plane (Reference Dunwoody and Plane2019) found that individuals who scored higher on the Aggression-Submission-Conventionalism measure of authoritarianism (Dunwoody & Funke, Reference Dunwoody and Funke2016) were more approving of Trump’s job performance.
Findings such as those reviewed above make an impressive case for an association between RWA and Trump support, but other studies call into question the simplistic notion that RWA drives Trump support. A study by Lutting (Reference Lutting2021) suggested that Trump’s rhetoric over the course of the 2016 election increased authoritarianism among those already partial to him, compelling us to consider whether RWA drives Trump support or Trump support drives RWA. Another study, by Liu et al. (Reference Liu, Stickney and Batt2020), found that the relationship between authoritarianism and electoral support for Trump in the 2016 general election depended on race. Among White voters, and to a lesser extent Asian voters, RWA was a positive predictor of voting for Trump, but there was no discernible relationship among Black respondents, and, among Hispanic respondents, the relationship was reversed, such that more authoritarian Hispanics were less likely to vote for Trump. Liu et al., although accepting the idea that RWA drives Trump support for some individuals, rejected the notion that it does so for all individuals and argued that racial identity is a critical differentiator.
An earlier study by Dusso (Reference Dusso2017) supports the argument that racial identity can moderate the relationship between RWA and political candidate choice. In that study, which focused on the 2012 presidential election, RWA was not related to White individuals’ voice choice. For Black individuals, however, RWA was positively associated with voting for Barack Obama and hence against Mitt Romney. Dusso’s interpretation was that, in Black voters’ sociopolitical context, Black candidates are more legitimate, or rightful, authority figures than White candidates. Consequently, high levels of authoritarian submission inclined Black voters to choose Obama over Romney. Applying this idea to the question of Trump support, it suggests that RWA might cause non-White voters to choose away from Trump in a contest in which he was opposed by a non-White candidate, as was the case in 2024.
Next, we describe research implicating neurocognitive factors in the emergence of RWA. These same factors, we will argue, may also play a role in the emergence of Trump support.
Evidence for neurocognitive influences on RWA comes from a surprising source: the study of human handedness. Handedness is the ubiquitous phenomenon whereby humans favor one hand over the other when performing manual tasks (Papadatou-Pastou et al., Reference Papadatou-Pastou, Ntolka, Schmitz, Martin, Munafò, Ocklenburg and Paracchini2020). Although most people realize that the direction of hand preference differs between individuals, with most people favoring the right and only a small minority favoring the left, it is another distinction that matters when it comes to the study of RWA (and many other personality and cognitive variables; Prichard et al., Reference Prichard, Propper and Christman2013). Some people use the preferred hand almost to the exclusion of the non-preferred hand, whereas other people make considerable use of the non-preferred hand. These two groups have been dubbed consistent- and inconsistent-handers, respectively, in reference to the consistency of their preference (Lyle et al., Reference Lyle, Hanaver-Torrez, Hackländer and Edlin2012, Reference Lyle, Chapman and Hatton2013). Differences between these groups extend far beyond handedness behavior, encompassing brain structure and function, cognition, and RWA.
First consider neuroscientific differences. Compared to inconsistent-handers (ICH), consistent-handers (CH) exhibit more pronounced interhemispheric structural asymmetries (McDowell et al., Reference McDowell, Felton, Vazquez and Chiarello2016), greater interhemispheric alpha band asymmetries (Ocklenburg et al., Reference Ocklenburg, Friedrich, Schmitz, Schlüter, Genc, Güntürkün, Peterburs and Grimshaw2019), more asymmetric interhemispheric transfer times (Bernard et al., Reference Bernard, Taylor and Seidler2011), and poorer interhemispheric coordination (Lyle & Martin, Reference Lyle and Martin2010).
Cognitively, CH are less flexible than ICH (Sontam & Christman, Reference Sontam and Christman2012). CH exhibit lower levels of divergent creativity (Shobe et al., Reference Shobe, Ross and Fleck2009), counterfactual thinking (Jasper et al., Reference Jasper, Barry and Christman2008), and insight problem solving (Jendrol & Špajdel, Reference Jendrol and Špajdel2022), and even respond less flexibly to marketing displays (Barone et al., Reference Barone, Lyle and Winterich2015). In addition, CH are less persuadable (Christman et al., Reference Christman, Henning, Geers, Propper and Niebauer2008), more likely to ruminate (Bahari & Hasani, Reference Bahari and Hasani2023; Niebauer, Reference Niebauer2004), and report greater need for closure, that is, desire for definite, immutable knowledge (Lyle & Grillo, Reference Lyle and Grillo2020). Cognitive rigidity, it should be noted, is strongly associated with RWA (Costello et al., Reference Costello, Bowes, Stevens, Waldman, Tasimi and Lilienfeld2022; Rokeach, Reference Rokeach1960), and need for closure has been conceptualized as a key antecedent to RWA (De keersmaecker et al., Reference De keersmaecker, Roets, Dhont, Van Assche, Onraet and Van Hiel2017; Dhont et al., Reference Dhont, Roets and Van Hiel2013; Roets & Van Hiel, Reference Roets and Van Hiel2011; Van Hiel et al., Reference Van Hiel, Pandalaere and Duriez2004).
As their cognitive profile would lead one to expect, CH are more authoritarian than ICH. They score higher on the Right-Wing Authoritarianism Scale (Chan, Reference Chan2018; Christman, Reference Christman2014) and on the childrearing items from the American National Election Studies, a common measure of the submission component of RWA (Grillo et al., Reference Grillo, Pupcenoks and Lyle2018; Lyle & Grillo, Reference Lyle and Grillo2014, Reference Lyle and Grillo2020). Further bolstering their RWA profile, CH were found to have less positive attitudes about authoritarian outgroups (Lyle & Grillo, Reference Lyle and Grillo2014, Reference Lyle and Grillo2020) and to be more punitive when a member of an outgroup was accused of wrongdoing (Grillo et al., Reference Grillo, Pupcenoks and Lyle2018). Note, though, that CH have not been found to describe themselves as more conservative than ICH (Grillo et al., Reference Grillo, Pupcenoks and Lyle2018; Lyle & Grillo, Reference Lyle and Grillo2014), suggesting that the linkage between consistent handedness and RWA is independent of people’s self-perception of their political ideology.
Consistent with a neurocognitive model of ideological thinking (Zmigrod, Reference Zmigrod2021), and a political neuroscience perspective more broadly (Haas, Reference Haas, Abscher and Cloutier2016), handedness researchers have explained CH’s tendency toward RWA in terms of their neurocognitive characteristics. The prevailing framework has been that consistency is a marker for strength of interhemispheric coordination: CH are presumed to have weaker coordination than ICH (Jasper et al., Reference Jasper, Christman and Clarkson2021; Lyle et al., Reference Lyle, McCabe and Roediger2008; Lyle & Martin, Reference Lyle and Martin2010; Prichard et al., Reference Prichard, Clarkson and Christman2024). Some forms of cognition rely heavily on processing within one hemisphere, such as certain perceptual or unilateral motor tasks. Others, such as integrative judgments, memory retrieval, and belief revision, require coordinated interaction between the hemispheres to merge complementary processes into a coherent outcome. In those latter cases, weaker interhemispheric coordination (as posited for CH) imposes a disadvantage, reducing the accuracy and flexibility of cognition.
Lyle and Grillo (Reference Lyle and Grillo2020) proposed that CH tend toward RWA because they are poorer at the interhemispheric process of belief updating. Current beliefs are evaluated in the right lateral prefrontal cortex (Coltheart, Reference Coltheart2010) and, when discrepancy or counterevidence is detected, the right hemisphere signals a need to update one’s beliefs (Ramachandran, Reference Ramachandran1995). It is the left hemisphere, however, which ultimately articulates revised beliefs, thereby necessitating interhemispheric coordination (Devinsky, Reference Devinsky2009; Gazzaniga, Reference Gazzaniga1998, Reference Gazzaniga2000). Because CH have a relative deficit in coordination, and hence updating, they struggle to accommodate discrepant information, making them more reliant on previously established knowledge and more uncomfortable with informational diversity. They become receptive to authoritarian ideologies, which prioritize epistemic stability through devotion to tradition, and which discourage dissent and pluralism.
If RWA is a driver of Trump support, then CH should support Trump more than ICH. A study by Prichard and Christman (Reference Prichard and Christman2020) provides preliminary support. In that study, participants who self-identified as conservative were asked to reflect on their attitude toward Trump during the 2016 primary (data were collected in 2018). Consistent handedness (vs. inconsistent) was associated with greater recollected Trump approval, as well as higher scores on a measure of RWA. Limitations of this study include that approval ratings were made retrospectively, only a single attitudinal measure was collected, and the relationship between handedness and Trump support was not examined for liberals or as a function of race, rendering it silent on the possibility of race-based social-cognitive factors. Nonetheless, the results establish the feasibility of a pathway from the neurocognitive characteristics of CH to elevated levels of RWA and finally to support for Donald Trump.
Establishing a relationship between consistent handedness and Trump support would represent an advance in the field of biopolitical research. Prior studies in the field have tended to focus on differences between liberals and conservatives (e.g., Ahn et al., Reference Ahn, Kishida, Gu, Lohrenz, Harvey, Alford, Smith, Yaffe, Hibbing, Dayan and Montague2014; Amodio et al., Reference Amodio, Jost, Master and Yee2007; Hibbing et al., Reference Hibbing, Smith and Alford2014; Kanai et al., Reference Kanai, Feilden, Firth and Rees2011; for a cautious review, see Smith & Warren, Reference Smith and Warren2020). In that same vein, and specific to the study of handedness, McCann (Reference McCann2019, Reference McCann2024) found that U.S. states with higher population-level rates of left-handedness have been, for decades, more liberal and more likely to support Democratic presidential candidates (see also Christman & Prichard, Reference Christman and Prichard2023). Although undoubtedly interesting, that research does not speak to biological factors that might shape support for a specific political figure irrespective of political ideology.
We do not believe that a strict biopolitical approach to understanding Trump support is sufficient, however. We believe race-based social-cognitive factors should also be considered. We conceptualize race as a socially constructed identity category that carries shared historical, cultural, and political meanings (Omi & Winant, Reference Omi and Winant1994), rather than as a biological classification (Lewontin, Reference Lewontin, Dobzhansky, Hecht and Steere1972). Our theoretical interest in race concerns its role in shaping social cognition, including perceptions of group membership, threat, representation, and alignment with political actors and institutions. In showing that RWA positively predicted 2016 vote choice for Donald Trump primarily among White Americans, Liu et al. (Reference Liu, Stickney and Batt2020) theorized that non-White authoritarians reject Trump based on his membership in a racial outgroup. White authoritarians, in contrast, may embrace Trump based on shared racial prejudices (Smith & Hanley, Reference Smith and Hanley2018). When filtered through a racial lens, we might expect a shared set of neurocognitive characteristics, common to CH regardless of race, to have divergent effects on Trump support: increasing it for White individuals but decreasing it for non-White individuals. Any observed interactions between race and handedness would be interpreted as reflecting differences in social meaning-making in a political context, not differences in neurobiology across racial groups.
To explore neuro- and social-cognitive influences on Trump support, we conducted a quasi-experimental cross-sectional study, surveying multiple independent cohorts of racially diverse CH and ICH across eight years, spanning all three elections in which Trump stood as the Republican candidate for U.S. president. During each election cycle, we administered online surveys at three timepoints: shortly before Election Day, shortly after the winner was announced, and shortly after Inauguration Day (see Figure 1). At each timepoint, we measured handedness and multiple variables related to political cognition and Trump support. Among these variables were authoritarian submission (using the ANES childrearing items), current attitude about Donald Trump (using a feeling thermometer), identification with the Republican Party, attitudes about various authoritarian outgroups (using feeling thermometers), and need for closure. Many variables were measured in all three elections, but some were added in later elections. Notably, we had participants in the 2024 election cycle report their voting behavior in the current election, as well as the previous two, allowing us to relate handedness to political behavior. By sampling across election cycles and at different time points within cycles, we could examine the stability of handedness effects as Trump’s political fortunes rose or fell, as he faced different opponents, and as he became intertwined in a multitude of dramatic national and global events over the course of eight years.
Study timeline.

Figure 1. Long description
The timeline is organized into three main clusters corresponding to the years 2016, 2020, and 2024. Each cluster contains specific markers for an Election and an Inauguration.
* 2016 Cluster
- Pre-Election period ends at a circular marker.
- Election Nov. 8, 2016 is marked by a square.
- Post-Election period is between the election and a circular marker.
- Inauguration Jan. 20, 2017 is marked by a square.
- Post-Inauguration period follows a circular marker.
* 2020 Cluster
- Pre-Election period ends at a circular marker.
- Election Nov. 3, 2020 is marked by a square.
- Post-Election period is between the election and a circular marker.
- Inauguration Jan. 20, 2021 is marked by a square.
- Post-Inauguration period follows a circular marker.
* 2024 Cluster
- Pre-Election period ends at a circular marker.
- Election Nov. 5, 2024 is marked by a square.
- Post-Election period is between the election and a circular marker.
- Inauguration Jan. 20, 2025 is marked by a square.
- Post-Inauguration period follows a final circular marker.
Method
Participants
For the 2016 and 2020 election cycles, participants were recruited from the undergraduate population of a Midwestern public university. Participants received course credit for participating. Only participants who answered all survey questions were included in the analyses reported here. The lone exception was that we retained participants if they skipped a single item on the Need for Closure scale, provided they had no other missing data. Because the scale has 33 items, scores do not depend greatly on a single response. We imputed the missing response with the average of the participant’s handedness group. Imputation was performed for 54 participants in 2016 (10% of the retained sample) and 31 participants in 2020 (7.8% of the retained sample). Participants were also excluded if they gave the same response to all feeling thermometers. Finally, we limited analyses to individuals 18–39 years old. Only a small number of participants (N = 5) in our undergraduate samples were older than 39. The total number of participants excluded for any reason was 65 in 2016 and 48 in 2020.
The 2016 and 2020 samples, being drawn from the same university population, were similar in age, gender, and race. The average age was 20.0 (SD = 2.5) in 2016 vs. 19.9 (SD = 2.4) in 2020. The percentage of participants identifying as female (vs. male) was 71.3% in 2016 versus 76.8% in 2020. The percentage of participants identifying as White was 76.5% in 2016 versus 69.3% in 2020.
For the 2024 election cycle, participants were recruited from Prolific and paid $2. The criteria for participation were being a U.S. resident and being 18–39 years old (matching the age range of retained participants in the 2016 and 2020 cycles). There were no cases of missing data or responding uniformly to feeling thermometers. We embedded two attention checks in the survey and excluded participants who failed either one (N = 8). Compared to our undergraduate samples, the members of the Prolific sample were about a decade older (M = 30.8, SD = 5.6) and far fewer identified as female (49.6%). Similar to our undergraduate samples, however, monoracial White was the predominant racial identification (67.2%).
Numbers of retained participants, broken down by election cycle, race, and handedness, are shown in Table 1.
Numbers of retained participants

Table 1. Long description
The table is organized with Race as the first column and Election years as the primary header. Each election year (2016, 2020, and 2024) is subdivided into two categories: I C H and C H.
Row 1: Non-White participants.
- 2016: I C H 42, C H 85.
- 2020: I C H 29, C H 94.
- 2024: I C H 89, C H 134.
Row 2: White participants.
- 2016: I C H 145, C H 269.
- 2020: I C H 94, C H 184.
- 2024: I C H 172, C H 285.
Row 3: Total participants.
- 2016: I C H 187, C H 354.
- 2020: I C H 123, C H 278.
- 2024: I C H 261, C H 419.
Survey questions
Where not otherwise indicated, the reader may assume a given measure was administered in an identical manner across the three election cycles.
Age
Participants reported their age in years.
Gender
In 2016 and 2020, participants indicated their gender by selecting female or male. In 2024, the response options were female, male, nonbinary, or prefer not to say.
Race
Participants indicated their race using the same categories as on the ANES (American Indian or Alaska Native, Asian, Black or African American, Native Hawaiian or Pacific Islander, White). In 2016 and 2020, participants could select only a single category. In 2024, they could select multiple.
Religiosity
As in previous studies (Lyle & Grillo, Reference Lyle and Grillo2014, Reference Lyle and Grillo2020), we measured religiosity with three questions about behavior (attending religious services, praying, reading major texts of a faith). Details can be found in Lyle and Grillo (Reference Lyle and Grillo2014). Responses were summed, yielding scores ranging from 3–19, with higher scores indicating greater religiosity. Cronbach’s alpha was .86 in 2016, .85 in 2020, and .91 in 2024.
Handedness
Handedness was measured using a modified version of the Edinburgh Handedness Inventory (Oldfield, Reference Oldfield1971). This version, described fully elsewhere (Lyle et al., Reference Lyle, McCabe and Roediger2008), is one of many (Edlin et al., Reference Edlin, Leppanen, Fain, Hackländer, Hanaver-Torrez and Lyle2015), but has been extensively used in the literature linking handedness to political cognition (Christman, Reference Christman2014; Grillo et al., Reference Grillo, Pupcenoks and Lyle2018; Lyle & Grillo, Reference Lyle and Grillo2014, Reference Lyle and Grillo2020; Prichard & Christman, Reference Prichard and Christman2020). The inventory comprises ten manual activities (e.g., writing, scissors, toothbrush). For each activity, respondents report which hand they use by choosing from one of five options (Always Left, Usually Left, No Preference, Usually Right, Always Right). Total scores range from −100 to +100. Cronbach’s alpha was .95 in all three election cycles. Individuals are classified as CH if the absolute value of their score is 80 or above. All others are classified as ICH. Originally, this classification system was adopted because 80 is a common median score, but subsequently the system has been validated behaviorally (Leppanen et al., Reference Leppanen, Lyle, Edlin and Schäfke2019).
Political ideology
Participants reported their political ideology on a scale ranging from 1 (Extremely Liberal) to 7 (Extremely Conservative).
Political partisanship
In 2016 and 2020, participants were asked to report the political party they most identified with from the following choices: Democrat, Green, Libertarian, Republican, Other. In 2024, this question was changed to, “Which of the following best describes how you identify with the two major political parties in the U.S.?” The choices were Democrat, Lean Democrat, Independent, Lean Republican, and Republican.
Authoritarian submission
As in the ANES, participants were shown four pairs of attributes and asked to select the one in each pair they thought was more important for a child to have. The pairs, with the more authoritarian attribute listed second, were: independent versus respectful of their elders, self-reliant versus obedient, curiosity versus good manners, being considerate versus being well-behaved. Note that, unlike in the ANES, but like in our prior research (Grillo et al., Reference Grillo, Pupcenoks and Lyle2018; Lyle & Grillo, Reference Lyle and Grillo2014, Reference Lyle and Grillo2020; see also, MacWilliams, Reference MacWilliams2016), participants did not have the option to select both. Scores represent the number of authoritarian attributes chosen (0–4). Cronbach’s alpha was .49 in 2016, .54 in 2020, and .76 in 2024. Alpha for this short measure is rarely high. For example, it was .60 in MacWilliams (Reference MacWilliams2016) and .62 in Dunwoody and Funke (Reference Dunwoody and Funke2016). For our entire sample, collapsed across elections, alpha was .57, which is close to values obtained previously.
Feeling thermometers
In each election cycle, participants were presented with a list of people, groups, institutions, or ideologies. Participants were told to rate each on a 0 to 100 scale, with higher numbers indicating greater warmth and favorability. The following list was administered in 2016 and 2020: Donald Trump, conservatives, liberals, Congress, Christian fundamentalists, immigrants, Muslims, homosexuals, Mexicans, atheists. The list also included Trump’s Democratic opponent: Hillary Clinton in 2016 and Joe Biden in 2020. The list administered in 2020 comprised: Donald Trump, Kamala Harris, MAGA, wokeism, evangelical Christians, January 6 protesters, migrants, Muslims, transgender persons, feminists, atheists.
Need for cognitive closure
Participants completed the revised Need for Closure scale developed by Roets and Van Hiel (Reference Roets and Van Hiel2007) following original work by Webster and Kruglanski (Reference Webster and Kruglanski1994). The questionnaire comprises five subscales (Need for Order, Need for Predictability, Decisiveness, Intolerance of Ambiguity, and Closed-Mindedness) but one of these (Closed-Mindedness) appears to have poor psychometric properties (Hussey & Hughes, Reference Hussey and Hughes2020; Neuberg et al., Reference Neuberg, Judice and West1997; Roets & Van Hiel, Reference Roets and Van Hiel2007). At the outset of this research, we had decided that we would calculate need for closure scores based only on the four relatively sound subscales (totaling 33 items), as previously done in Lyle and Grillo (Reference Lyle and Grillo2020). Nonetheless, in 2016 and 2020, we administered the entire questionnaire. In 2024, to reduce survey completion time, we omitted items pertaining to Closed-Mindedness. Items were rated on a 6-point scale. Cronbach’s alpha was .87 in 2016, .86 in 2020, and .90 in 2024.
Voting behavior
In 2024, participants were asked about their voting behavior in the 2016, 2020, and 2024 presidential elections. For each election, they were shown the Republican and Democratic candidates, as well as the Libertarian and Green candidates, the latter two having appeared on enough ballots nationwide to potentially win a majority of the Electoral College. Participants were also given “did not vote” and “prefer not to say” options. We asked about voting behavior in 2016 and 2020 at all three time points (pre-election, post-election, and post-inauguration) but asked about voting in 2024 only at post-election and post-inauguration.Footnote 2
Attitudes about republicans and democrats
To measure attitudes about the Republican and Democratic electorates, we asked participants in the 2024 election cycle to rate both groups on moral character and honesty “compared to other Americans.” The five-point rating scale ranged from +2 to −2 with the following verbal labels: +2 (a lot more moral/honest), +1 (somewhat more moral/ honest), 0 (about the same), −1 (somewhat more immoral/dishonest), −2 (a lot more immoral/dishonest). There were four items total reflecting the crossing of party and trait. The two ratings for each party were highly correlated, r(680) = .88 for Republicans and .78 for Democrats, ps < .001. Ratings were therefore averaged to form a single affective score for each party, Cronbach’s alpha = .94 for Republicans and .88 for Democrats.
Support for authoritarian leadership
In 2024, we asked two questions to directly measure support for an authoritarian leadership style. Borrowing a measure from Bartels (Reference Bartels2020), we asked participants to rate their agreement or disagreement with the statement, “Having a strong leader in government is good for the United States even if the leader bends the rules to get things done.” Responses were made on a five-point scale from 1 (Disagree strongly) to 5 (Agree strongly). Borrowing from Pew Research Center (Pew Research Center, 2017), we asked participants to evaluate “a system of government in which a strong leader can make decisions without interference from Congress or the courts.” Responses were made on a five-point scale from 1 (Very bad) to 5 (Very good).
Survey distribution
In all election cycles, we made the survey available to independent samples during three nonoverlapping temporal windows. For the pre-election sample, the survey became available on October 10 in 2016, September 25 in 2020, and September 30 in 2024. In 2016 and 2020, availability ended at 11:59 PM the Monday before Election Day (November 8 in 2016 and November 3 in 2020), giving us 29 days to collect data in 2016 and 39 days to collect data in 2020. A longer window was used in 2020 to account for a COVID-related slowdown in participant recruitment from a university population (e.g., reduced enrollment or student engagement). In 2024, using Prolific, we could collect data much faster than at the university. We decided to spread data collection over five days (not only for the pre-election timepoint but subsequent ones as well); hence, survey availability ended at 11:59 PM on October 4.
For the post-election sample, the survey became available five days after the winner was announced (November 13 in 2016, November 12 in 2020, and November 10 in 2024). Availability ended on the university’s Reading Day in 2016 (December 7) and 2020 (December 2), allowing for 25 days of data collection in 2016 and 21 days in 2020. Although we would have preferred more time for data collection in 2020 to counter COVID-related obstacles to participant recruitment, we could not have done so without extending data collection into the subsequent semester which would have presented issues of non-equivalence with 2016. In 2024, survey availability ended five days after it commenced (November 14).
For the post-inauguration sample, the survey became available 21 days after Inauguration Day (February 10 in all cases). Data collection ended 51 days later in 2016 (April 1), 72 days later in 2020 (April 21), and four days later in 2024 (February 14).
The survey was administered using SurveyMonkey in 2016 and 2020 and using Google Forms in 2024. In each election cycle, survey availability at the post-election and post-inauguration timepoints was limited to individuals in the participant pool who had not participated at an earlier timepoint.
Human subjects protection
The research was reviewed and approved by the university IRB in 2016 and 2020 and by Solutions IRB in 2024.
Results
Correlating ANES childrearing scores with other indicators of authoritarianism
Preliminarily, it was necessary to determine whether childrearing scores, which were our intended measure of RWA, correlated in theoretically sensible ways with other ostensible indicators of authoritarianism. Establishing validity was especially important given our interest in race by handedness interactions. Some researchers have questioned whether attitudes about childrearing can be taken to reflect authoritarianism in non-White populations (Pérez & Hetherington, Reference Pérez and Hetherington2014). Although we had many indicators of authoritarianism to choose from, we focused on these four: attitude toward Donald Trump (as measured by a feeling thermometer), attitude toward Muslims (measured by a feeling thermometer), and support for authoritarian leadership (measured using two items tapping enthusiasm for a strong leader who bends rules and for a strong leader who makes decisions without interference from other branches of government). We calculated correlations separately for non-White and White participants. Table 2 shows that childrearing scores were positively correlated with attitudes toward Trump, negatively correlated with attitudes toward Muslims, and positively correlated with both measures of support for authoritarian leadership. Critically, these relationships were of roughly equal magnitude regardless of race. Hence, childrearing scores appear to be a valid measure of authoritarian submission for both White and non-White participants.
Correlations with childrearing scores

Table 2. Long description
The table lists five variables: 1. Childrearing, 2. Trump F T (feeling thermometer), 3. Muslims F T, 4. Bend rules, and 5. No interference.
Correlations for non-White participants (above the diagonal, italicized, p < .01 marked with asterisk):
- Childrearing with: Trump F T (.23, n=473); Muslims F T (-.17, n=473); Bend rules (.26, n=223); No interference (.26, n=223).
- Trump F T with: Muslims F T (-.17, n=473); Bend rules (.41, n=223); No interference (.24, n=223).
- Muslims F T with: Bend rules (-.18, n=223); No interference (-.08, n=223).
- Bend rules with: No interference (.57, n=223).
Correlations for White participants (below the diagonal, p < .01 marked with asterisk):
- Trump F T with: Childrearing (.31, n=1149).
- Muslims F T with: Childrearing (-.24, n=1149); Trump F T (-.34, n=1149).
- Bend rules with: Childrearing (.25, n=457); Trump F T (.46, n=457); Muslims F T (-.23, n=457).
- No interference with: Childrearing (.27, n=457); Trump F T (.43, n=457); Muslims F T (-.20, n=457); Bend rules (.57, n=457).
Footnotes define F T as feeling thermometer. ‘Bend rules’ refers to agreement that a strong leader may bend rules. ‘No interference’ refers to approval of a leader making decisions without Congress or the courts.
Note: Correlations for non-White participants are shown above the diagonal and italicized. Correlations for White participants are shown below the diagonal. Variables 1–3 were measured in all election cycles. Variables 4–5 were measured in 2024 only. The number of participants contributing data to each correlation is shown in parentheses.
a FT = feeling thermometer.
b Agreement with “Having a strong leader in government is good for the United States even if the leader bends the rules to get things done.”
c Approval of “a system of government in which a strong leader can make decisions without interference from Congress or the courts.”
*p < .01.
Handedness
Inconsistent handedness is a minority phenomenon. Applying our classification scheme based on a handedness score of |80|,| we found, in our total sample of 1622 participants, that 34.5% were ICH and 65.5% were CH. Roughly the same distribution was found in each individual election cycle, with the percentage of ICH ranging from a low of 30.7% in 2020 to a high of 38.4% in 2024. Although direction of handedness was not the focus of our research, 11% of participants had negative handedness inventory scores, indicating left-handedness. This is very close to the best estimate of left-handedness in the entire population, which Papadatou-Pastou et al. (Reference Papadatou-Pastou, Ntolka, Schmitz, Martin, Munafò, Ocklenburg and Paracchini2020) put at 10.6%. Left-handers were more prevalent among ICH (18.6%) than CH (6.9%), consistent with the finding that left-handers are relatively weakly lateralized compared to right-handers (Borod et al., Reference Borod, Caron and Koff1984).
Handedness did not differ as a function of White or non-White racial identity. ICH comprised 34% of non-White participants and 36% of White participants, Χ 2(1) = 0.56. Left-handers comprised 11% of non-White and White participants alike.
Political ideology
We first established that, as in prior research (Grillo et al., Reference Grillo, Pupcenoks and Lyle2018; Lyle & Grillo, Reference Lyle and Grillo2014), CH and ICH did not differ in how they describe themselves along the liberal/conservative continuum. Self-ratings of political ideology were submitted to a 2 (handedness: ICH or CH) X 2 (race: non-White or White) X 3 (election: 2016, 2020, or 2024) X 3 (timepoint: pre-election, post-election, post-inauguration) ANCOVA with the covariates of age, gender, and religiosity. No effects involving handedness approached conventional significance; all ps ≥ .25. The only significant effect was that of race, F(1, 1583) = 41.84, p < .001, partial eta squared = .026. Non-White participants were more liberal (M = 3.0, SD = 1.9) than White participants (M = 3.7, SD = 1.7). The mean for both racial groups was significantly less than 4.0 on the 7-point ideology scale: White t(1148) = 6.58, p < .001, d = 0.19; non-White t(472) = 11.48, p < .001, d = 0.53, indicating a slight tendency toward liberalism in both groups.
Authoritarian submission
Scores on our measure of authoritarian submission were submitted to a 2 (handedness: ICH or CH) X 2 (race: non-White or White) X 3 (election: 2016, 2020, or 2024) X 3 (timepoint: pre-election, post-election, post-inauguration) ANCOVA, with the covariates of age, gender, and religiosity. There were four significant effects. First, there was a main effect of race. Non-White individuals scored higher (M = 1.87, SD = 1.4) than White individuals (M = 1.71, SD = 1.3), F(1, 1583) = 4.46, p = .035, partial eta squared = .003. However, this was qualified by a second significant effect, an interaction between race and election, F(2, 1583) = 10.20, p < .001, partial eta squared = .013. This interaction is shown in Figure 2. To deconstruct the interaction, we repeated the ANCOVA for each election separately, examining the effect of race in each. The effect of race was not significant in 2016 or 2020, Fs < 1, but there was a pronounced effect in 2024, F(1, 665) = 25.44, p < .001, partial eta squared = .037. Non-White participants scored higher (M = 2.1, SD = 1.0) than White participants (M = 1.6, SD = 1.7).
Authoritarian submission by race and election. Note: Error bars represent standard errors.

Figure 2. Long description
The Y-axis is labeled Mean Authoritarian Submission with a scale from 0 to 3. The X-axis is labeled Election with three points: 2016, 2020, and 2024. A legend at the top indicates a solid line for White and a dotted line for Non-White.
* The White group (solid line) shows a slight, steady linear decrease over time. It starts at approximately 1.8 in 2016, drops slightly to 1.7 in 2020, and ends at approximately 1.6 in 2024.
* The Non-White group (dotted line) shows a fluctuating trend. It begins at approximately 1.9 in 2016, dips to approximately 1.6 in 2020, and then shows a sharp increase to approximately 2.1 in 2024.
Vertical error bars representing standard errors are present at each data point for both groups.
Third, there was the expected main effect of handedness, F(1, 1583) = 7.35, p = .007, partial eta squared = .005. ICH had lower scores (M = 1.69, SD = 1.5) than CH (M = 1.89, SD = 1.4). Qualifying this, however, was the fourth and final significant effect: the three-way interaction between handedness, election, and timepoint, F(4, 1583) = 2.97, p = .019, partial eta squared = .007. The interaction is shown in Figure 3.
Authoritarian submission by handedness, election, and timepoint. Note: E = election, I = inauguration. Error bars represent standard errors.

Figure 3. Long description
The Y-axis is labeled Mean Authoritarian Submission with a scale from 0 to 3. The X-axis is labeled Election And Timepoint, featuring nine chronological markers: 16 Pre-E, 16 Post-E, 16 Post-I, 20 Pre-E, 20 Post-E, 20 Post-I, 24 Pre-E, 24 Post-E, and 24 Post-I.
Two data series are plotted with error bars:
* C H (solid black line): Starts at approximately 2.0 at 16 Pre-E, dips slightly at 16 Post-E, then remains relatively stable between 1.8 and 2.0 across all subsequent timepoints.
* I C H (dotted black line): Starts lower at 1.6, peaks sharply at 2.2 during 16 Post-E, then drops and fluctuates between 1.4 and 1.7 for the 2020 and 2024 cycles, generally remaining below the C H line except for the 2016 Post-E peak and a convergence at 24 Pre-E.
To deconstruct the interaction, we first repeated the ANCOVA described above for each handedness group separately. For CH, scores were flat across elections and timepoint with no main effect of either factor or an interaction, Fs < 1. For ICH, however, there was a significant interaction between election and timepoint, F(4, 550) = 2.71, p = .029, partial eta squared = .019. To delve further, we conducted the ANCOVA for each election separately and only for ICH. The main effect of timepoint was not significant in 2020, F < 1, or in 2024, F(2, 252) = 1.79, p = .169. In 2016, however, there was a significant effect of timepoint, F(2, 178) = 4.97, p = .008, partial eta squared = .053. The quadratic function was significant, with scores rising immediately after the election, then falling to pre-election levels, t(178) = 2.97, p = .003.
Trump feeling thermometer
Feeling thermometer ratings for Donald Trump were submitted to a 2 (handedness: ICH or CH) X 2 (race: non-White or White) X 3 (election: 2016, 2020, or 2024) X 3 (timepoint: pre-election, post-election, post-inauguration) ANCOVA, with the covariates of age, gender, religiosity, and self-described political ideology. There were five significant effects. First, there were main effects of election, F(2, 1582) = 28.83, p < .001, partial eta squared = .033, and timepoint, F(2, 1582) = 5.45, p = .004, partial eta squared = .007. Warmth was lowest in 2016 (M = 21.3, SD = 34.7), somewhat higher in 2020 (M = 23.8, SD = 33.0), and substantially higher still in 2024 (M = 37.4, SD = 34.4). In each election, warmth was nearly equal at pre-election (M = 25.9, SD = 30.9) and post-inauguration (M = 25.5, SD = 31.6), but warmer immediately after each election (M = 31.1, SD = 27.7).
Third, there was a main effect of race, F(1, 1582) = 19.08, p < .001, partial eta squared = .012. White participants felt more warmly (M = 30.8, SD = 25.8) than non-White participants (M = 24.2, SD = 28.9). However, this was qualified by a fourth significant effect, the interaction between race and election, F(2, 1582) = 12.66, p < .001, partial eta squared = .017. This interaction is shown in Figure 4. There were robust racial differences in 2016 and 2020 such that White participants felt more warmly than non-White participants, smallest F(1, 385) = 10.95, p = .001, partial eta squared = .028. In 2024, this difference disappeared. Repeating the ANCOVA for 2024 only, there was no significant main effect of race, F(1, 664) = 1.13, p = .288.
Trump warmth by race and election. Note: Error bars represent standard errors.

Figure 4. Long description
The x-axis is labeled Election with three points: 2016, 2020, and 2024. The y-axis is labeled Mean Trump Warmth and ranges from 0 to 50. A legend at the top indicates a solid line for White and a dotted line for Non-White.
* The White group starts at a mean warmth of approximately 27 in 2016, rises slightly to 29 in 2020, and increases to about 36 in 2024.
* The Non-White group starts significantly lower at approximately 15 in 2016, rises slightly to 18 in 2020, and then shows a sharp increase to approximately 38 in 2024, surpassing the White group.
Vertical error bars are present at each data point to represent standard errors. The gap between the two groups narrows significantly over time, eventually converging and crossing between 2020 and 2024.
Fifth, and of most interest, there was an interaction between handedness and race, F(1, 1582) = 16.70, p < .001, partial eta squared = .010. The interaction is shown in Figure 5. Repeating the ANCOVA for each racial group separately, there was a significant effect of handedness for White participants, F(1, 1127) = 5.45, p = .020, partial eta squared = .005. White ICH felt less warm (M = 28.9, SD = 24.5) than White CH (M = 32.7, SD = 24.5). There was also a significant main effect of handedness for non-White participants, F(1, 451) = 11.50, p < .001, partial eta squared = .025, but in the opposite direction. Non-White ICH were warmer toward Trump (M = 28.4, SD = 28.1) than non-White CH (M = 20.0, SD = 24.8).
Trump warmth by handedness and race. Note: Error bars represent standard errors.

Figure 5. Long description
The line graph features a vertical Y axis labeled Mean Trump Warmth ranging from 0 to 50 in increments of 10. The horizontal X axis is labeled Race with two categories: Non-White and White. A legend at the top center identifies two data series: a dotted line for I C H and a solid line for C H.
* For the Non-White category, the I C H dotted line starts at a mean of approximately 28, while the C H solid line starts lower at approximately 20.
* For the White category, the I C H dotted line remains nearly flat, ending at approximately 29. The C H solid line shows a linear increase, ending higher at approximately 33.
* Both lines include vertical error bars at each data point. The C H line shows a steeper positive slope compared to the relatively stable I C H line.
Trump’s democratic opponent feeling thermometer
To determine whether the interactive effect of handedness and race on attitudes was specific to Trump, we conducted a parallel analysis for Trump’s Democratic opponents. Feeling thermometer ratings for Trump’s Democratic opponent in each election were submitted to a 2 (handedness: ICH or CH) X 2 (race: non-White or White) X 3 (election: 2016, 2020, or 2024) X 3 (timepoint: pre-election, post-election, post-inauguration) ANCOVA, with the covariates of age, gender, religiosity, and self-described political ideology. There were two significant effects, neither involving handedness. First, there was a significant main effect of election, F(2, 1582) = 10.19, p = .001, partial eta squared = .013. Ratings were highest for Joe Biden in 2020 (M = 50.5, SD = 34.4), next highest for Kamala Harris in 2024 (M = 48.9, SD = 35.7), and lowest for Hillary Clinton in 2016 (M = 41.7, SD = 36.1). Second, there was a main effect of race, F(1, 1582) = 13.85, p < .001, partial eta squared = .009. Non-White participants felt more warmly (M = 50.0, SD = 30.0) than White participants (M = 44.1, SD = 26.8). Of most importance, however, was the null effect of the handedness by race interaction, F(1, 1582) = 3.10, p = .079.
Voting behavior
Each participant in the 2024 election cycle reported their voting behavior in the 2016 and 2020 elections. Participants surveyed at the post-election and post-inauguration timepoints also reported their behavior in 2024. One way to analyze these data was by summing the number of elections in which each participant cast a vote for Donald Trump. Initially, we did this for participants, surveyed at the latter two timepoints, who were at least 26 years old and therefore old enough to have voted in all three elections. Individuals who preferred not to report their voting behavior in one or more elections were excluded, leaving an analyzable sample of 346 individuals (104 non-White, 242 White), which represents 76.7% of the total number surveyed at post-election and post-inauguration. We submitted the number of Trump votes cast by these individuals to a 2 (handedness: ICH or CH) X 2 (race: non-White or White) X 3 (election: 2016, 2020, or 2024) X 2 (timepoint: post-election or post-inauguration) ANCOVA, with the covariates of age, gender, religiosity, and self-described political ideology. The only significant effect was the interaction between handedness and race, F(1, 334) = 5.41, p = .021, partial eta squared = .016. The interaction is shown in Figure 6A. To deconstruct the interaction, we repeated the ANCOVA for each race separately. The effect of handedness was significant for White individuals, F(1, 234) = 7.94, p = .005, partial eta squared = .033. White ICH voted for Trump, on average, in fewer than one election (M = 0.85, SD = 0.94), whereas White CH voted for him slightly more than once (M = 1.24, SD = 0.94). For non-White individuals, the pattern was reversed, albeit not significantly, F < 1, with ICH voting for Trump, on average, in one election (M = 1.0, SD = 0.94) and CH voting for him less than once (M = .86, SD = 0.96).
Number of votes cast for Donald Trump by handedness and race. Note: (A) Means are based on the total number of votes cast for Trump in 2016, 2020, and 2024. (B) Means are based on the total number of votes cast for Trump in 2020 and 2024. Error bars represent standard errors.

Figure 6. Long description
The image consists of two vertically stacked line graphs, labeled A and B. Both graphs share the same axes. The y-axis is labeled Mean Trump Votes with a scale from 0 to 2. The x-axis is labeled Race with two categories: Non-White and White. Each graph contains two lines: a dotted line for I C H and a solid line for C H.
Panel A: The I C H dotted line starts at approximately 1.0 for Non-White and shows a slight downward trend to approximately 0.85 for White. The C H solid line starts lower at approximately 0.85 for Non-White and shows a linear increase to approximately 1.25 for White. The lines intersect between the two x-axis categories. Vertical error bars are present at each data point.
Panel B: The overall values are lower than in Panel A. The I C H dotted line starts at approximately 0.75 for Non-White and trends downward to approximately 0.6 for White. The C H solid line starts at approximately 0.6 for Non-White and increases to approximately 0.8 for White. Similar to Panel A, the lines intersect between the categories, and error bars indicate standard errors.
To assure ourselves of the robustness of this finding, we conducted a similar analysis examining only behavior in 2020 and 2024. This allowed us to include data from individuals 22 or older (vs. 26 or older), increasing the sample size. Excluding any individuals who chose not to disclose voting behavior, the analyzable sample was 400 participants (126 non-White, 274 White), or 88.7% of the whole. The maximum number of votes for Trump was two in this analysis. Replicating the ANCOVA from above, the only significant effect was the handedness X race interaction, F(1, 388) = 6.36, p = .012, partial eta squared = .016, as shown in Figure 6B. The effect of handedness was significant for White respondents, F(1, 266) = 6.38, p = .012, partial eta squared = .023, but not non-White, F = 1.54, p = .217. White ICH cast significantly fewer votes for Trump (M = 0.58, SD = 0.63) than White CH (M = 0.80, SD = 0.64). Non-White ICH, in contrast, cast numerically more votes for Trump (M = 0.74, SD = 0.66) than their CH counterparts (M = 0.60, SD = 0.64).
Interim summary I
Handedness consistency is a reliable indicator of Trump support/opposition. Among White individuals, being highly consistent is associated with feeling warmer toward Trump and voting for him more. Among non-White individuals, it is the reverse: Highly consistent persons feel less warm and vote for him less, although we could not demonstrate the statistical significance of the voting difference. What consistent individuals have in common, regardless of race, is that they tend to score higher on authoritarian submission, replicating prior research (Grillo et al., Reference Grillo, Pupcenoks and Lyle2018; Lyle & Grillo, Reference Lyle and Grillo2014, Reference Lyle and Grillo2020).
Following up on these core findings, we next examine how handedness relates to: 1) affiliation with the Republican Party, 2) attitudes about the Republican and Democratic electorates, and 3) attitudes about groups frequently criticized by Trump or his allies. These analyses will provide a fuller picture of how handedness, in conjunction with race, shapes political cognition in the Trump era.
Identification with the Republican Party
Participants were asked which political party they identified with. We were especially interested in identification with the Republican Party, the party of Donald Trump. We therefore assigned a score of 1 when participants chose the Republican (or lean Republican) response and a score of 0 when participants chose any other response option. Given the dichotomous nature of these data, we conducted a logistic regression. The dependent variable was identification with the Republican Party. The predictors were handedness, race, election, timepoint, and all possible interaction terms. The reference categories were 2016 for election and pre-election for timepoint. Age, gender, religiosity, and self-described political ideology were covariates. The stepwise method was utilized. The final model that exceeded our p-value threshold of .05 was a good predictor of Republican Party identification, χ2(10) = 984.5, p < .001. The model’s overall fit was excellent, with Nagelkerke’s R 2 of .645. Table 3 shows all included variables. The significant main effect of race indicates that White participants were more likely than non-White participants to identify with the Republican Party, and the significant main effect of election indicates that Republican identification was more likely in the 2024 election cycle than the 2016 cycle. Of greater interest are the various interactions, especially the four-way interaction of handedness, race, election (2020), and timepoint (post-inauguration). Because the reference categories were the 2016 election and the pre-election timepoint, and because there was no interaction with the 2024 election term or the post-election term, the implication is that dynamics involving handedness and race were operable at the post-inauguration timepoint in 2016 and 2024, but not in 2020. What differentiates the post-inauguration timepoint in 2016 and 2024 from 2020 is, of course, the ascension of Donald Trump to the presidency. To visualize what occurred in 2016 and 2024, we extracted marginal means from a 2 (handedness: ICH or CH) X 2 (race: non-White or White) X 2 (timepoint: pre-election or post-inauguration) ANCOVA, with the covariates of age, gender, religiosity, and self-described political ideology, with Republican identification as the dependent variable. Identification is plotted, for visualization purposes, on a zero to 1 scale. Results are shown in Figure 7. Before the elections, the handedness groups differ hardly at all, regardless of race. After Trump’s inauguration, however, there are marked differences between CH and ICH, but these differences depend on race. Among White respondents, CH are more likely than ICH to identify as Republican, odds ratio = 3.74, z = 2.98, p = .003. Among non-White respondents, CH are less likely than ICH to identify as such, odds ratio = .109, z = −2.69, p = .007.Footnote 3 Follow-up analyses confirmed that, in 2020, handedness was not related to the probability of Republican identification at the post-inauguration timepoint for either White, odds ratio = 0.46, z = −0.92, or non-White respondents, odds ratio = 1.56, z = 0.49.
Output table for logistic regression predicting Republican Party identification

Table 3. Long description
The table consists of six columns: Predictor, beta, S E, O R, Wald chi-squared, and p.
Covariates:
* Age: beta minus .075, S E .020, O R 0.928, Wald 23.50, p less than .001.
* Religiosity: beta .096, S E .018, O R 1.10, Wald 27.74, p less than .001.
* Ideology: beta 1.26, S E .070, O R 3.53, Wald 140.77, p less than .001.
Main effects:
* Race: beta 1.91, S E .354, O R 6.76, Wald 29.14, p less than .001.
* Election 2024 versus 2016: beta 1.96, S E .403, O R 7.07, Wald 23.50, p less than .001.
Two-way interactions:
* Handedness X race: beta .454, S E .195, O R 1.58, Wald 5.41, p .020.
* Race X 2020 election: beta minus .693, S E .272, O R .500, Wald 6.48, p .011.
* Race X 2024 election: beta minus 1.50, S E .422, O R .223, Wald 12.62, p less than .001.
Three-way interaction:
* Handedness X 2020 election X post-inauguration: beta 1.35, S E .584, O R 3.86, Wald 5.34, p .021.
Four-way interaction:
* Handedness X race X 2020 election X post-inauguration: beta 5.01, S E .867, O R .007, Wald 33.38, p less than .001.
Mean identification with the Republican Party in 2016 and 2024. Note: Error bars represent standard errors.

Figure 7. Long description
A bar chart with a Y-axis labeled Mean Republican Identification ranging from .00 to .50 in increments of .10. The X-axis is divided into two main time periods: Pre-Election on the left and Post-Inauguration on the right. Each period is further subdivided into White and Non-White categories. A legend at the top indicates white bars represent I C H and gray bars represent C H.
In the Pre-Election section:
* White: I C H is approximately .35 and C H is approximately .38.
* Non-White: I C H is approximately .22 and C H is approximately .21.
In the Post-Inauguration section:
* White: I C H is approximately .29 and C H increases to approximately .42.
* Non-White: I C H increases to approximately .32 and C H decreases to approximately .18.
Vertical error bars are present on each bar to indicate standard error.
Attitudes about Republicans and Democrats
Affective scores (the average of morality and honesty ratings) were submitted to a 2 (party: Republican or Democrat) X 2 (handedness: ICH or CH) X 2 (race: non-White or White) X 3 (timepoint: pre-election, post-election, or post-inauguration) ANCOVA, with the covariates of gender, age, religiosity, and self-described political ideology. Party was within-participants. The ANCOVA yielded five significant effects. First, there was a significant main effect of party, F(1, 664) = 78.98, p < .001, partial eta squared = .106. Democrats were viewed more positively (M = 0.09, SD = 0.83) than Republicans (M = −0.22, SD = 0.91). Second, there was a main effect of race, F(1, 664) = 9.47, p = .002, partial eta squared = .014. White participants viewed generic members of both parties more negatively (M = −0.13, SD = 0.47) than non-White participants (M = 0.002, SD = 0.48). This main effect was, however, qualified by a third significant effect, the race X timepoint interaction, F(2, 664) = 3.34, p = .036, partial eta squared = .010. Repeating the ANCOVA for each timepoint separately yielded no significant effect of race at post-election, F(1, 217) = 1.31, p = .253, or post-inauguration, F < 1, but a pronounced effect at pre-election, F(1, 221) = 12.38, p < .001, partial eta squared = .053, with White participants being more negative (M = −0.17, SD = 0.47) than non-White participants (M = 0.10, SD = 0.47).
The fourth and fifth significant effects both involved handedness. There was a significant timepoint X handedness, F(2, 664) = 3.30, p = .038, partial eta squared = .010, shown in Figure 8. Repeating the ANCOVA for each timepoint separately, CH and ICH did not differ significantly at pre-election, F < 1, or at post-inauguration, F(1, 218) = 2.94, p = .088, but there was a significant difference immediately after the election, F(1, 217) = 5.90, p = .016, partial eta squared = .026. At that point, ICH perceived the Republican and Democratic electorates more negatively (M = −0.18, SD = 0.46) than CH (M = −0.02, SD = 0.51).
Affective scores collapsed across party by handedness and timepoint. Note: E = election, I = inauguration. Error bars represent standard errors.

Figure 8. Long description
The y-axis is labeled Mean Affective Score with a range from negative .25 to positive .20 in increments of .05. A horizontal zero line is highlighted. The x-axis is labeled Timepoint with three categories: 24 Pre-E, 24 Post-E, and 24 Post-I. A legend at the top identifies two groups: I C H represented by a dotted line and C H represented by a solid line.
* The I C H group starts at approximately 0.00 at 24 Pre-E, drops sharply to a low of approximately negative .17 at 24 Post-E, and shows a slight recovery to approximately negative .12 at 24 Post-I.
* The C H group starts at approximately negative .07 at 24 Pre-E and shows a steady linear increase, crossing the zero line to reach approximately positive .01 at 24 Post-I.
Vertical error bars are present at each data point, indicating standard error. The error bars for I C H are generally larger than those for C H.
The fifth and most interesting significant effect was the party X handedness X race interaction, F(1, 664) = 12.13, p < .001, partial eta squared = .018. Repeating the ANCOVA for each party separately yielded a significant handedness X race interaction in each case: Republicans, F(1, 664) = 6.60, p = .010, partial eta squared = .010; Democrats, F(1, 664) = 10.06, p = .002, partial eta squared = .015. These interactions are shown in Figure 9. For perceptions of Republicans, we conducted the ANCOVA separately for each race. For White individuals, there was a significant effect of handedness, F(1, 447) = 4.96, p = .026, partial eta squared = .011. White CH appraised Republicans more positively (M = −0.21, SD = 0.84) than White ICH (M = −0.39, SD = 0.85). There was no significant effect of handedness for non-White individuals, F(1, 213) = 2.23, p = .137.
Affective scores by party, handedness, and race. Note: Error bars represent standard errors.

Figure 9. Long description
The image consists of two vertically stacked line graphs. Both graphs share the same axes: the y-axis represents Mean Affective Score ranging from -1.0 to 1.0, and the x-axis represents Race with two categories: Non-White and White. Each graph contains two lines: a dotted line for I C H and a solid line for C H.
Top Panel: Republicans
* The I C H dotted line starts near 0.0 for Non-White and shows a linear decrease to approximately -0.4 for White.
* The C H solid line remains relatively flat, starting slightly below -0.2 for Non-White and ending at approximately -0.2 for White.
Bottom Panel: Democrats
* The I C H dotted line starts slightly below 0.0 for Non-White and shows a slight linear increase to approximately 0.1 for White.
* The C H solid line starts at approximately 0.3 for Non-White and shows a linear decrease to approximately 0.0 for White.
Both panels include vertical error bars at each data point representing standard errors.
Perceptions of Democrats showed a contrasting pattern. There was no significant effect of handedness for White individuals, F < 1, but there was for non-White individuals, F(1, 213) = 11.64, p < .001, partial eta squared = .052. Non-White CH viewed Democrats more (M = 0.30, SD = 0.76) than non-White ICH (M = −0.04, SD = 0.77).
To summarize, consistent handedness is associated with a more positive view of Republicans among Whites and with a more positive view of Democrats among non-Whites.
Authoritarian outgroups
2016 and 2020
We submitted feeling thermometer ratings to an exploratory factor analysis (with orthogonal varimax rotation) to identify any factors that could be interpreted as representing authoritarian outgroups (Lyle & Grillo, Reference Lyle and Grillo2014, Reference Lyle and Grillo2020). Because the same thermometers were used in 2016 and 2020 (except for replacing Hillary Clinton with Joe Biden), data from those elections were analyzed jointly. A factor explaining .315 of the variance comprised ratings of Mexicans,Muslims, immigrants, homosexuals, and atheists. All factor loadings ≥ .64, which was the loading for atheists. We averaged ratings for the five groups and submitted them to a 2 (handedness: ICH or CH) X 2 (race: non-White or White) X 2 (election: 2016 or 2020) X 3 (timepoint: pre-election, post-election, post-inauguration) ANCOVA with the covariates of age, gender, religiosity, and self-described political ideology. The ANCOVA yielded a significant main effect of election, F(1, 914) = 15.29, p < .001, partial eta squared = .016. Ratings were higher in 2020 (M = 77.0, SD = 25.5) than 2016 (M = 70.6, SD = 26.2), but this was qualified by a significant interaction with handedness, F(1, 914) = 3.94, p = .047, partial eta squared = .004. The interaction is shown in Figure 10. Repeating the ANCOVA for each handedness group separately, the effect of election was significant for ICH, F(1, 294) = 13.31, p < .001, but not for CH, F(1, 616) = 2.91, p = .088. ICH’s warmth toward authoritarian outgroups increased by nearly ten points between 2016 (M = 69.4, SD = 24.9) and 2020 (M = 79.0, SD = 23.6).
Feeling thermometer ratings for authoritarian outgroups in 2016 and 2020. Note: Error bars represent standard errors.

We also tested whether the handedness groups differed in either election. Analyzing each election separately, the main effect of handedness was not significant in either: 2016 F(1, 525) = 1.44, p = .230; 2020 F(1, 385) = 2.81, p = .094.
2024
In 2024, participants rated a new set of people, groups, and ‘movements’ (MAGA, wokeism). A factor explaining .345 of the variance comprised ratings of feminists, transgender persons, migrants, Muslims, atheists, Kamala Harris, and wokeism. All factor loadings ≥ .57 (for wokeism). We averaged the seven ratings and submitted means to a 2 (handedness: ICH or CH) X 2 (race: non-White or White) X 3 (timepoint: pre-election, post-election, post-inauguration) ANCOVA with the covariates of age, gender, religiosity, and self-described political ideology. The ANCOVA yielded three significant effects. First, there was a main effect of race, F(1, 664) = 4.26, p = .039, partial eta squared = .006. Non-White participants were cooler toward these groups (M = 46.8, SD = 19.4) than White participants (M = 50.1, SD = 19.3), but this was qualified by two different two-way interactions. One was the race X timepoint interaction, F(2, 664) = 3.48, p = .031, partial eta squared = .010. As shown in Figure 11, non-White participants’ ratings were only lower than Whites’ at the post-election and post-inauguration timepoints. Repeating the ANCOVA for each of those timepoints separately yielded significant effects of race, post-election F(1, 217) = 5.16, p = .024, partial eta squared = .023; post-inauguration, F(1, 218) = 5.39, p = .021, partial eta squared = .024.
Mean feeling thermometer ratings in 2024 by race and timepoint. Note: E = election, I = inauguration. Error bars represent standard errors.

Figure 11. Long description
The vertical Y axis is labeled Mean Feeling Thermometer and ranges from 30 to 70. The horizontal X axis is labeled Timepoint and includes three markers: 24 Pre-E, 24 Post-E, and 24 Post-I. A legend at the top indicates a dotted line for Non-White and a solid line for White.
* The White group (solid line) starts at approximately 49 at 24 Pre-E, rises slightly to 51 at 24 Post-E, and ends at 50 at 24 Post-I, showing a relatively stable trend.
* The Non-White group (dotted line) starts higher at approximately 52 at 24 Pre-E, then shows a linear decrease to 46 at 24 Post-E, and continues to decline to approximately 42 at 24 Post-I.
Vertical error bars are present at each data point, indicating the standard error for each measurement.
Race also interacted with handedness, F(1, 664) = 4.65, p = .031, partial eta squared = .007. As shown in Figure 12, it was only among ICH that non-White individuals gave lower thermometer ratings (M = 44.8, SD = 18.9) than White individuals (M = 51.5, SD = 18.8). Repeating the ANCOVA on ICH only, the main effect of race was significant, F(1, 251) = 7.05, p = .008, partial eta squared = .027. Among CH, non-White individuals (M = 48.8, SD = 18.8) and White individuals (M = 48.7, SD = 18.7) gave nearly identical ratings, F < 1.
Mean feeling thermometer ratings in 2024 by race and handedness. Note: Error bars represent standard errors.

Figure 12. Long description
The x-axis is labeled Race with two categories: Non-White on the left and White on the right. The y-axis is labeled Mean Feeling Thermometer with a scale from 30 to 70 in increments of 10. A legend at the top identifies two groups: I C H represented by a dotted line and C H represented by a solid black line.
* The C H group (solid line) remains nearly horizontal, starting at approximately 49 for Non-White participants and ending at approximately 49 for White participants.
* The I C H group (dotted line) shows a linear increase, starting lower at approximately 45 for Non-White participants and rising to approximately 52 for White participants.
* Vertical error bars are present at each data point, indicating the standard error for each measurement.
Interim summary II
The findings in this section reveal additional ways in which handedness and race interact to shape support for Donald Trump. First, being consistently handed (vs. inconsistent) was associated with increased identification with the Republican Party among White individuals but decreased identification among non-White individuals. Note that this is manifestly a “Trump effect” because it was observed only when Trump was in the White House, that is, at the post-inauguration time points in the 2016 and 2024 election cycles. Second, White CH appraised the rank-and-file members of Trump’s party (Republicans) more positively than did White ICH, suggesting another link between consistent handedness and Trump support for White individuals.
Third, non-White CH appraised the members of Trump’s opposition party (Democrats) more positively than did non-White ICH, providing another signal that consistent handedness is associated with Trump opposition among non-White individuals.
Regarding attitudes toward authoritarian outgroups, CH did not hold significantly cooler attitudes than ICH in any of the three election cycles, unlike in prior studies (Lyle & Grillo, Reference Lyle and Grillo2014, Reference Lyle and Grillo2020). Handedness was not totally without relevance, however. Being inconsistently handed was associated with an increase in positivity toward outgroups from 2016 to 2020, whereas the attitudes of CH held steady. In 2024, handedness and race interacted to shape attitudes. Inconsistent non-White individuals had cooler attitudes than inconsistent White individuals, whereas the attitudes of consistent individuals were the same regardless of race. This could be taken to suggest that handedness and race work together to determine who is most receptive to Trump’s anti-outgroup rhetoric (non-White ICH) and who is least (White ICH).
Support for authoritarian leadership
We had two measures of support for authoritarian leadership: agreement with the statement “Having a strong leader in government is good for the United States even if the leader bends the rules to get things done” and approval of “a system of government in which a strong leader can make decisions without interference from Congress or the courts.” We submitted each of these to a 2 (handedness: ICH or CH) X 2 (race: non-White or White) X 3 (timepoint: pre-election, post-election, post-inauguration) ANCOVA with the covariates of age, gender, religiosity, and self-described political ideology. The analysis of the “strong leader” measure yielded two significant effects. First, there was a significant main effect of timepoint, F(2, 664) = 5.08, p = .006, partial eta squared = .015. Support was strongest before the election (M = 2.73, SD = 1.2). Immediately after the election (M = 2.41, SD = 1.2) and after the inauguration (M = 2.43, SD = 1.3), support was at the same lower level. Second, there was a significant main effect of race, F(1, 664) = 5.12, p = .024, partial eta squared = .008. Non-White participants expressed more agreement (M = 2.63, SD = 1.2) than White participants (M = 2.41, SD = 1.1).
The analysis of the “no interference” measure yielded the same two significant main effects of timepoint, F(2, 664) = 7.22, p < .001, partial eta squared = .021, and race, F(1, 664) = 5.18, p = .023, partial eta squared = .008. Approval was highest at pre-election (M = 2.36, SD = 1.2) and dipped to a lower level at post-election (M = 1.98, SD = 1.2) and post-inauguration (M = 2.02, SD = 1.2). Non-White participants were more approving (M = 2.22, SD = 1.1) than White participants (M = 2.01, SD = 1.1).
We note that there were no significant main or interactive effects of handedness in the analysis of either measure. The effect that came closest to significance was the handedness by race interaction in the analysis of the “strong leader” measure, F(1, 664) = 3.75, p = .053, partial eta squared = .006. Taking a conservative approach, we eschew interpretation.
To summarize, handedness was not related to endorsement of authoritarian leadership styles, but race was, with non-White individuals being more supportive or approving.
Need for closure
Need for Closure scores were submitted to a 2 (handedness: ICH or CH) X 2 (race: non-White or White) X 3 (election: 2016, 2020, or 2024) X 4 (timepoint: pre-election, post-election, post-inauguration) ANOVA. There were two significant effects. There was a main effect of handedness, F(1, 1586) = 19.55, p < .001, partial eta squared = .012, which was subsumed by a handedness X election interaction, F(2, 1586) = 3.80, p = .023, partial eta squared = .005. As shown in Figure 13, there were robust effects of handedness in 2016 and 2020 such that CH (137.4 and 140.2, SDs = 25.8 and 23.5, respectively) had higher closure scores than ICH (Ms = 129.7 and 130.9, SDs = 28.3 and 26.7, respectively). Repeating the ANOVA for 2016 and 2020 only yielded a main effect of handedness, F(1, 918) = 22.11, p < .001, partial eta squared = .024, and no interaction with election, F < 1. Looking only at 2024, however, there was no effect of handedness, F < 1.
Need for closure by handedness and election. Note: Error bars represent standard errors.

Figure 13. Long description
The graph features a horizontal X axis labeled Election with three points: 2016, 2020, and 2024. The vertical Y axis is labeled Mean Need for Closure with a scale from 100 to 150 in increments of 10.
Two data series are plotted with error bars at each point:
* C H (Consistent Handedness) is represented by a solid black line. It starts at approximately 137 in 2016, rises slightly to a peak of 140 in 2020, and then decreases to approximately 136 in 2024.
* I C H (Inconsistent Handedness) is represented by a dotted black line. It starts lower than the C H group at approximately 130 in 2016, remains relatively stable at 131 in 2020, and then increases to approximately 135 in 2024, nearly converging with the C H group.
Discussion
We have presented a suite of findings showing that handedness and race interact to shape support for Donald Trump across multiple attitudinal, partisan, and behavioral indicators. Across measures, we found evidence that consistent handedness increases support for Trump among White individuals but decreases it among non-White individuals. These interactive effects held for both undergraduates (in 2016 and 2020) and the general population (in 2024) and were not statistically qualified by election. Similarly, the interactive effect of handedness and race on identification with the Republican Party, which was first observed when Trump became president in 2016, was seen again, without statistical qualification, when Trump became president in 2024. Finally, the effect on vote choice for Trump was apparent whether we aggregated all three elections or only the two most recent. Hence, handedness and race retained their interactive influence despite the occurrence of countless national and world events that could have, and in some cases surely did, affect public enthusiasm for Trump.
The stability of our findings suggests that they are less about Trump qua Trump and more about the attitudinal implications of espousing authoritarian ideology in the political realm. Trump, like all political figures, has his ups and downs in public opinion owing to the salience and recency of specific events, but beyond that fluctuation endure attitudinal factors that have more to do with the individual’s disposition toward authoritarianism than with Trump himself.
The attitudinal factors we have in mind are both neurocognitive and social-cognitive in nature and can only be understood in integrative fashion. Prior theorizing has already posited a key neurocognitive difference between CH and ICH, namely, that CH have neurocognitive characteristics disposing them to belief perseverance or stability, whereas ICH have contrasting characteristics disposing them to belief revision or updating (Lyle & Grillo, Reference Lyle and Grillo2014, Reference Lyle and Grillo2020). In the figurative language of Christman and Prichard (Reference Christman and Prichard2016), CH are “oaks,” and ICH are “willows.” Greater epistemic rigidity causes CH to have difficulty accommodating information that conflicts with their current beliefs or hypotheses, much like certain patients with right hemisphere syndromes (Langer & Bogousslavsky, Reference Langer and Bogousslavsky2025). Consonant with a neurocognitive model of ideological thinking (Zmigrod, Reference Zmigrod2021), CH’s neurocognitive profile increases their receptivity to an authoritarian ideology, which rewards long-standing conventional ideas and punishes pluralism and dissent. Because ICH have a different neurocognitive profile that promotes flexible thinking, the rigidity of authoritarianism holds relatively little appeal for them. In consequence, CH and ICH diverge, with CH becoming, on average, more authoritarian.
The neurocognitive dispositions of CH and ICH are thought to be the product of relatively low-level brain processes (Zmigrod, Reference Zmigrod2021) and hence they are presumably independent of social factors such as racial identity. Our findings support this independence. The effect of handedness on our measure of authoritarian submission, as well as our measure of need for closure, did not depend on race. CH in both racial groups were higher in submission and need for closure.
Social factors come into play, however, when we consider how a neurocognitive disposition toward authoritarianism and cognitive rigidity is expressed in relation to a specific political figure, in this case, Donald Trump. Our findings suggest that the identical disposition toward cognitive rigidity and authoritarianism can either increase or decrease Trump support, and we theorize that this is so because, when an authoritarian ideology is tied to a specific individual, social cognition begins to operate. Trump’s race (White) and party affiliation (Republican) have social implications, as do his policies and public statements, which have often concerned race and other social variables entwined with race, such as ethnicity, nationality, and religion (Silva, Reference Silva2019). Although consistently, White and non-White individuals may be equally likely to resonate with Trump’s authoritarianism, they might respond to Trump differently depending on their social cognitions about him. Liu et al. (Reference Liu, Stickney and Batt2020) suggested one possibility: that Trump’s racialized anti-outgroup rhetoric is particularly attractive to White people, who see themselves as part of Trump’s ingroup, but particularly threatening to non-White people, who see themselves in the outgroups. Other possibilities also exist. For example, the Democratic Party has, for decades, been socially constructed as the party best representing the interests of non-White Americans, whereas the Republican Party is thought to align more with White interests (Gilens, Reference Gilens2023; Zhirkov & Valentino, Reference Zhirkov and Valentino2022; see also Hajnal & Horowitz, Reference Hajnal and Horowitz2014. Cognitive rigidity could make it difficult for non-White CH to accept a Republican candidate but make it easy for White CH to do so. Another possibility is that the messaging individuals receive about Trump from other respected sources of authority differs depending on racial identity. For example, some White evangelical leaders have supported Trump whereas some Black churches have opposed him (Augustine, Reference Augustine2020). Authoritarian submission could increase receptivity to these endorsements or objections, bolstering Trump support for White CH while weakening it for non-White CH. These possibilities are not mutually exclusive, and more than one could work in concert. While future research will be necessary to identify the precise social cognitions responsible, the key takeaway is that authoritarianism is not monolithic in its political consequences. When the authoritarian personality encounters a concrete individual whose political identity is racially salient, social cognition has a crucial impact on the resultant evaluative processes.
We note that Dusso’s (Reference Dusso2017) idea that RWA may cause Black voters to favor Black candidates cannot explain the entirety of our results, even if we extend the idea to all non-White racial identities. Only one of the election cycles we examined involved a non-White candidate (Kamala Harris). Dusso acknowledged, however, that, in his study of the 2012 election, Barack Obama was both a Black candidate and the Democratic candidate. Considering the latter, it is possible RWA increased Black individuals’ deference to the Democratic Party. This echoes the idea we put forth in the preceding paragraph about cognitive rigidity and partisanship.
The model of Trump support we have proposed can and should be extended to other political figures who use authoritarian discursive frames. These could be candidates for the presidency or other offices, and could include appointed officials (e.g., Secretaries of State, Defense, or Homeland Security). Although there is evidence that, traditionally, U.S. politicians have not relied heavily on authoritarian messaging (Bonikowski et al., Reference Bonikowski, Luo and Stuhler2022), and authoritarianism has not been strongly related to vote choice (Knuckey & Hassan, Reference Knuckey and Hassan2022), the future situation may be different. Trump’s effective usage of authoritarian ideology as a rhetorical device may encourage other politicians to follow suit, and it is possible that some voters will come to expect such rhetoric, perhaps even perceiving its usage as a sort of litmus test. According to our model, there should be an enduring neurocognitive disposition toward authoritarianism among some members of the electorate, but the attitudinal implications for an individual who attempts to leverage authoritarian ideology for political gain will depend greatly on the individual’s social identity.Footnote 4
In contrast to what we found when analyzing measures of Trump support, race and handedness did not interact to affect support for explicitly authoritarian leadership styles. Instead, we found only a main effect of race: Non-White individuals were more supportive. The race effect suggests our non-White participants were more authoritarian, a suggestion garnering further support from our finding that, in 2024, non-White individuals scored higher on the childrearing measure of authoritarianism. Other findings in the literature support the idea that non-White Americans are more authoritarian than Whites (Liu et al., Reference Liu, Stickney and Batt2020) but it remains contentious (Pérez & Hetherington, Reference Pérez and Hetherington2014). More important than the race effect, at least for our theorizing, is the finding that non-White CH were no less supportive of authoritarian leadership than their ICH counterparts, even though they were less supportive of Trump. This could be because when questions refer generically to a leadership style, unconnected to Trump or other political figures, social-cognitive considerations largely fall away.
A puzzle concerning support for authoritarian leadership remains, however. We might have expected a main effect of handedness (CH being more supportive than ICH) to accompany the main effect of race, since CH, like non-White individuals, were more authoritarian according to their childrearing scores. We cannot provide a definitive solution, but we note that the effect of handedness on authoritarianism, as measured by childrearing scores, was small (partial eta squared = .005). The effect of race in 2024 (the only election cycle in which a race effect was detected) was considerably larger (partial eta squared = .037). It could be that the effect of handedness was too small to increase support for leadership styles that are explicitly extralegal (a leader who bends the rules or acts without regard for Constitutional checks and balances).
We also examined attitudes about authoritarian outgroups and found intriguing but complex patterns. In 2016 and 2020, neither handedness nor race nor their interaction affected attitudes. The null effect of handedness conflicts with the finding from prior research that ICH have warmer attitudes than CH (Lyle & Grillo, Reference Lyle and Grillo2014, Reference Lyle and Grillo2020). That said, the attitudes of ICH increased significantly from ‘16 to ‘20, whereas the attitudes of CH remained steady. One way of framing this is that less authoritarian individuals (ICH), but not more authoritarian ones (CH), became more positive toward authoritarian outgroups over the four years of the first Trump presidency. Crandall et al. (Reference Crandall, Miller and White2018) showed that Trump’s 2016 victory produced an increase in the perceived social acceptability of expressing prejudice toward groups targeted by Trump, including some of the same groups we queried people about (Muslims, immigrants, Mexicans). ICH, being less authoritarian and therefore more tolerant of outgroups (Duckitt & Sibley, Reference Duckitt and Sibley2009), may have reacted to a perceived environment in which prejudice was increasingly normalized by reporting greater acceptance (Crandall et al., Reference Crandall, Miller and White2018). CH, being authoritarian and less tolerant, may have felt no need to signal greater acceptance.
In 2024, the attitudes of White and non-White ICH diverged, with White participants reporting significantly greater warmth. The high level of warmth expressed by White ICH (the highest of all groups) might reflect continued reactive support of the type described above, but a novel mechanism must be provided to explain the low level of warmth expressed by non-White ICH (the lowest of all groups). Remembering that, among non-White individuals, inconsistent handedness was associated with greater Trump support, it may be that non-White ICH adopted negative appraisals from Trump’s rhetoric. Although we did not see the same negativity in earlier election cycles, it could have been the product of eight years of exposure to Trump. Another possibility is that the undergraduate students sampled in 2016 and 2020, versus the general population members sampled in 2024, were less receptive to anti-outgroup rhetoric.
Limitations and future directions
A set of interrelated limitations concerning our samples across the eight years of our study must be pointed out. Our samples were 1) not nationally representative, 2) limited to relatively young adults (18–39 years), and 3) too small to allow us to individuate non-White racial groups. We must therefore be clear that our findings cannot be taken to apply to the entire U.S. electorate, which is more conservative (Gallup, 2016, 2022, 2025), older, and more racially diverse than our samples. We note that we restricted our age range because older adults are more consistently handed than younger adults (Bernard & Seidler, Reference Bernard and Seidler2012; Lyle et al., Reference Lyle, McCabe and Roediger2008; Porac, Reference Porac1993). As inconsistent handedness is a minority phenomenon even among the youngest adults, studying relationships between handedness and political cognition in older populations is challenging, albeit an important direction for future research. Also important is research that will compare non-White racial groups (as, e.g., in Geiger & Reny, Reference Geiger and Reny2024; Liu et al., Reference Liu, Stickney and Batt2020). Although we have shown that non-White CH, in aggregate, are less supportive of Trump, we cannot yet speak with precision about specific minority group dynamics that may or may not underlie the effect.
Another limitation is that we utilized only a single measure of RWA, primarily tapping into the submission component. Other handedness studies have utilized the Right-Wing Authoritarianism Scale (Chan, Reference Chan2018; Christman, Reference Christman2014), which contains items tapping into all three components (submission, conventionalism, and aggression) but which does not differentiate between components. It therefore remains to be determined how consistency of handedness relates to each component relative to the others. Future studies could utilize the Aggression-Submission-Conventionalism Scale (Dunwoody & Funke, Reference Dunwoody and Funke2016) to garner a subscale score for each component. This is especially important given scholarly interest in which component of RWA is most predictive of Trump support (Smith, Reference Smith2019; Womick et al., Reference Womick, Rothmund, Azevedo, King and Jost2018). Future research might also explore the relationship between handedness and left-wing authoritarianism (Costello et al., Reference Costello, Bowes, Stevens, Waldman, Tasimi and Lilienfeld2022).
Concluding remarks
The causes of Trump support or opposition remain hotly contested. In some liberal spaces, it has become almost folk wisdom that RWA is a distinguishing feature of Trump supporters. Here, we have provided a novel way to situate authoritarianism in a model of Trump support. Authoritarianism, we argue, has roots in the biology of the brain, but it does not simply “cause” people to like or dislike Trump. Trump is a social figure, viewed through a social lens, and the effect of authoritarianism is refracted through that lens, possibly increasing Trump support and possibly decreasing it. Although we have focused on racial identity, there may be other social lenses that have a similar refracting effect—a possibility that awaits future research. For now, what is important to understand is that authoritarianism is not in itself determinative.
Similarly, the neurocognitive dispositions associated with consistent and inconsistent handedness are not determinative of any of the outcomes studied here. Positing biological influences on practically any psychological variable is a fraught endeavor, and there is some evidence that belief in the biological origins of political attitudes is associated with political intolerance (Suhay et al., Reference Suhay, Brandt and Proulx2017). Therefore, we must point out that the effect of handedness on authoritarianism was very small and its effects on various measures of Trump support, although somewhat larger, were also small. It is by no means the case that all White CH support Trump, all non-White CH oppose him, and so on for the ICH groups. Far from arguing for simple biological determinism, we hope this research will foster an appreciation for the inherent complexity of a psychopolitical environment in which multiple factors, including, but not limited to, neuro- and social-cognitive ones, operate in tandem to shape attitudes.
Data availability statement
Our data are available on the Open Science Framework at: https://osf.io/xwz3d/overview?view_only=d37c6cac0ad84a27a4529ea8d8004d7f
Acknowledgments
Results from this research were presented in part at the sixty-sixth annual meeting of the Psychonomic Society (Denver, November 2025).
Competing interests
We have no known conflicts of interest to disclose.

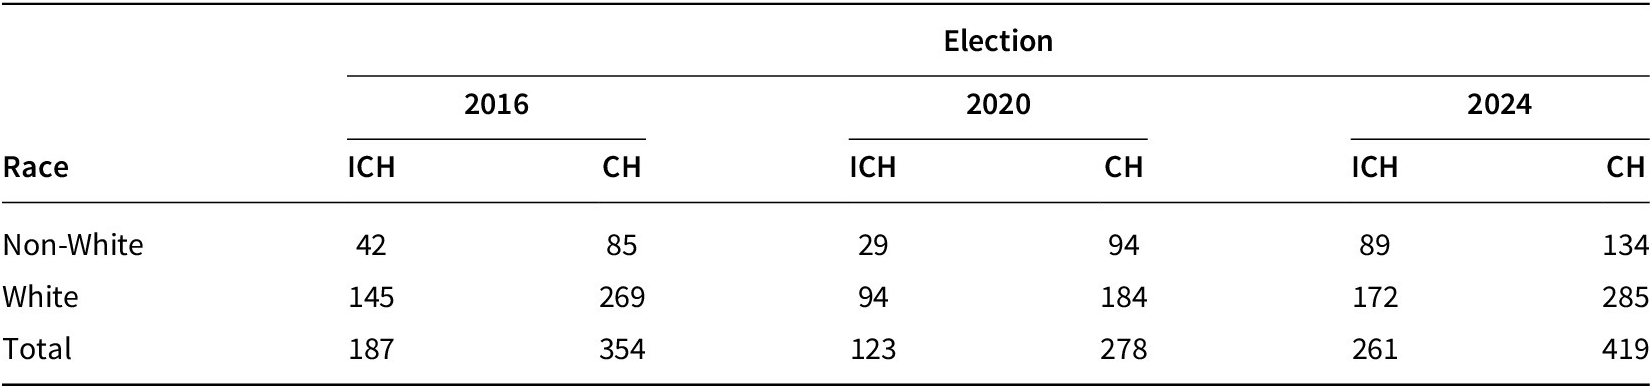
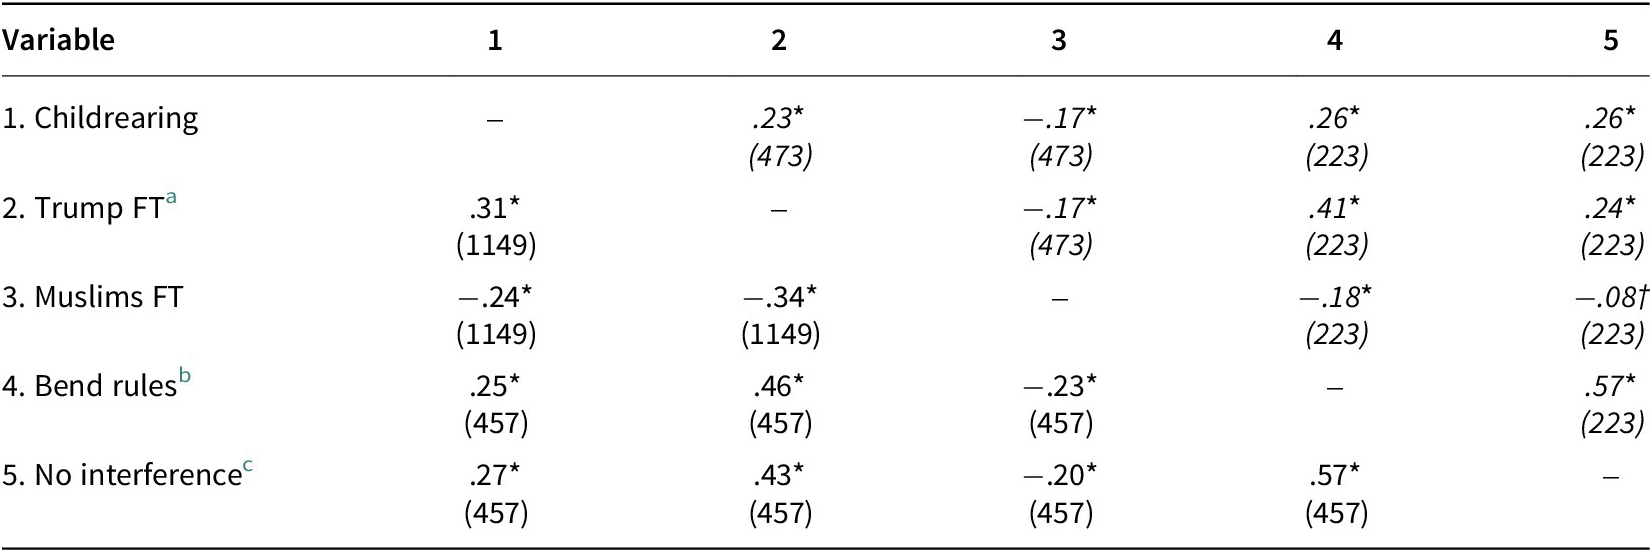
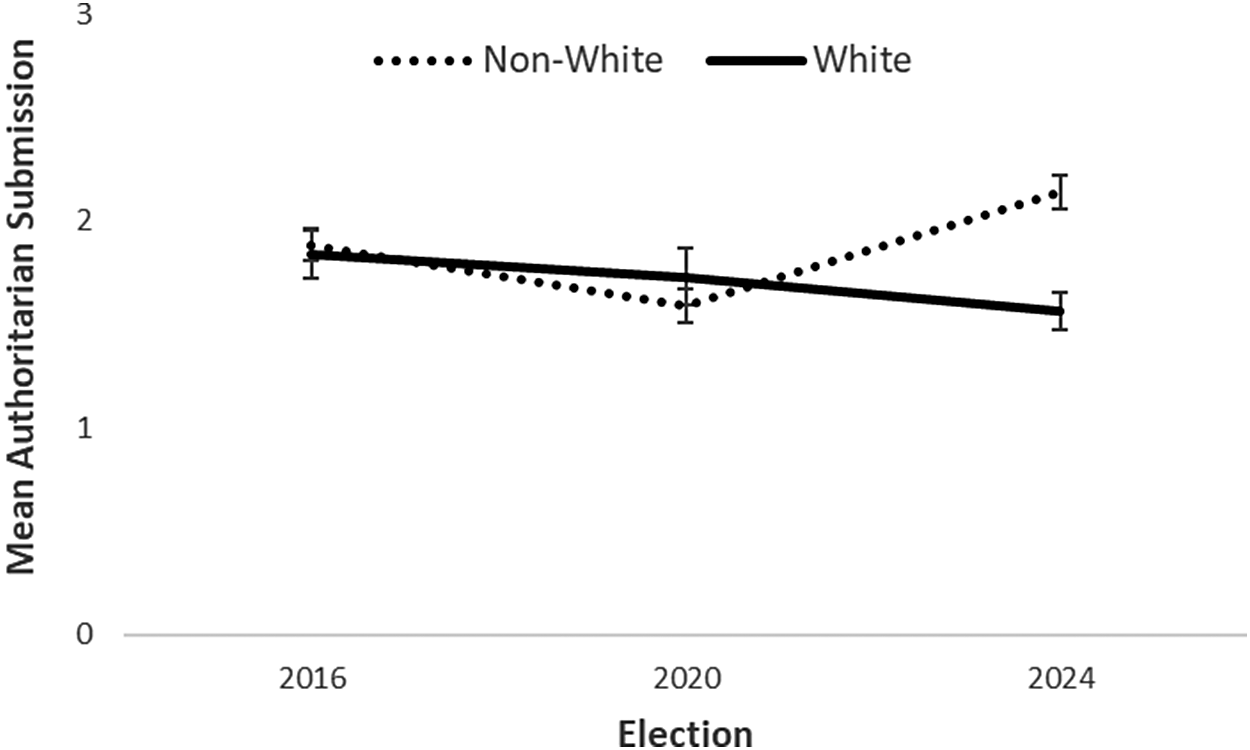
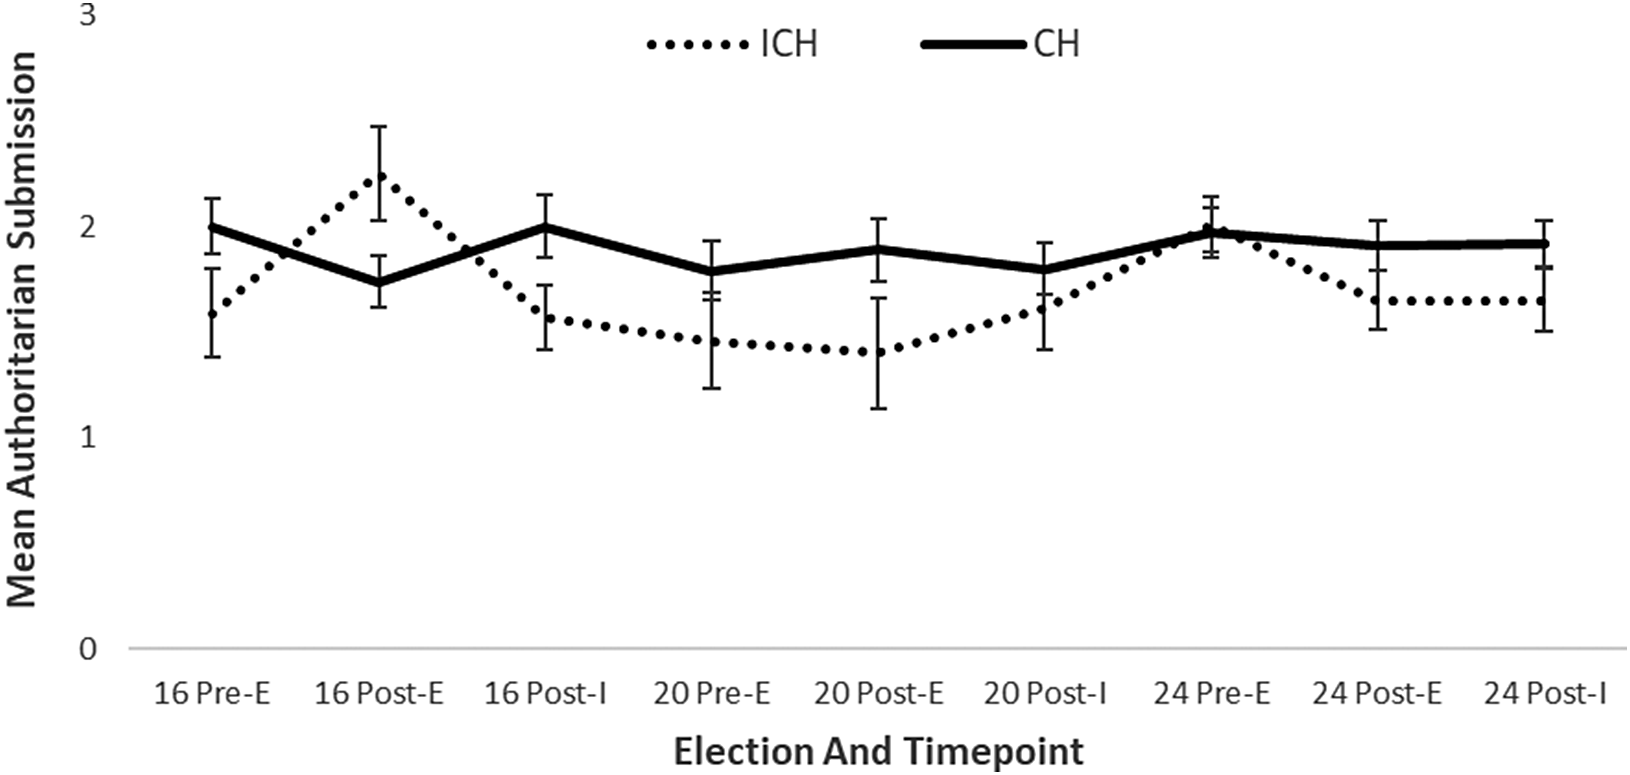
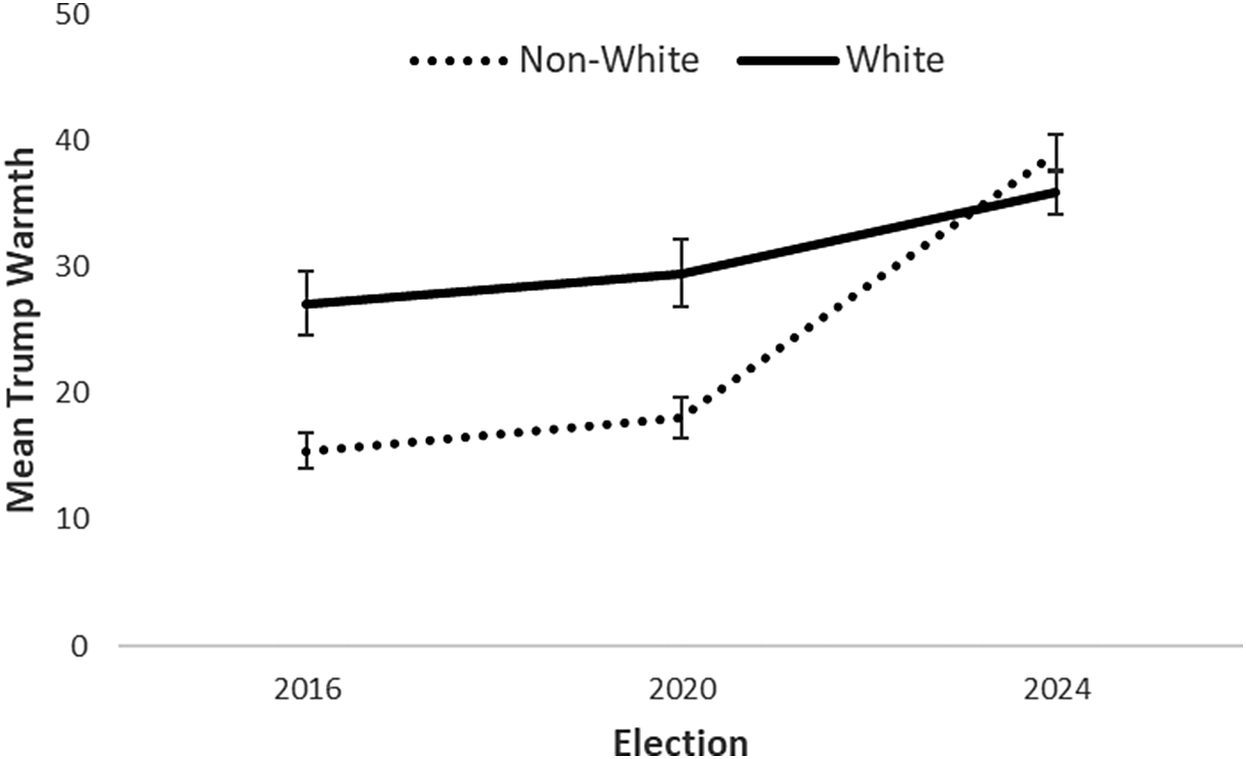
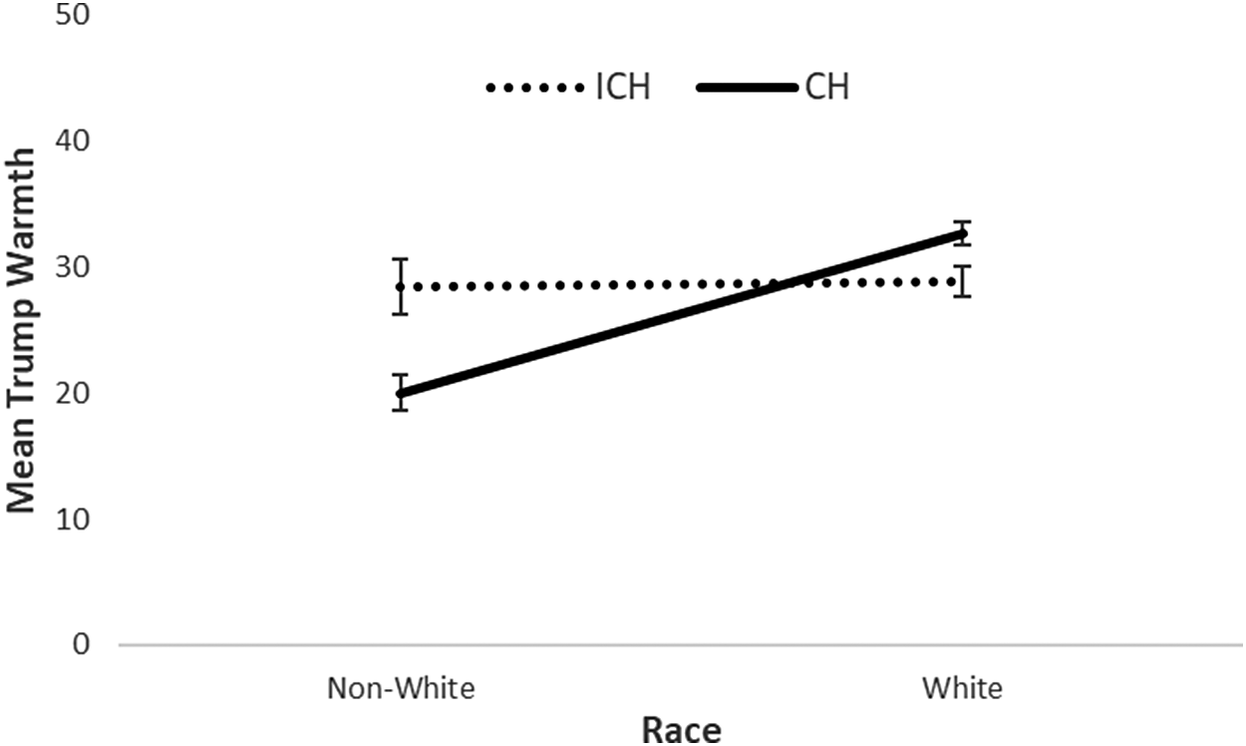
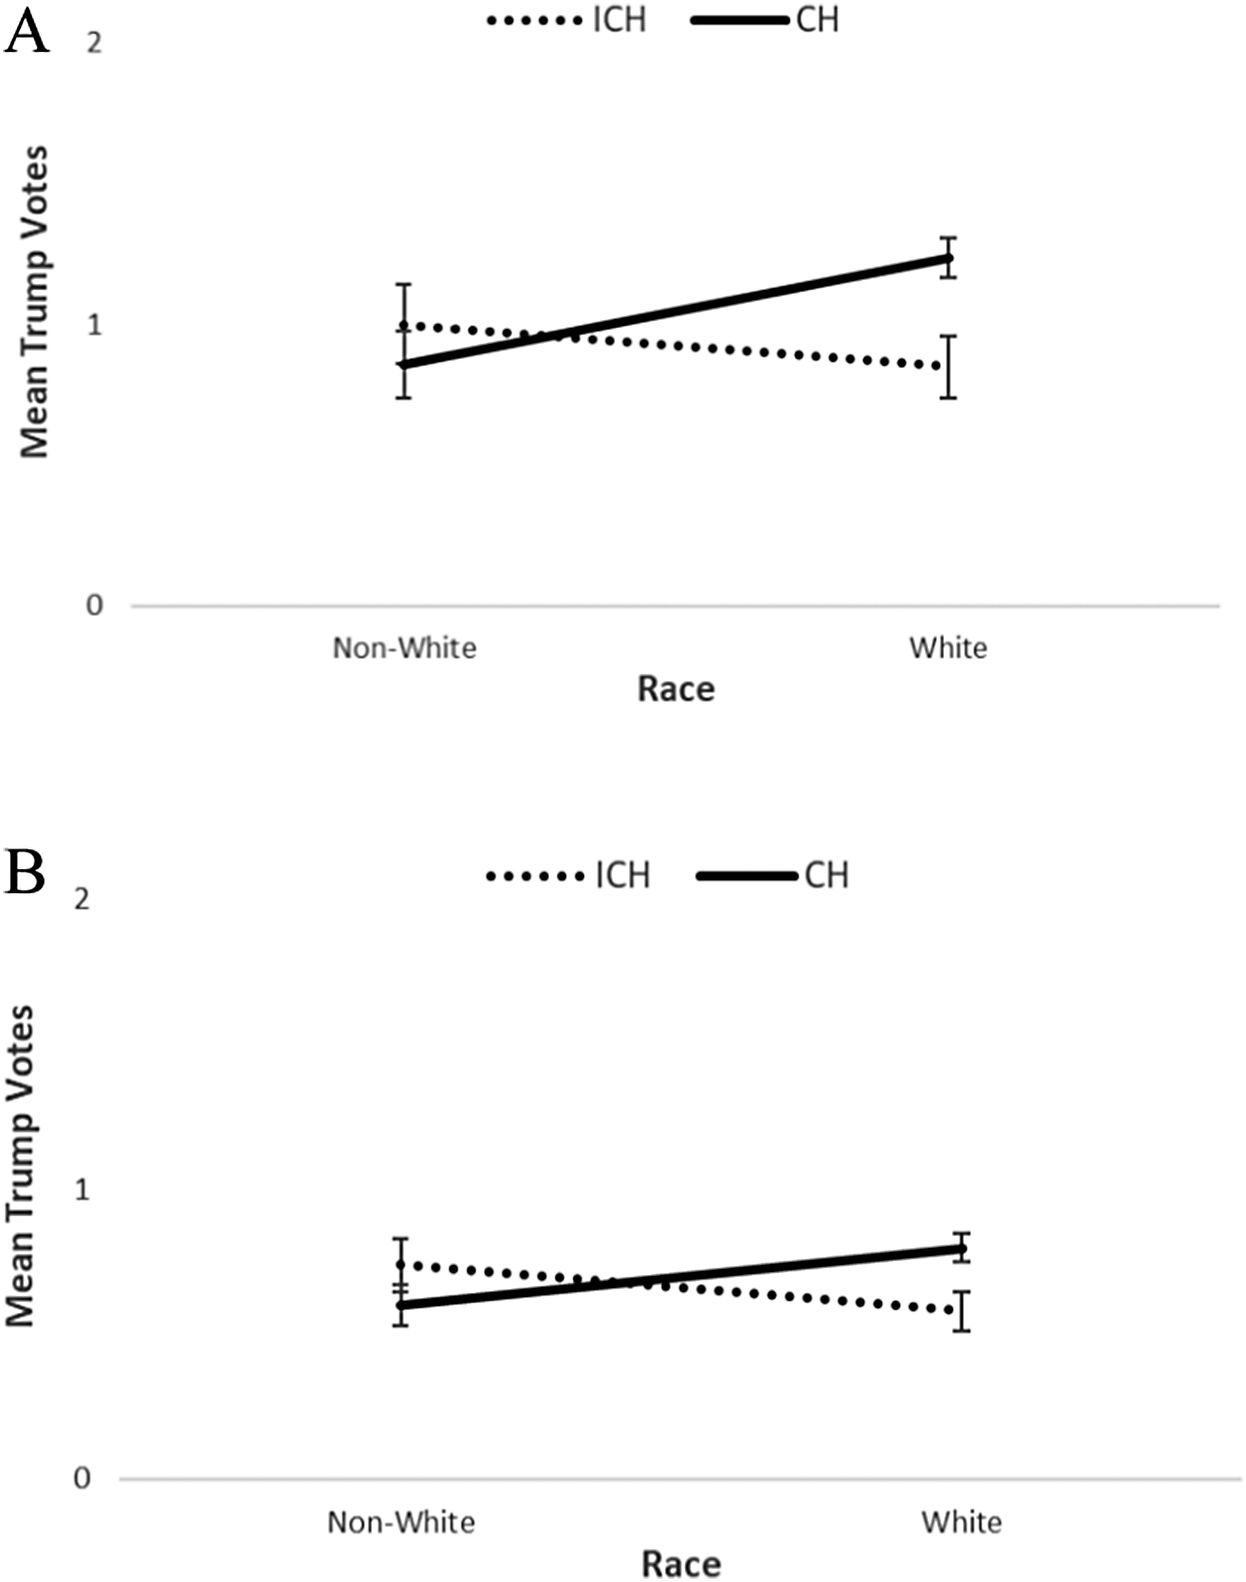
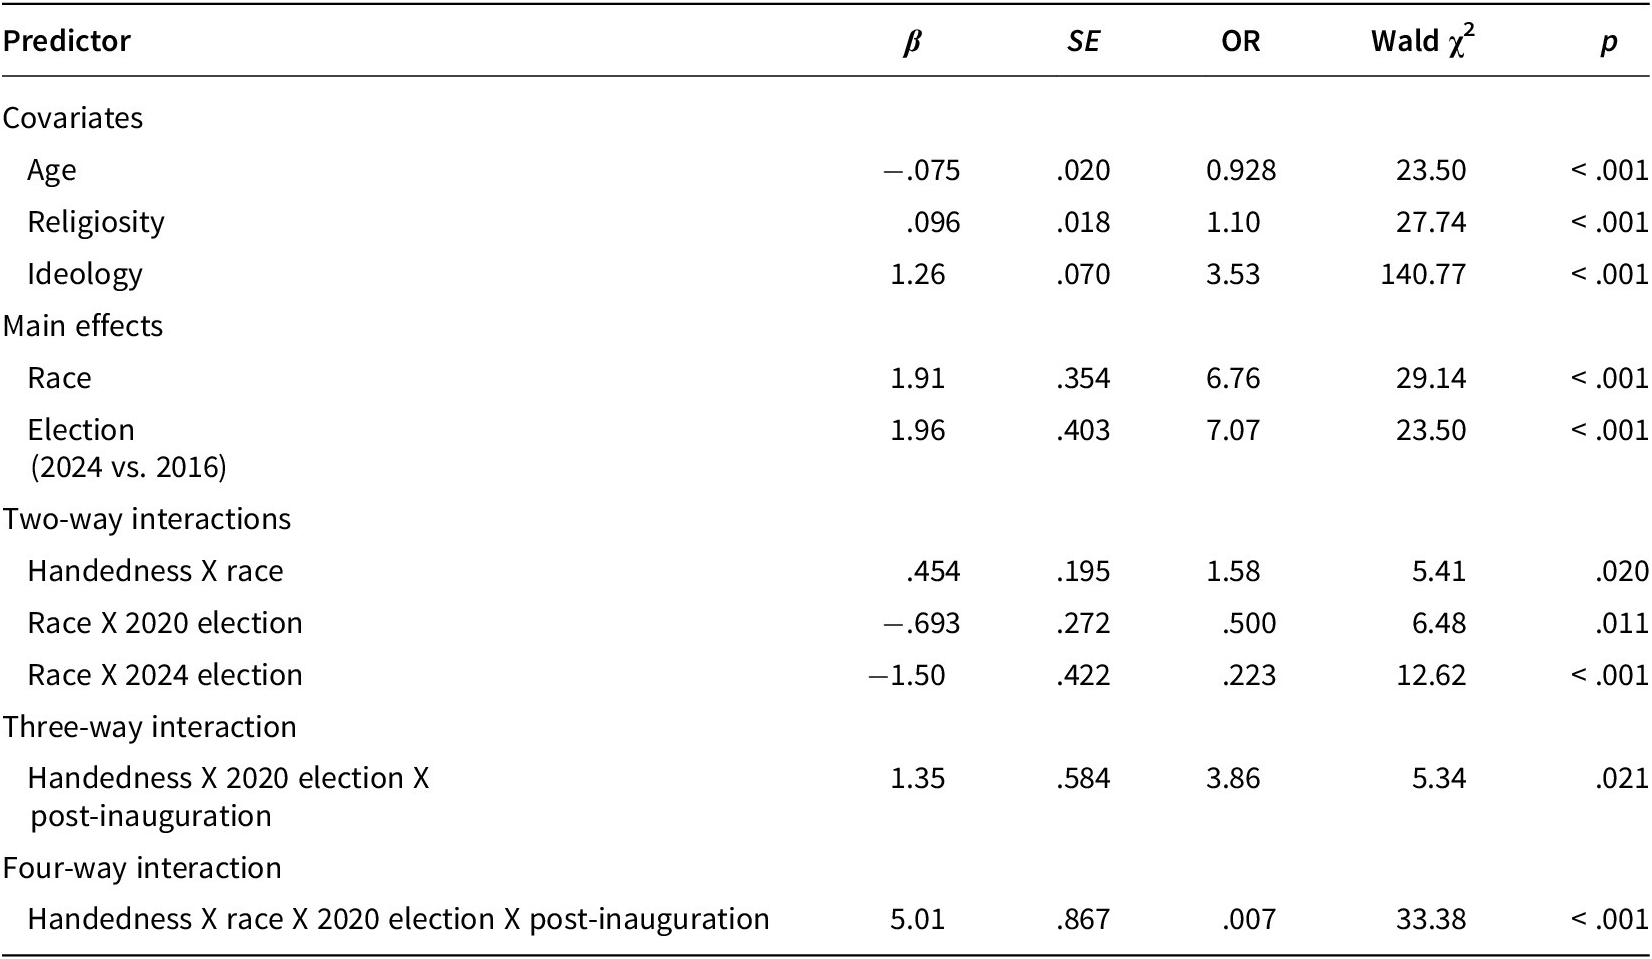
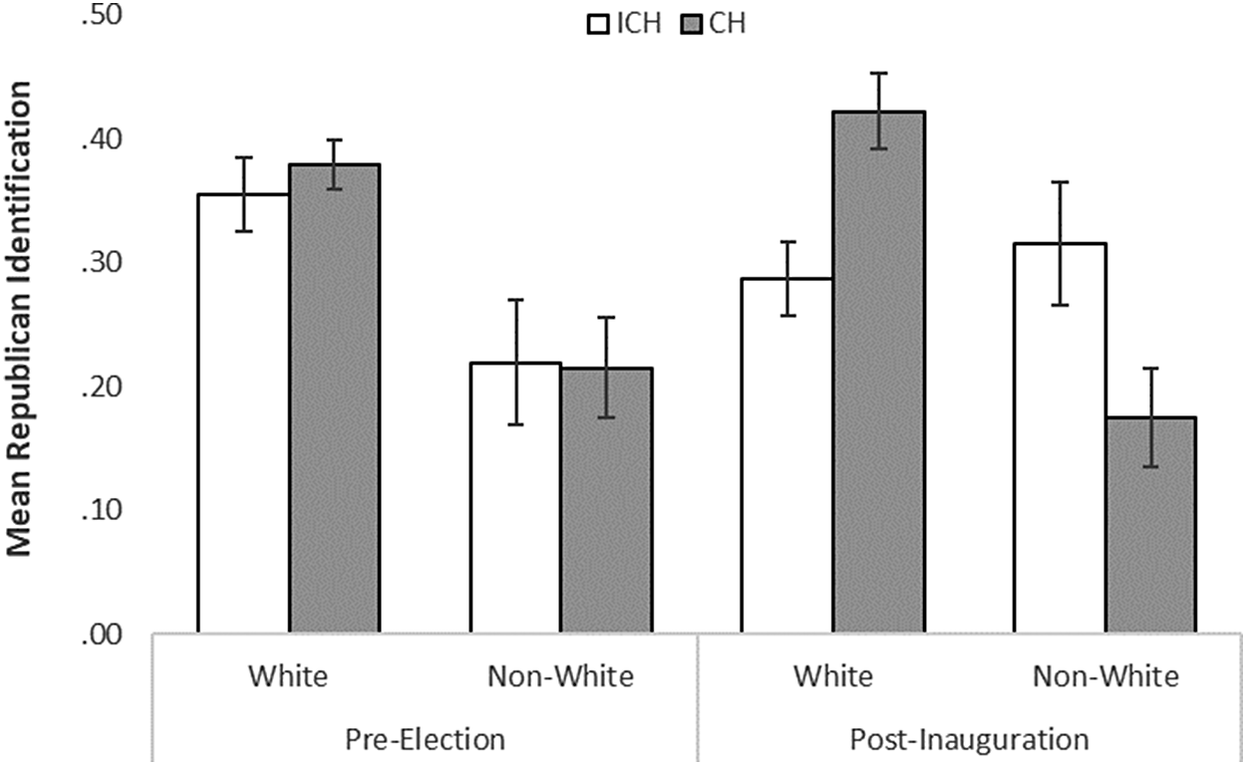
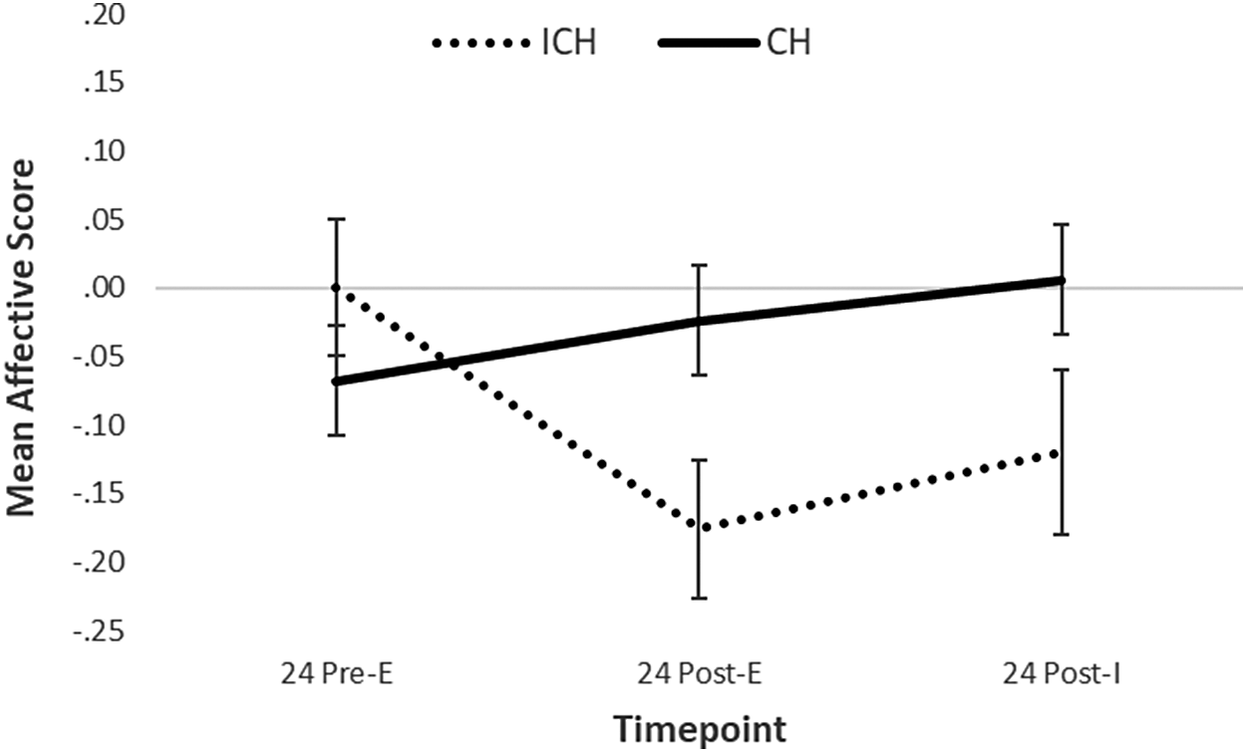
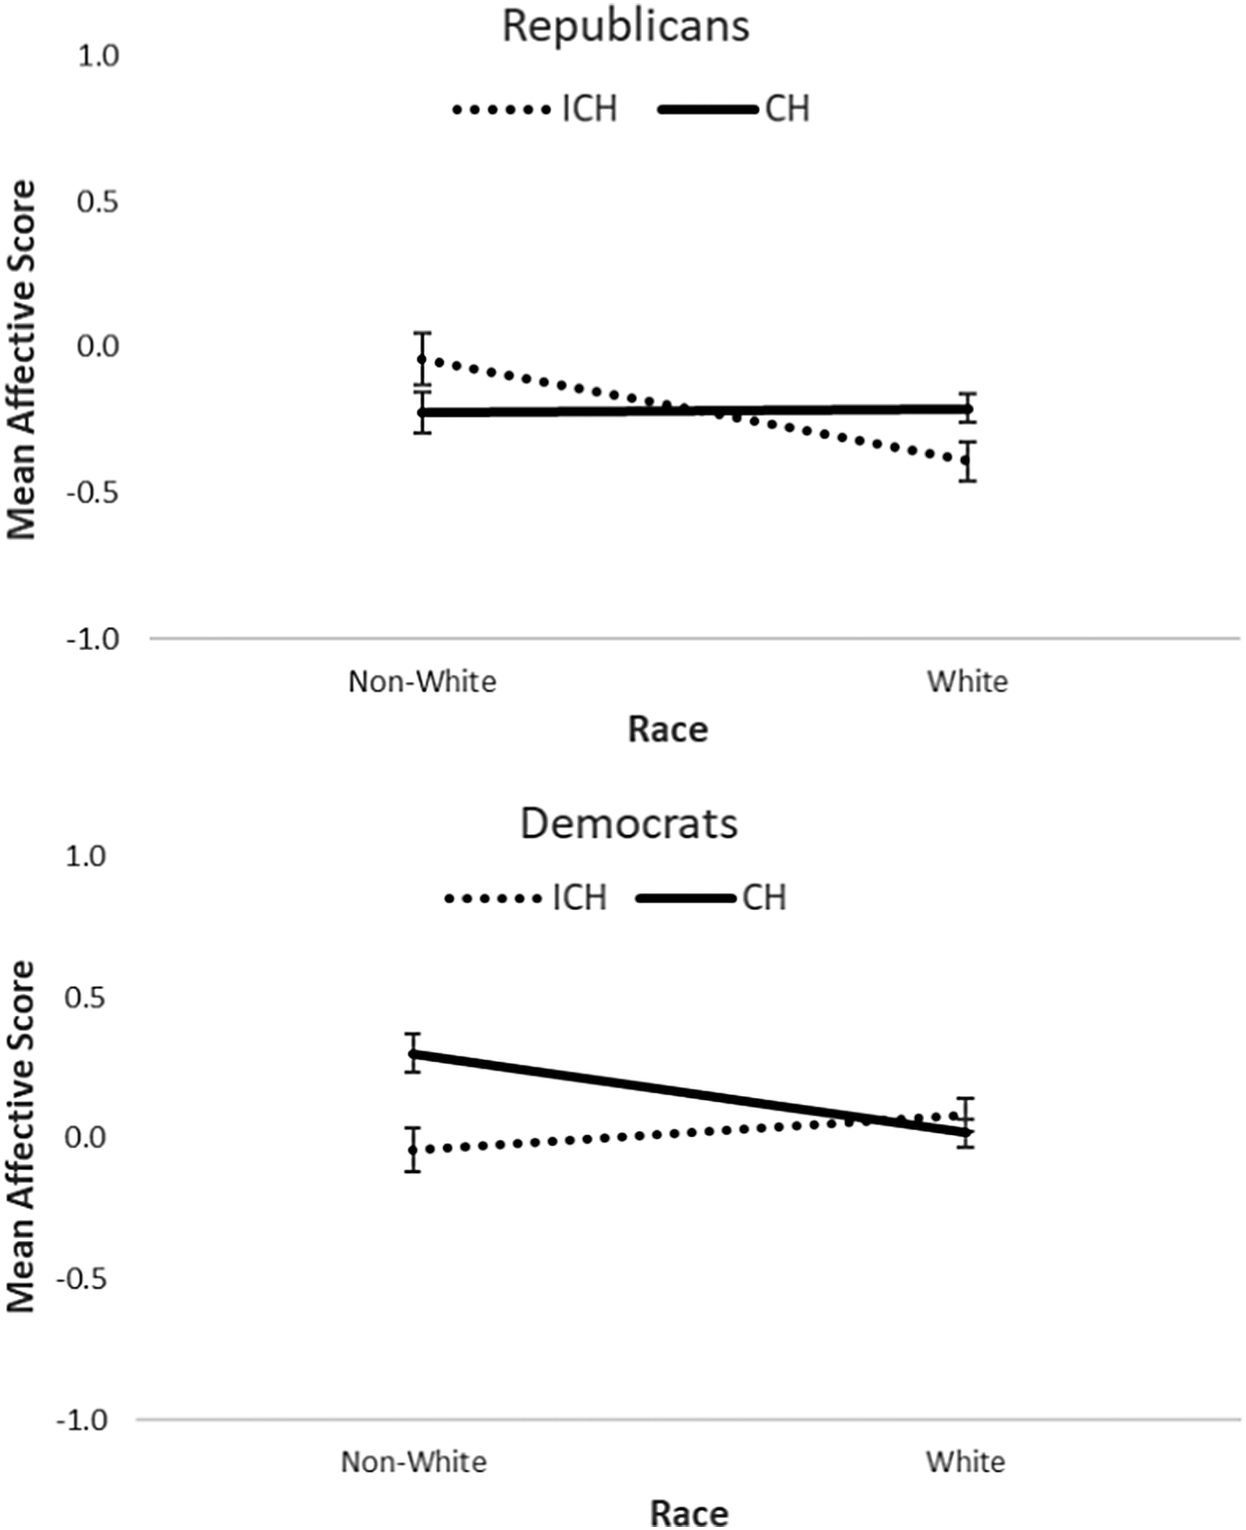
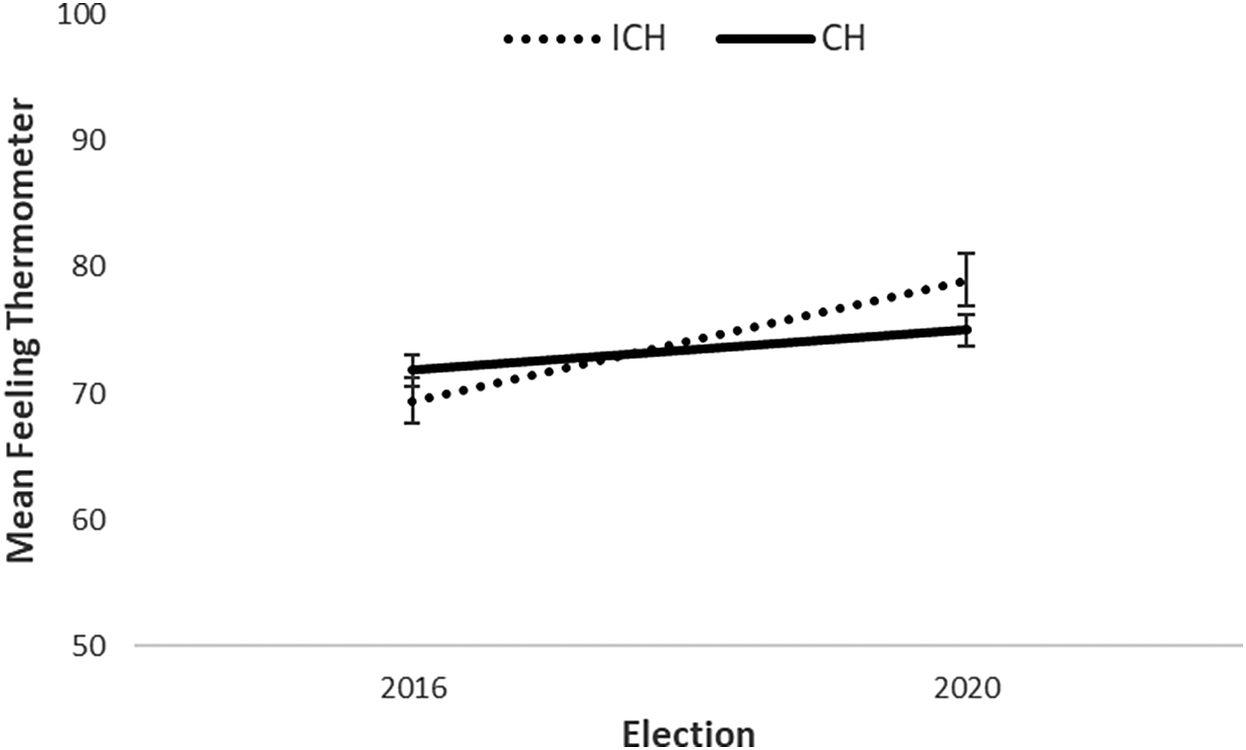
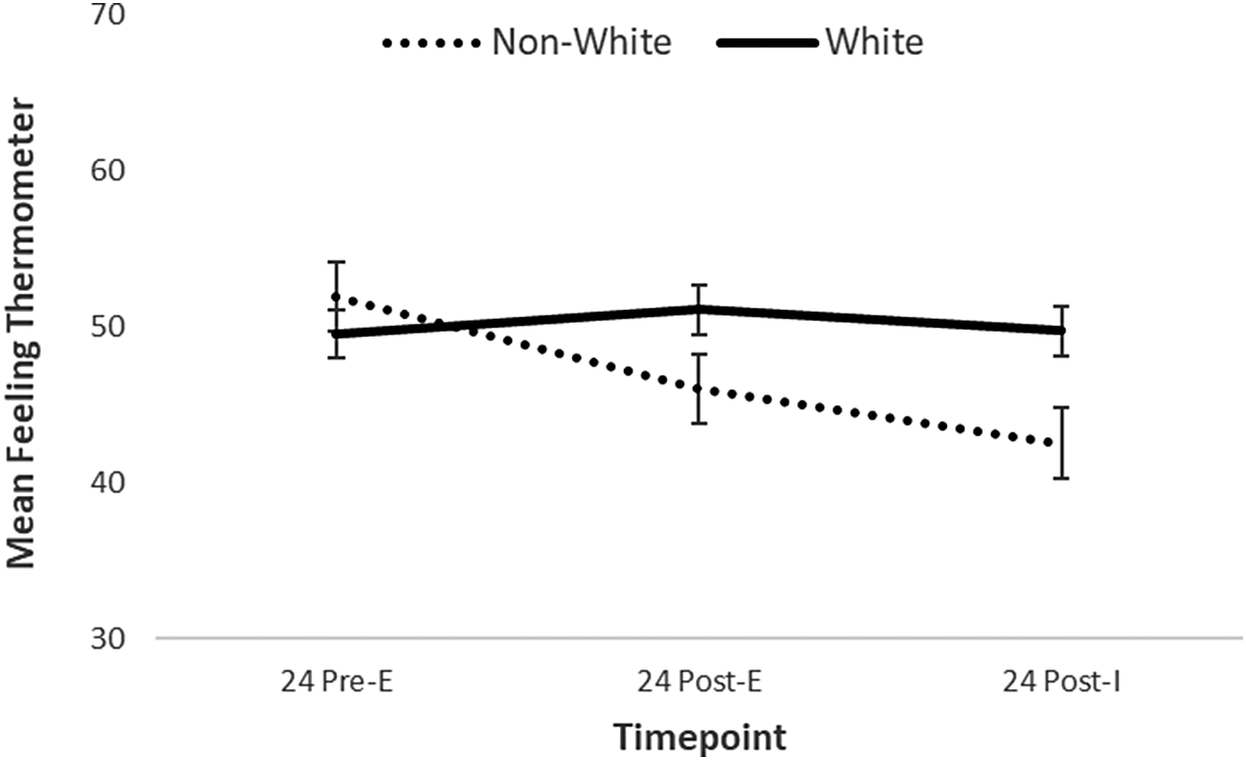
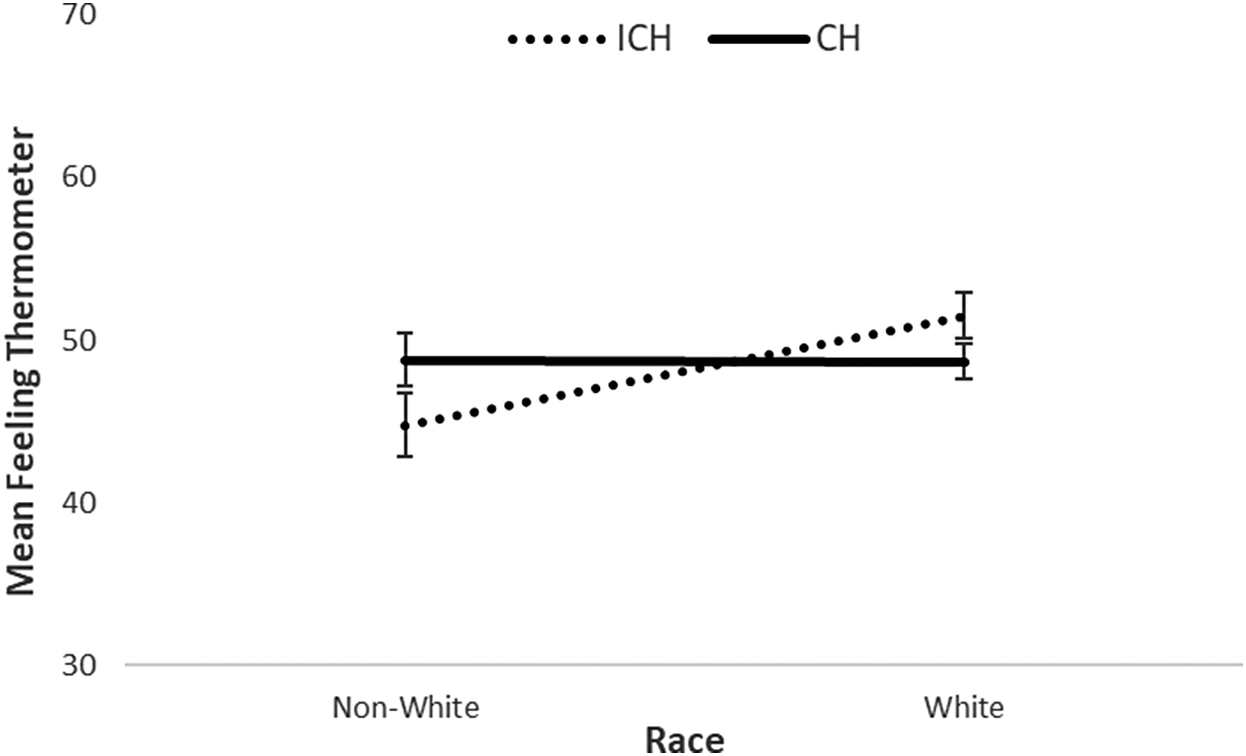
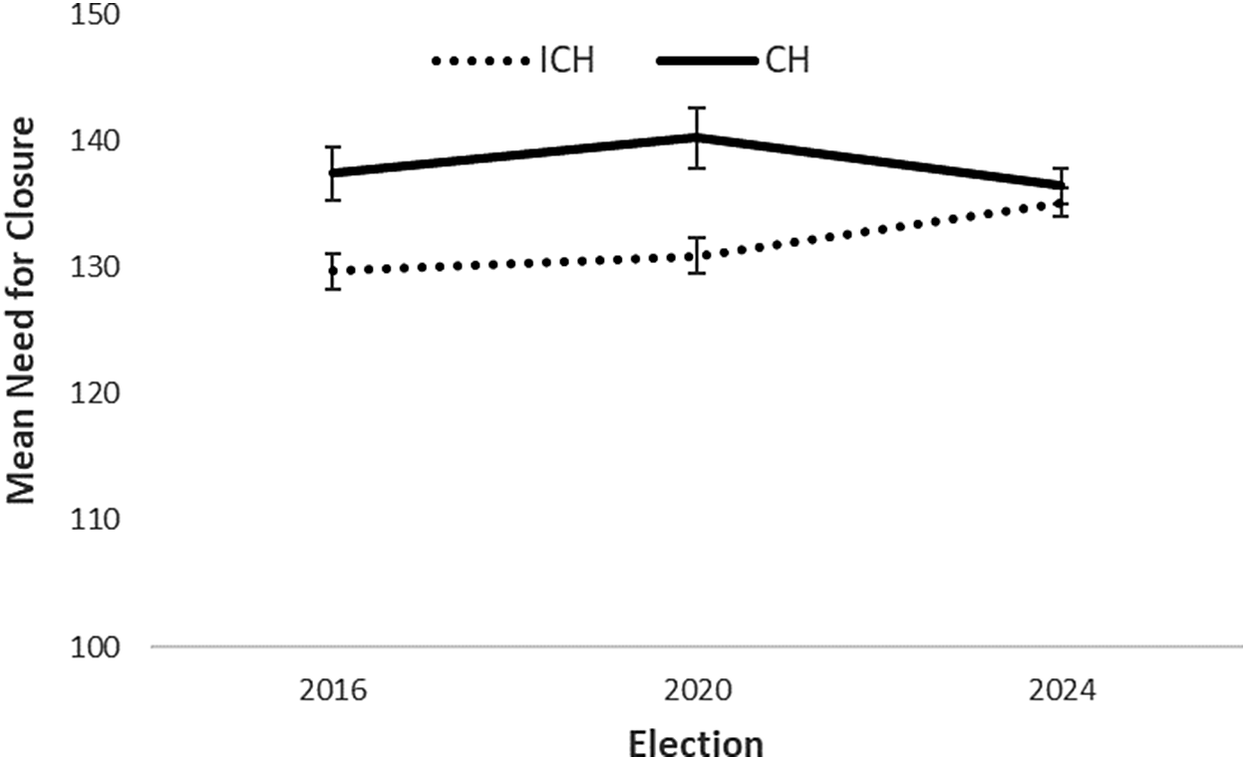

 Open access

