Introduction
Breast cancer detection using microwave imaging system (MIS) is a non-ionizing method and has more advantages such as low-cost, non-painful, and sensitive in comparison to the X-ray mammography system [1–Reference Shahzad3]. The MIS operates based on the fact that the electrical properties of healthy tissues are different from those of a malignant tumor [Reference Surowiec, Stuchly, Barr and Swarup4, Reference Lazebnik, McCartney, Popovic, Watkins, Lindstrom, Harter, Sewall, Magliocco, Booske and Okoniewski5].
In radar-based MIS, a UWB pulse is transmitted into the imaging area, that is, the breast in this work, employing the transmitter (Tx) antennas and scattered signals are received by the receiver (Rx) antennas. Data acquisition in UWB radar-based systems can be classified into three groups: monostatic, bi-static, and multi-static. In the monostatic imaging systems, transmitting and receiving data are done via the same antenna, which can be physically repositioned over the exterior of the breast or fixed as an element of an antenna array. In the bi-static, each element of a fixed-element array illuminates the breast sequentially while the rest of the elements record scattering data at various angles from the transmitter boresight. In multi-static systems, both acquired data in monostatic and bi-static are used. Therefore, more information about the breast can be obtained in the third group [Reference Kwon, Son and Lee6]. To create radar images, a variety of image reconstruction (IR) algorithms have been proposed by several research groups, which can be grouped into two categories: data-independent and data-dependent beamforming methods [Reference Li and Hagness7–Reference Byrne and Craddock15]. Some promising data-independent algorithms are delay-and-sum (DAS) [Reference Li and Hagness7], delay-multiply-and-sum [Reference Been Lim, Thi Tuyet Nhung, Li and Duc Thang8], microwave space-time [Reference Bond, Li, Hagness and Van Veen9], improved-delay-and-sum [Reference Klemm, Craddock, Leendertz, Preece and Benjamin10], beamformers, etc. [Reference Shahzad3, Reference Conceicao, Mohr and O'Halloran11, Reference Yin, Ali and Reyes-Aldasoro12]. In comparison with the DAS beamformer, enhanced performance of clutter rejection can be achieved by the rest of the algorithm of this group due to additional processing to the DAS algorithm [Reference Conceicao, Mohr and O'Halloran11]. In contrast to the data-independent methods, the data-dependent algorithm involves further processing of the measured data based on the second-order statistics (e.g. variance) to reduce the levels of noise and clutter in the imaging profiles. These methods need a priori knowledge of the array steering vector corresponding to the arriving signal, which is relatively more difficult in realistic breast imaging scenarios. A number of robust data-dependent beamformers are multistatic adaptive microwave imaging [Reference Xie, Guo, Xu, Li and Stoica13], multi-input multi-output [Reference Chen, Craddock, Kosmas, Ghavami and Rapajic14], wideband time-domain adaptive beamforming [Reference Byrne and Craddock15], etc.[Reference Conceicao, Mohr and O'Halloran11]. In general, the most important issues to design a successful IR method are: higher tumor detection ability, accurate localization, and fast computation speed. However, the confocal microwave imaging algorithm or DAS algorithm is the basis for the vast majority of the proposed breast imaging algorithms [Reference Li and Hagness7, Reference Conceicao, Mohr and O'Halloran11].
The recorded signals at each Rx element consist of intra-elements coupling, the incident signal, the skin response, the response of the internal tissues of the breast, and the multi-reflections between the tissues [Reference Meaney, Fanning, Li, Poplack and Paulsen16]. Before applying any IR method, the tumor response should be extracted from the received signals precisely; therefore, various calibration methods have been presented to remove artifact effects (related to the mutual coupling, skin, and multi-reflections) from the received pulse. The simplest method is carried out by subtracting the received signals of the breast model without tumor/tumors from those of the breast model with tumor/tumors [Reference Lai, Soh, Gunawan and Low17], this technique (also known as ideal calibration) is not feasible in the clinical diagnosis as the received signals without tumor are not generally available. Consequently, several methods have been introduced corresponding to the limitation of the ideal calibration [Reference Fear, Li, Hagness and Stuchly18–Reference Maskooki and Gunawan27]. In [Reference Fear, Li, Hagness and Stuchly18], a simple averaging technique was presented. In this method, a signal is recorded from the channel of interest, then this signal is subtracted by the average value of the recorded signals from all other channels in order to extract the tumor response of the channel of interest. To compensate for channel-to-channel variation due to local variations in the skin thickness, the averaging method was improved by the Woody Averaging (WA) method [Reference Fear and Sill19]. Despite a better compensation of the non-uniform skin's effect in the WA method, sometimes the artifact effects can not be removed efficiently. Thus, an improved method of using the Wiener Filter (WF) was introduced in [Reference O'Halloran, Jones and Glavin20]. Compared to the previous techniques, this method requires a priori knowledge of the skin's time-location in the early stage of each signal to be calibrated. In [Reference Sill and Fear21], the root least squares filter based on updating WF weights was presented. In addition, a hybrid Artifact removal technique by using the entropy-based time windowing and WF was introduced for the mono-static and multi-static scenarios [Reference Zhi and Chin22–Reference Elahi, Shahzad, Glavin, Jones and O'Halloran24]. Besides the mentioned techniques, some calibration approaches, such as the differential rotation, and the independent component analysis apply a mechanical rotational array [Reference Klemm, Leendertz, Gibbins, Craddock, Preece and Benjamin25, Reference Byrne, Mantalena and Craddock26]. In [Reference Klemm, Leendertz, Gibbins, Craddock, Preece and Benjamin25], the first data are subtracted from the dataset acquired by a specific-angle rotated array. In [Reference Byrne, Mantalena and Craddock26], first, the skin response of each recorded signals is estimated by maximizing entropy, and then the estimated signal subtracted from the original signal. In addition to the mentioned time-domain preprocessing, the skin artifact can be removed using the frequency response of each recorded signal [Reference Maskooki and Gunawan27]. Briefly, the main challenges for preprocessing calibration techniques are: precision estimation of the skin response, proper compensation of channel to channel variations, and efficient suppression of the artifact effects.
In this paper, we present a novel high-accuracy calibration (HAC) method to extract the reflected tumor signals. By applying the proposed HAC method, all time delays of transmission channels are taken into account, and the late-stage of recorded signals can be estimated accurately. Therefore, the time-dependent location of target/targets can be extracted with high accuracy and the artifact effects can be reduced more efficiently. The advantage of the HAC method is that more energy becomes available at tumor location relative to the background in comparison to conventional methods. Additionally, to gather the calibrated signals at each focal point, an improved data-independent 3D back-projection algorithm based on Fermat's principle [Reference Schuster28] is presented. The superiority of the proposed 3D back-projection method over existing data-independent algorithms is that the focal points are scanned regarding the vision area of antennas for each calibrated signal. At the same time, the coherent reflected signals from the targets are achieved and sum by a better approximation of transmission channels, and consequently scanning time is decreased.
Section “Proposed breast cancer detection system” details the geometrical of the applied breast cancer radar imaging system and antenna array configuration. The details of the proposed skin calibration and imaging methods are presented in section “Proposed calibration method with an improved 3D back-projection approach”. Validation of the proposed approaches for detection of cancerous tumor location using the simulated results is investigated in section “Results and discussion”; followed by the conclusion in section “Conclusion”.
Proposed breast cancer detection system
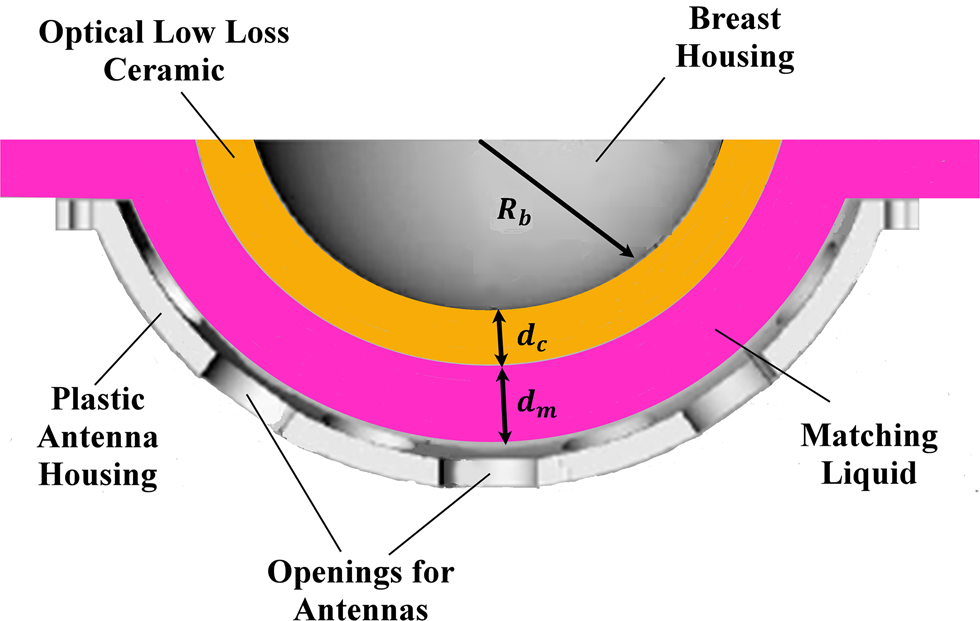
One of the successful MISs for early-stage breast cancer applications is the MARIA system, which is developed by researchers at the University of Bristol [29]. This system applies a hemispherical setup for a patient in the prone position as shown in Fig. 1. In this system, the elements of the conformal array are immersed into a matching medium/liquid to mitigate the skin reflections. Then, a hemispherical-shell ceramic is used to accommodate the cup size of the breast which is placed on the top of the matching medium. Before the insertion of the phantom into the mentioned ceramic, a small amount of the matching liquid is applied to ensure there are no air gaps present [Reference Byrne and Craddock15, Reference Byrne, Mantalena and Craddock26, Reference Klemm, Klemm, Craddock, Leendertz, Preece and Benjamin30]. The setup of the MARIA breast cancer system is shown in Fig. 1.
The measurement setup of MARIA breast cancer detection system [Reference Byrne and Craddock15, Reference Byrne, Mantalena and Craddock26, Reference Klemm, Klemm, Craddock, Leendertz, Preece and Benjamin30].

The breast model
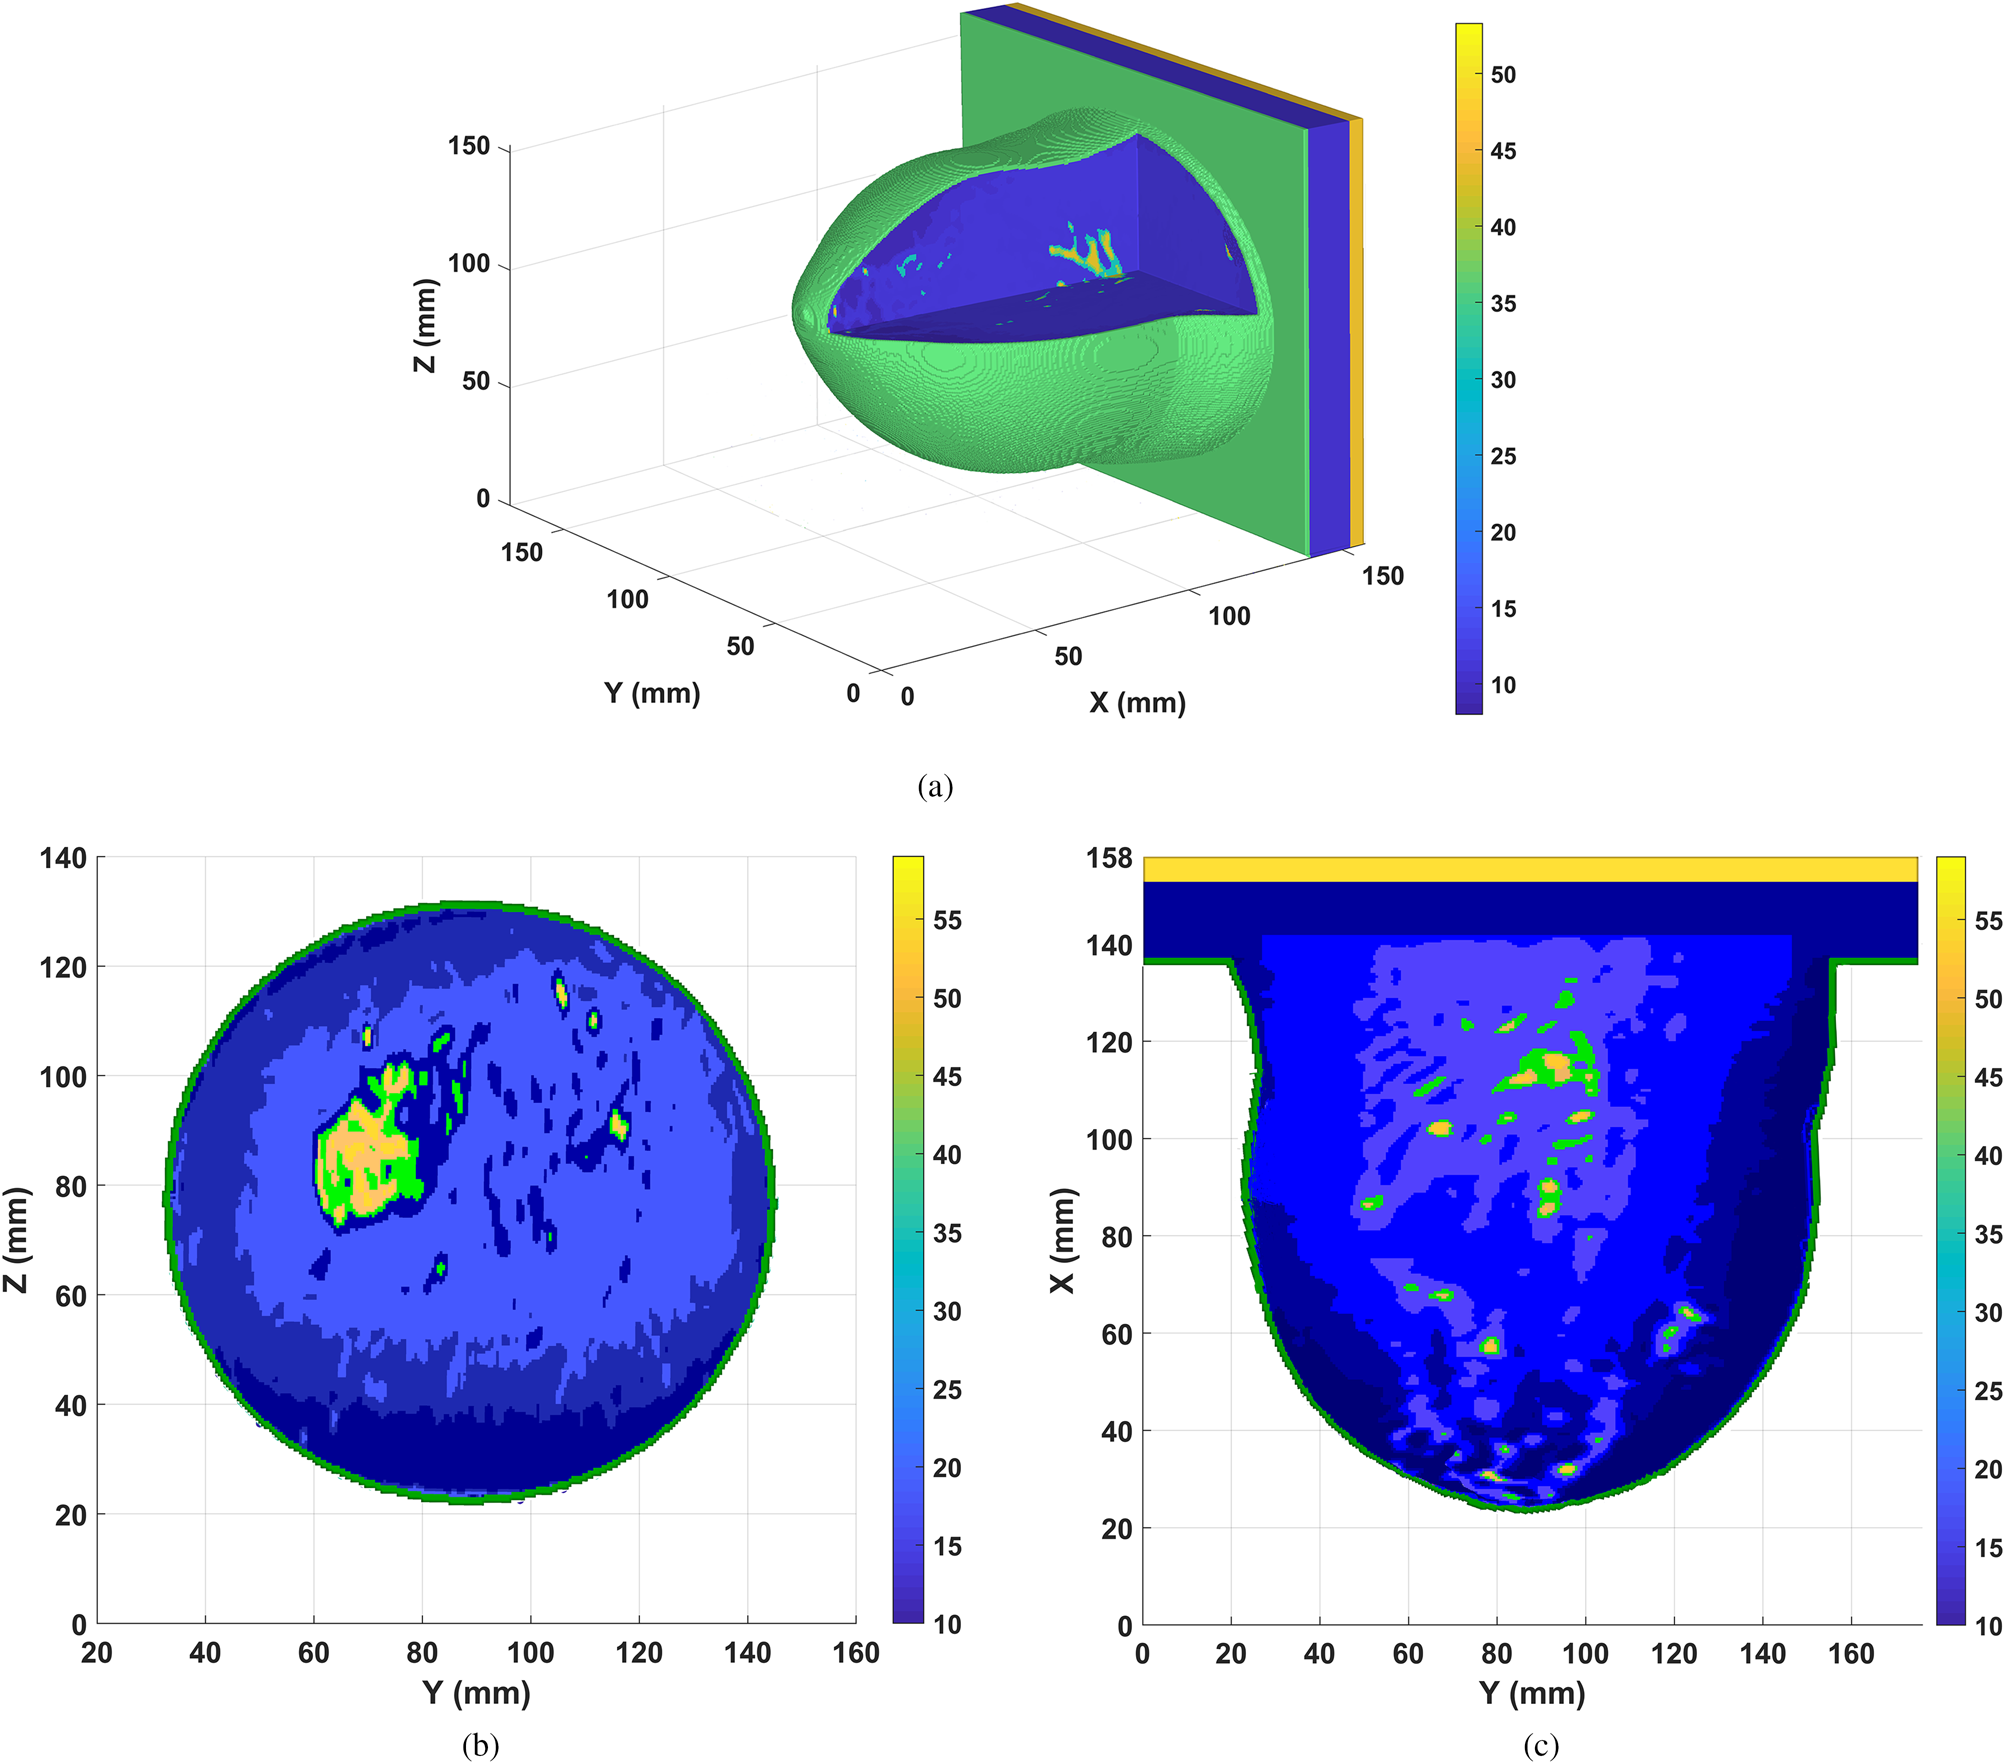
In this study, MRI-derived Class II (scattered fibro-glandular) breast phantom from UWCEM MRI breast cancer repository is applied [31]. This model consists of 316 × 352 × 307 voxels, having fine resolution 0.5 × 0.5 × 0.5 mm3. To construct the desired phantom in CST microwave studio software [32], three steps are employed. First, a 3D structural data of the breast tissues regarding the particular number of each tissue in [31] is created; then a corresponding material or binary file including dielectric properties of all tissues based on single-pole Debye model is built in MATLAB [Reference Lazebnik, Popovic, McCartney, Watkins, Lindstrom, Harter, Sewall, Ogilvie, Magliocco, Breslin, Temple, Mew, Booske, Okoniewski and Hagness33, 34]. Finally, a voxel file to import the structured data to CST software is generated. This voxel file contains the information about the dimension of the breast model which is related to the structural file and is linked to the material file.
The MRI-derived breast phantom at 4.5 GHz is illustrated in Fig. 2, while the colorbar shows the relative permittivity of each tissue. The part of breast is inserted into breast housing mapped to a hemispherical profile, representing the ground truth model as employed in [Reference Byrne and Craddock15], and shown in Figs 2(b) and 2(c) at X-slice and Z-slice, respectively.
The MRI-derived Class II (scattered fibro-glandular) breast model at 4.5 GHz (a) 3D view of basic breast model (b) ground truth at X-slice, (c) ground truth at Z-slice.

Antenna performance and array configuration
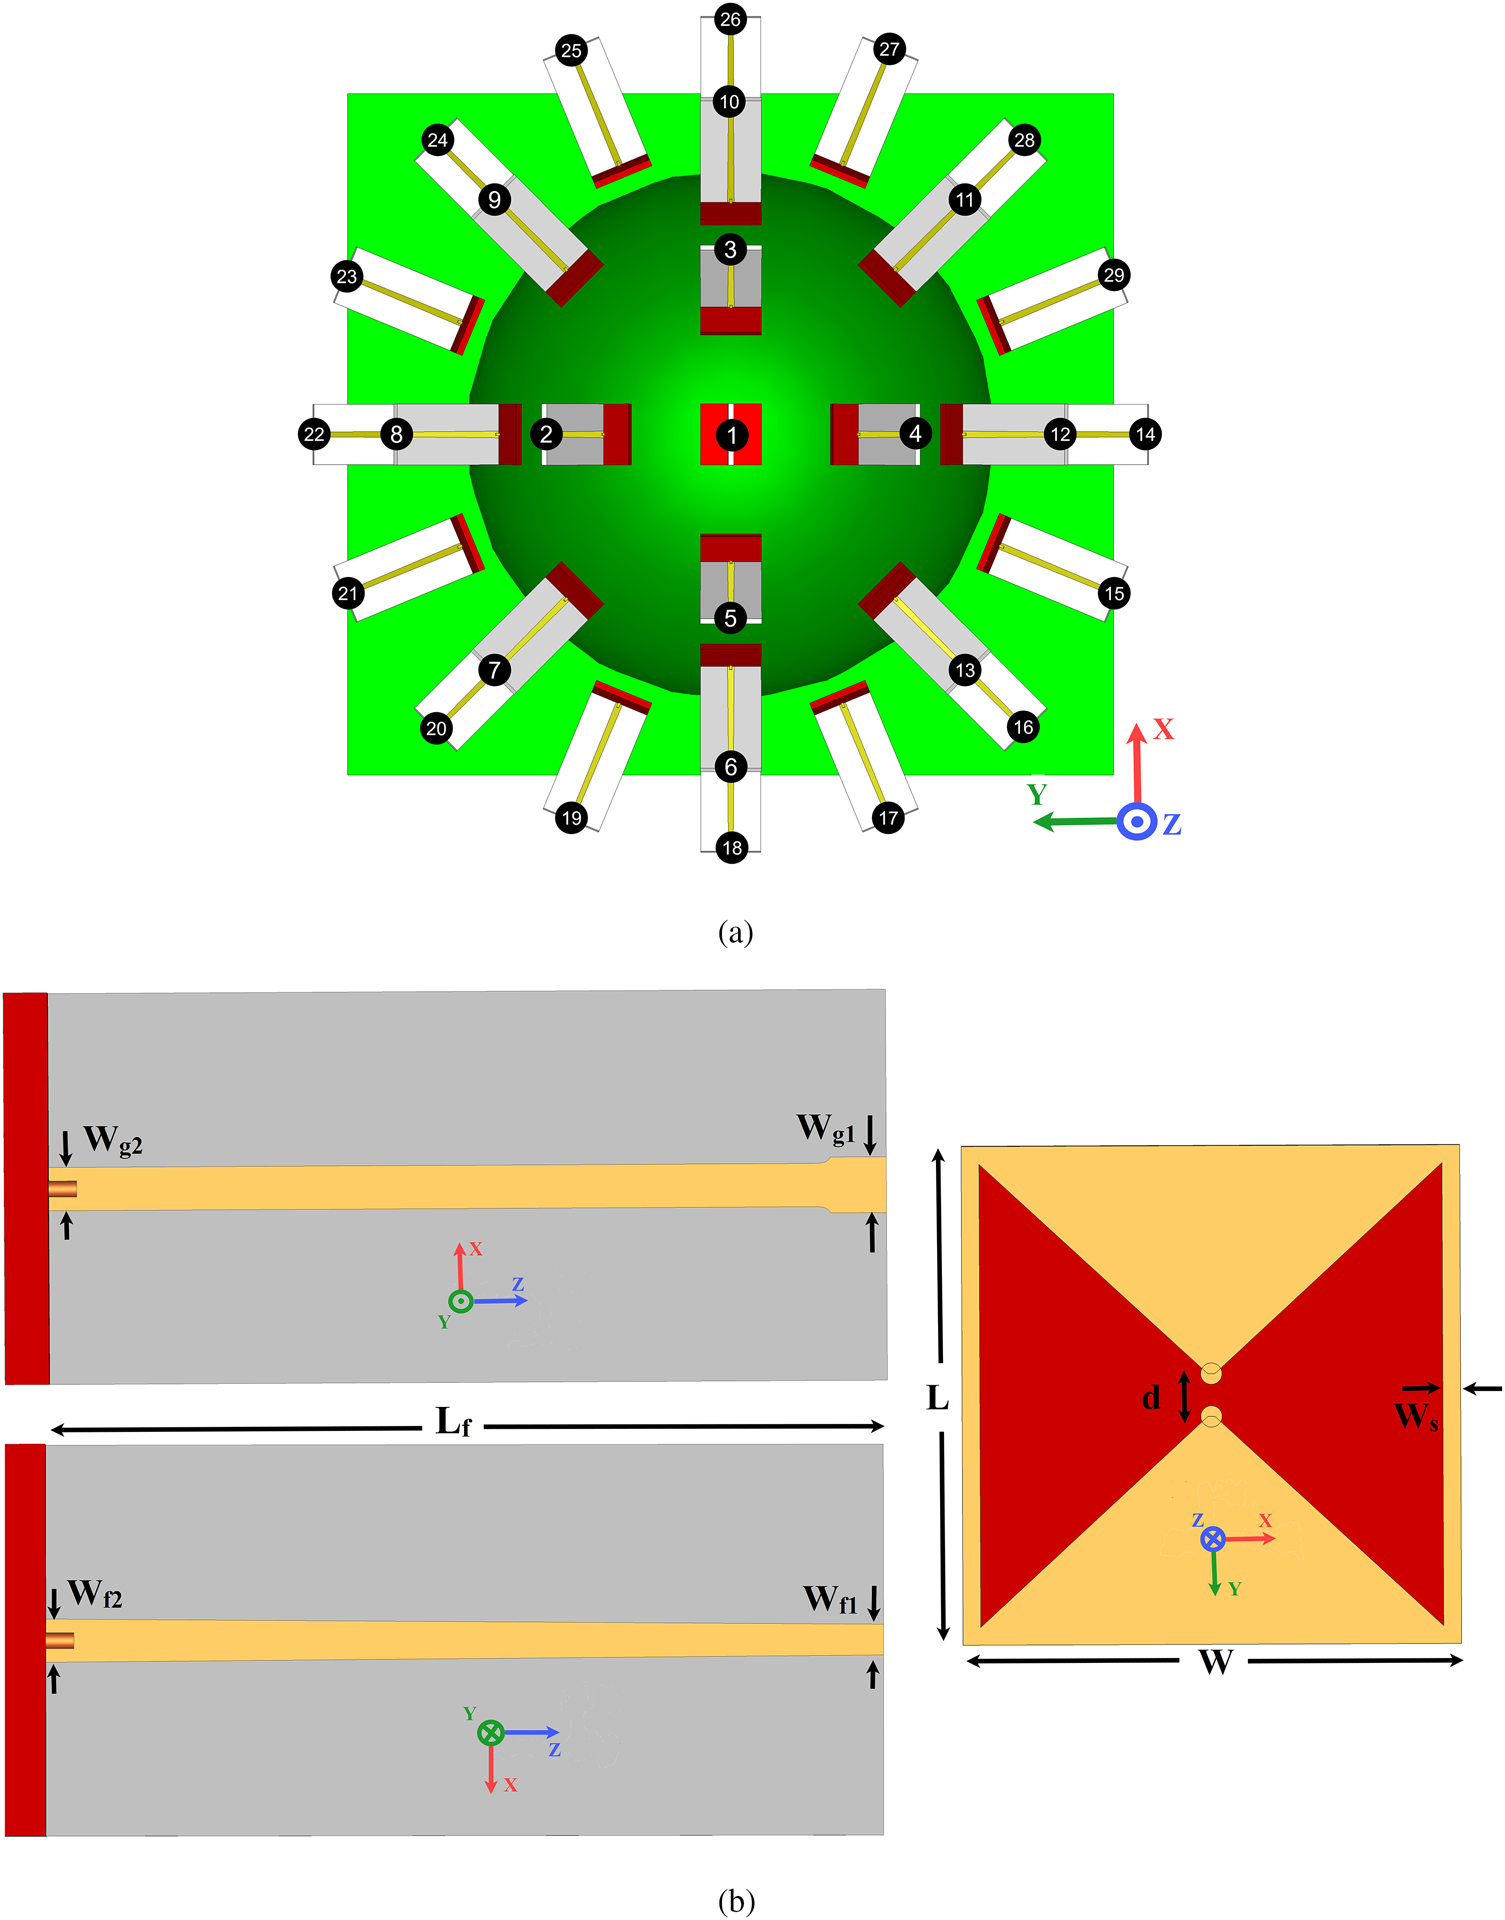
A hemisphere antenna array encircled the breast at equal distances d a = 7 mm (d a = d c + d m), from the skin as shown in Fig. 3. The elements of the array are arranged in three enclosed contours (rows) and one antenna is placed at the top of the hemisphere breast housing as depicted in Fig. 3(a). In the first row, the difference angle between two adjacent elements is chosen to be 90°, while that of the second and third rows are selected to be 45° and 22.5° with respect to self-central points, respectively. Also, the difference angle between each row and the next one is selected to be 25° uniformly, relative to the center point of the coordinate system (see Figs 1 and 3). As shown in Fig. 3(a), the total number of array elements around the breast model is N = 29 according to the proposed arrangement. The reason behind choosing this number element is that it will bring an acceptable amount of data from inside the breast. Although a large number of elements (dense array) can give a larger amount of data about the breast, it may increase the cost, weight, complexity of the system, and it will be more time consuming to collect the data [Reference Morabito35]. Therefore, employing the sparse arrays based on compressive sensing theory can be a more practical solution considering the limitation of applying dense arrays [Reference Morabito35, Reference Zhu, Zhao, Wang, Song and Liu36].
(a) Array configuration around the breast model. (b) The schematic of the applied bowtie antenna in different plane views of the coordinate system setup.

The utilized elements of the array are a modified version of the implemented bowtie antenna in [Reference Jalilvand37]. The schematic of the antenna element at different views is illustrated in Fig. 3(b). As shown in the figure, the antenna consists of two sections: a radiator, which is assembled on a Rogers 5880 substrate (ɛ r = 2.2 and the thickness of 1.57 mm) and a balun feeding structure printed on a Rogers 6010 substrate (ɛ r = 10.2 and the thickness of 1.27 mm).
According to MARIA's setup, the background material of the simulation environment is set as a dispersive matching medium with the effective permittivity of ɛ m = 10 and conductivity of σ m = 0.5S/m at 4.5 GHz. Therefore, the obtained optimal dimensions (in [mm]) of the antenna to be operated in the frequency range of 1.3–6.8 GHz within the matching medium are: W = 14, L = 14, d = 1.5, Ws = 0.5, Lf = 30, Wg 1 = 2, Wg 2 = 1.55, Wf 1 = 1.1, Wf 2 = 1.55.
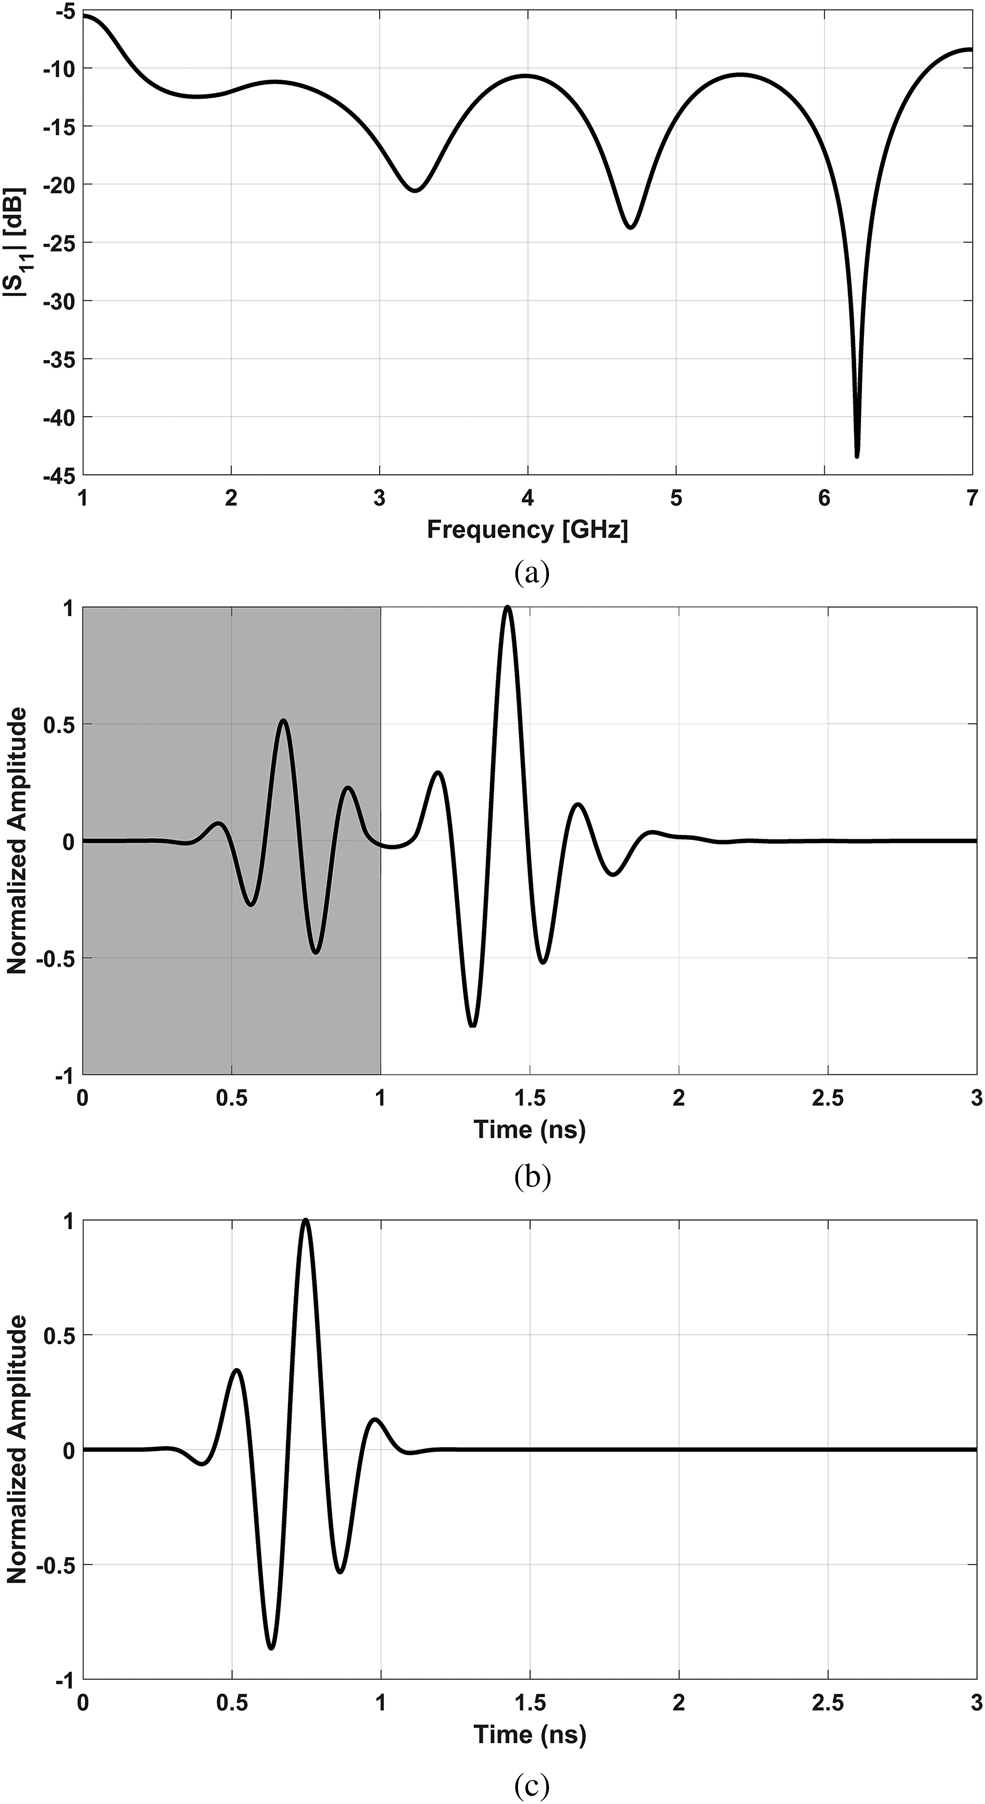
The frequency and time-domain characteristics of the proposed antenna in the matching medium are illustrated in Figs 4(a) and 4(b), respectively. It must be noted that the generated incident voltage of antenna is selected as a modulated Gaussian pulse with time-width τ p = 0.95 ns as depicted in Fig. 4(c). This type of pulse presented good results for time-domain analysis of microwave imaging [Reference LaComb and Mileski38]. As shown in Fig. 4(a), the modified bowtie antenna operates in the frequency range of 1.3–6.8 GHz when |S 11| ≤ −10 dB. Also, from Fig. 4(b), it can be seen that the normalized time-domain response of the antenna consists of two Gaussian pulses, where the generated early-stage pulse may be due to the reflection of balun feeding, while the late-stage one is the time-domain response of the radiator section.
(a) The return loss of the applied bowtie antenna. (b) Time-domain response of the antenna. (c) The generated incident signal in the time domain.

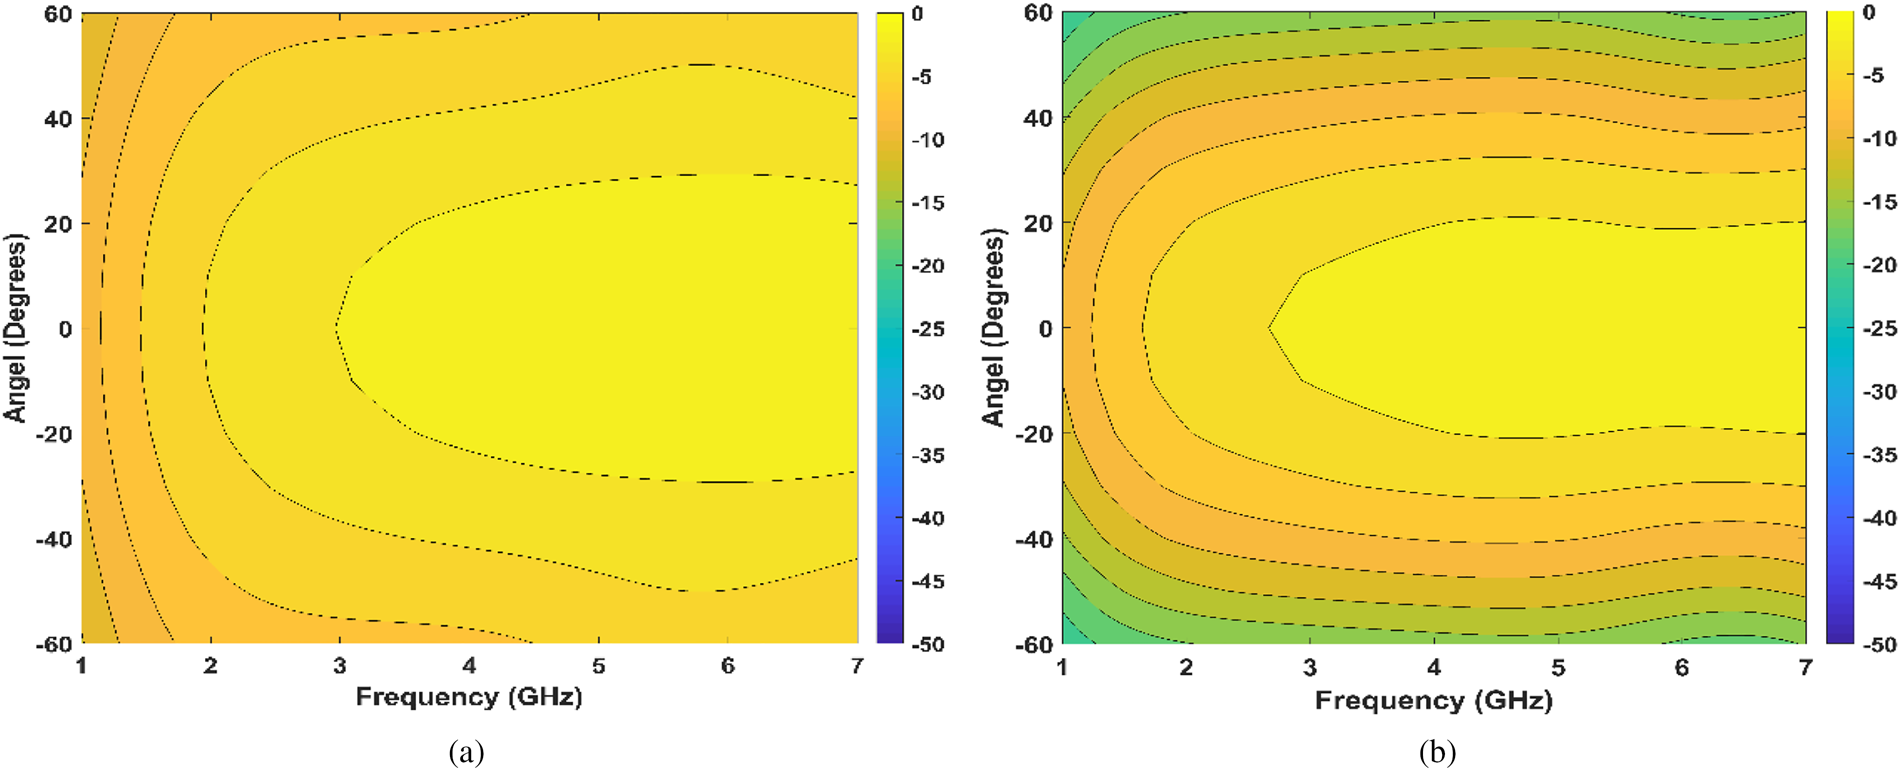
Another important characteristic of the proposed antenna for breast cancer detection is near-field performance. To evaluate the near-field radiation characteristic of the antenna in matching medium, the simulated Ey component has been sampled at points along the arcs with a radius 50 mm from the center of the front face of antenna's radiator. As can be seen in Fig. 5, the E-plane and H-plane patterns are radiated symmetrically along boresight direction. Also from this figure, we can see the designed antenna shows approximately around 60° and 30° for 6 dB beamwidth of E-plane and H-plane, respectively.
The simulated near-field radiation pattern of the proposed antenna inside matching medium, which the normalized Ey field component has been plotted versus the angle from boresight and frequency, (a) E-plane, (b) H-plane.

Proposed calibration method with an improved 3D back-projection approach
In this section, first, the suppression of the skin, intra-elements coupling, and incident signal effects are performed for the recorded multi-static signals in time-domain, X m,n(t), where the index m specifies the number of mth receiver antenna (Rxm) when the breast is illuminated by the nth transmitter element (Txn). Then, the time-dependent location of tumor(s) response through processing the scattered signals is extracted. Finally, post-processing using an improved back-projection IR method is employed to radiate signals into the breast medium in a better approximation of transmission channels.
Proposed preprocessing HAC for artifact removal
In order to remove the artifact and extract the mixed tumor response from the recorded multi-static signals, the late-stage location of available data is estimated in the first step of the proposed preprocessing. Generally, the majority of early-stage parts of the recorded signals consist of incident signals, strong reflections from the skin tissue, and the intra-elements coupling effects. Thus, to estimate the late-stage parts, the time-delay by antennas themselves, which is denoted by τ ant, and the time delay (which is caused by the distance between the positions of Tx and Rx antennas), denoted by τ TR, are calculated. Basically, the τ ant is defined as the required time to emit the wave from the antenna exterior regarding the excitation signal at the feeding port, while the parameter τ TR is equal to the direct distance between the Tx and Rx which is divided by wave speed in free-space. Considering the time-width of the incident signal τ p, the location of the late-stage part at each multi-static transmission channel's signal can be estimated as

where the width of τ LT is approximated by τ p. In general, there is no optimal value for the time-width of τ LT. As the corresponding value has been determined 50% longer than τ p in [Reference Klemm, Klemm, Craddock, Leendertz, Preece and Benjamin30], whereas this value is set to τ p in [Reference Byrne, Mantalena and Craddock26]. So, it is not possible to acquire an optimal value as the scanning area is a dispersive medium and it is required a priori knowledge about the size of target and phantom [Reference Byrne, Mantalena and Craddock26]. Obviously, Eq. (1) may change slightly in a system with different size of phantom and operating frequency. However, the mentioned equation gave the best results for our proposed system. As a result, the proposed preprocessing HAC can be a proper initial choice to estimate the late-stage of recorded time-domain multi-static signals.
In the second step, the data values before and after of time range τ LT are set zero. Finally, to extract the mixed tumor response in the late-stage of each channel signal X m,n, the recorded signals' average value for the other channels, experiencing similar relative polarizations and the distance between Tx and Rx path, is subtracted from that of interest as following

where $\bar{X}_{m\comma n}^s$ and Y m,n are the average value of late-stage for the similar channels, and the calibrated signal of Txn − Rxm channel, respectively.
Focusing and improved 3D back-projection method
The hemispherical imaging area (inside of the breast housing) is divided into 316 × 352 × 307 segments (equal to the number of voxels in the MRI-derived phantom), and the center point of each segment is specified by P f(x f, y f, z f) as focal points.
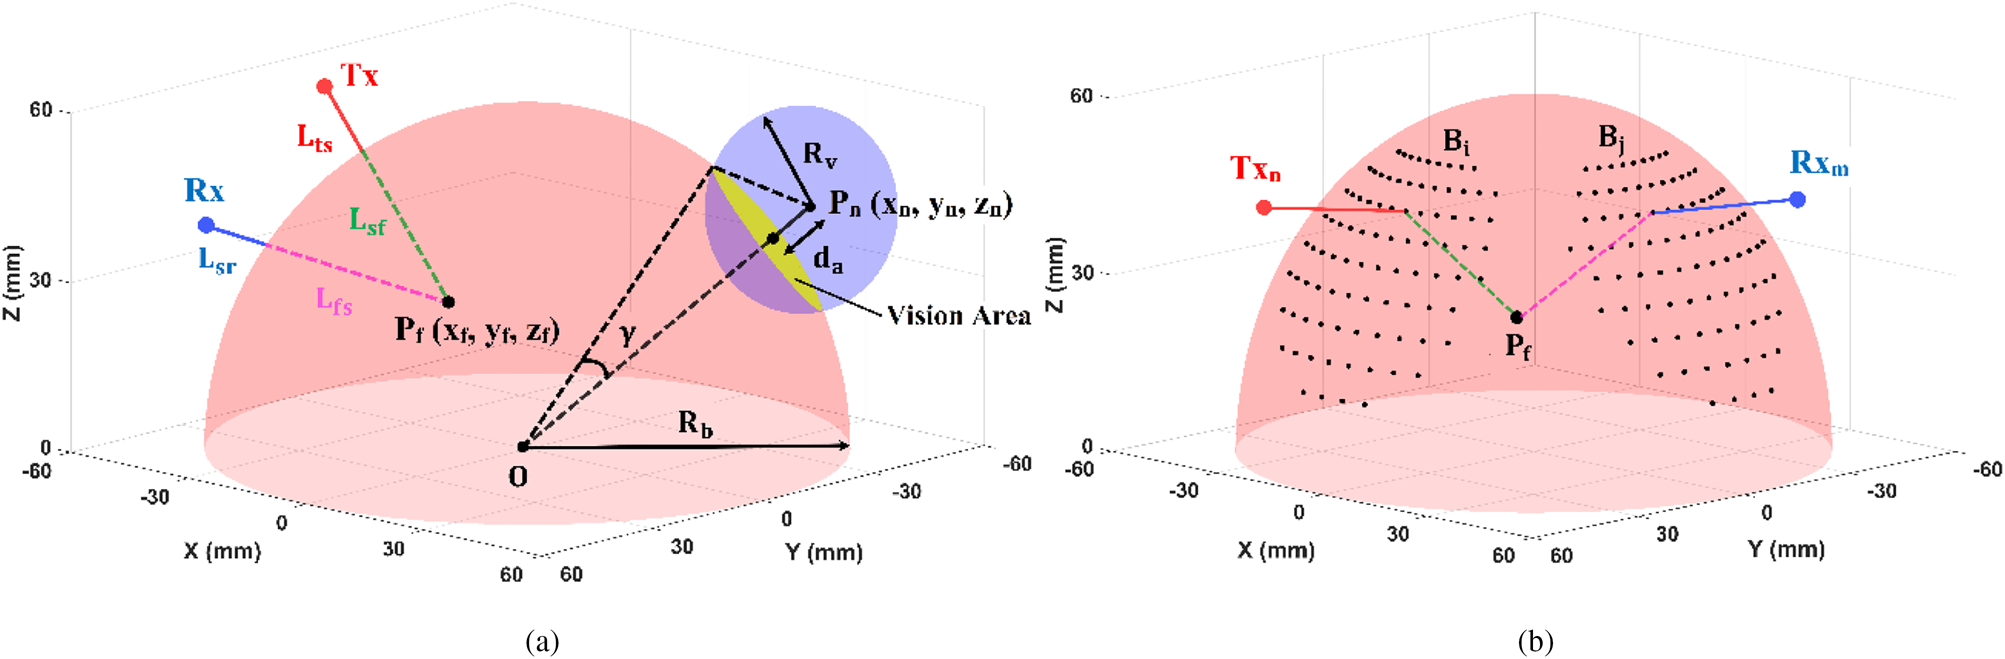
As is shown in Fig. 6, the propagation path from the Tx antenna to each focal point inside the breast consists of
• a route in coupling medium and ceramic shell L ts, from the Tx element to the surface of breast housing.
• a path inside the breast L sf, extending from the surface of breast housing to the investigated focal point.
Thus, these two paths will be traveled from the hypothetical focal point to the Rx element and vice versa, which are denoted by L fs and L sr, respectively.
Path selection between Tx and Rx antennas across a hypothetical focal point Pf, based on Fermat's principle, (a) the vision area of nth antenna, (b) the locus of vision areas for Tx nand Rx m.

During the focusing, the focal point moves from one position to another within the scanning area. According to Fermat's principle [Reference Schuster28], the wave is propagated along the shortest possible electrical path. Therefore, to estimate the shortest electrical path of the propagated signal from the Txn to the focal point (Pf) and from the Pf to the Rxm which is denoted by D n,m, the vision area of the mentioned element antennas must be specified on the skin–ceramic interface. To reach this goal, the hemisphere beast housing Hb, and the spheres (with the central point of element positions) Sn, n = 1, 2, …, N (N is the number of elements) are intersected as shown in Fig. 6. Thus, the intersection of the Hb and Sn can be obtained by solving the following system of equations:

where O (x b, y b, z b) and Pn (xn, yn, zn) are the central point of the breast housing and the position of nth antenna, respectively, and d a (=d c + d m) is antenna distance from the surface of breast housing while the radius of breast housing is considered R b (see Fig. 1). Regarding Fig. 6(a), the solution of Eq. (3) can be investigated in the following situations:
• If R v < d a, the sphere Sn does not intersect the hemisphere Hb.
• If R v = d a, the sphere Sn touches the hemisphere Hb at one point.
• If R v > d a, the sphere Sn intersects the hemisphere Hb and the resultant cross-section may be a circle or a portion of a circle depending on the position of the element Txn/Rxm around the breast.
It must be noted that the hemisphere Hb may lie entirely in the interior of the sphere Sn for a very large value of Rv. In this condition, the intersection cannot occur.
From each element's point of view, the maximum cross-section on the surface of breast housing occurs when two curves Hb and Sn are to be orthogonal. In this situation, sinγ = R v/(d a + R b) and γ = cos−1(R b/(d a + R b)). Consequently, by varying the R v in the range of d a ≤ R v ≤ (d a + R b)sinγ with a relatively small step-size, the boundary points of the vision area on the hemisphere breast housing can be determined. Figure 6(b) shows the vision area of Tx n (x, y, z) and Rx m (x, y, z) elements on the skin–ceramic interface, which are specified by boundary points B i (x,y,z) and B j (x, y, z), respectively, where i = 1, 2, …., I and j = 1, 2, …., J. As a result, the shortest electrical path (D n,m) based on the position of the Tx n, Rx m, and the focal point P f can be calculated by the equation:

where $n_m = \sqrt {{\it \varepsilon} _m}$ is the effective refractive index of the matching medium and ceramic and $n_b = \sqrt {\varepsilon _{eff}}$
 is that of the breast area. It must be noted that the effective permittivity of the matching medium and ceramic is equal at the center frequency of the proposed system and the ɛ eff is approximated based on the effective permittivity in [Reference Sarafianou, Craddock, Henriksson, Klemm, Gibbins, Preece, Leendertz and Benjamin39].
After determining B i and B j in Eq. (4), the corresponding time delay can be determined using the following formula:

where c is the wave speed in the free-space. Finally, the DAS beam-former is applied to obtain the multi-static image [Reference Li and Hagness7] as following:

where I(P f) specifies the energy of each focal point, and weighting factor w m,n is applied to compensate for the path-dependent attenuation along Txn − Rxm regarding tissue losses [Reference Dove40].
Briefly, in the proposed focusing algorithm, first, all the possible transmission paths which are placed within the vision area of the Txn and Rxm elements are constructed for a given focal point, then the optimal path (the shortest electrical path) is realized, finally, the corresponding time-delay according to the optimal path is included in the beam-former for the channel signal Y m,n. Therefore, in comparison to conventional method [Reference Conceicao, Mohr and O'Halloran11], by discarding the paths which are not laid within the vision areas, scanning time can be decreased. In addition, the proposed method gives a better approximation for the transmission channels, thus the coherent signals (which are scattered from the target) can be sum constructively. However, the proposed improved back-projection method can be applied with any beam-former [Reference Li and Hagness7–Reference Byrne and Craddock15].
Results and discussion
In this work, before applying any calibration and imaging methods, a signal grouping based on the similarity artifacts in all transmission channels is employed. Generally, one group signal is formed by determining a high normalized cross-correlation threshold (NCC ≥ 0.98) between the recorded signals [Reference Martin and Crowley41]. To minimize the effect of polarization-mismatch on the transmission channels, the antenna #1 is rotated around the z-axis by 22.5° (regarding the position of elements in rows 1, 2, and 3). Obviously, all signals of monostatic channels X m,n(t) (where n = m) will have similar early-stage artifacts and can be collected into one group, while the similarity of bi-static signals X m,n(t) (where n ≠ m) is dependent on the polarization and distance between Tx n and Rx m antennas.
In the following subsections, the proposed HAC algorithm is compared with two well-known calibrations: WA and WF, and the practicality of our method is stated. To reach this goal, a small size of single and twin spherical tumors is embedded into the breast model and the performance of the mentioned practical algorithms is compared with ideal calibration as a useful benchmark of the best performance of the algorithms for target(s) detection. It must be noted that the proposed 3D back-projection method is applied to reconstruct images in all algorithms.
Tumor(s) detection in the noiseless and noisy environments
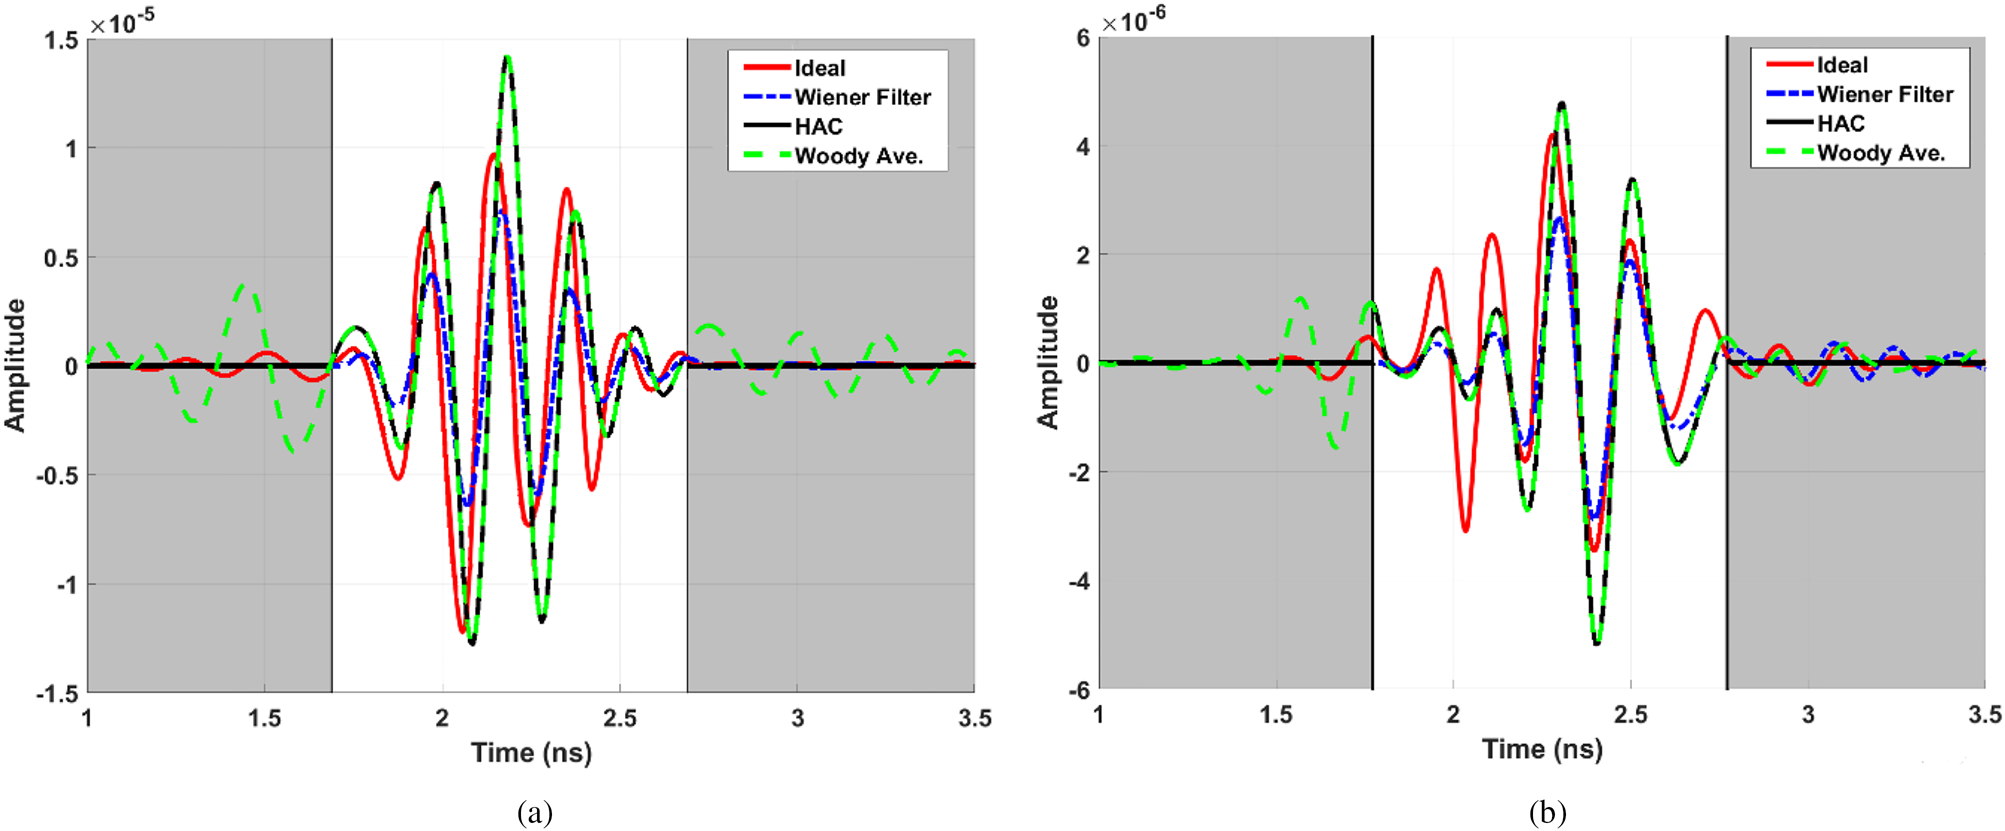
In scenario I, a single tumour with a radius of 7 mm is located at P (x = 0 mm, y = 30 mm, z = 30 mm). The calibrated signals using the ideal, WA, WF, and proposed HAC methods are presented in Fig. 7 for two cases: X 10,8(t) and X 26,14(t), while the estimated late-stage of the mentioned signals is shown in the white window. In addition to scenario I, the detection of a twin spherical tumors with the size of 7 mm which are placed at P 1 (x = −18 mm, y = 30 mm, z = 25 mm) and P 2 (x = 18 mm, y = 30 mm, z = 25 mm) is investigated in scenario II.
The extracted tumor response using the ideal calibration, Wiener Filter (WF), Woody Averaging (WA), and the proposed HAC methods for two cases of recorded signals, (a) X 1,8(t), and (b) X 26,14(t).

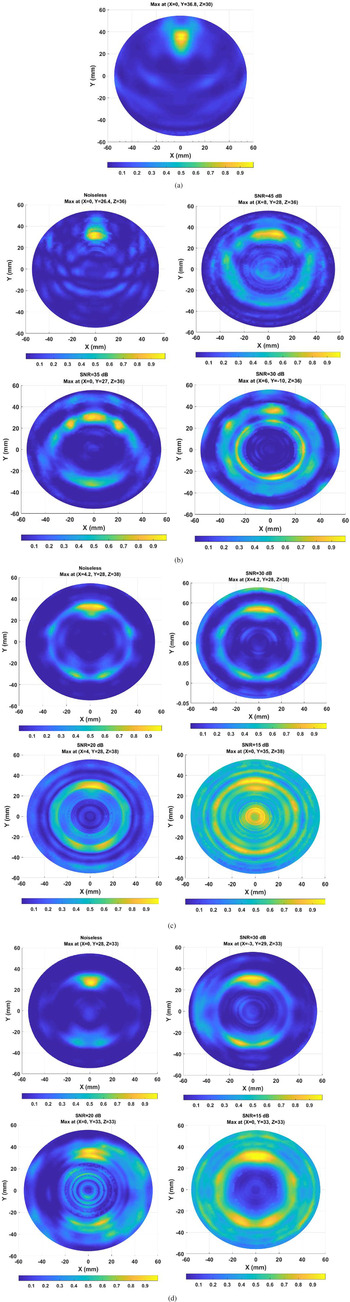
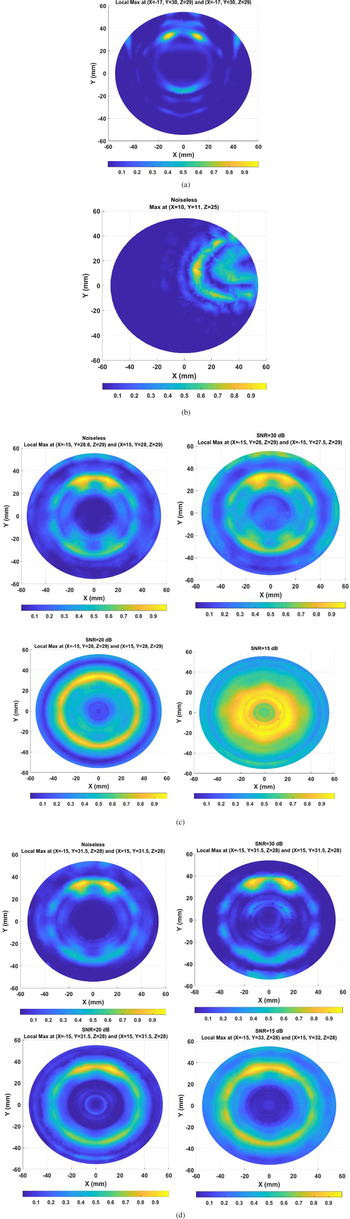
To study the performance of the proposed breast imaging system in real-life environment, different levels of white Gaussian noise are added to the recorded signals, then the feasibility of tumor detection using the proposed preprocessing and imaging algorithms is investigated for different values of signal to noise ratio (SNR). The resulted images of the proposed HAC method in comparison with the other practical calibration techniques in the noiseless and noisy environments are demonstrated in Figs 8 and 9 for scenarios I and II, respectively. It must be noted that the ideal calibration method is not feasible in the clinical diagnosis as it was mentioned before. Therefore, we ignored the investigation of noise effect on the performance of this method to detect the target(s). For a better comparison of the performance of the calibration methods in the presence of noise, the noise analysis is performed in a way that the possibility of detecting the target(s) with the minimum required level of SNR for each algorithm is to be specified.
2D reconstructed images from the improved 3D back-projection algorithm for scenario I, (a) ideal calibration, (b) Wiener Filter (WF) calibration, (c) Woody Averaging (WA) calibration, (d) the proposed HAC method.

2D reconstructed images from the improved 3D back-projection algorithm for scenario II, (a) ideal calibration, (b) Wiener Filter (WF) calibration, (c) Woody Averaging (WA) calibration, (d) the proposed HAC method.

Visual inspection of the resultant images for scenario I (see Fig. 8) indicates the target detection performance by using WF algorithm (see Fig. 8(b)) for SNR ≥ 35 dB, while this minimum required values of SNR are obtained 20 dB for both the WA (see Fig. 8(c)) and the proposed HAC (see Fig. 8(d)) methods. Also concerning the reconstructed images for scenario II in Fig. 9, the possibility of detecting the targets is achieved for SNR ≥ 15 dB by the proposed HAC (see Fig. 9(d)), while this feasibility is obtained for SNR ≥ 20 dB by using the WA method. It must be noted that we ignored the investigation of noise effect on the performance of the WF algorithm in scenario II since the targets are not detected by this method for the noiseless scenario. As a result, it can be seen in Figs 8 and 9 that the proposed HAC method shows the best performance for the gradual SNR reduction while the WF algorithm displays the worst performance in comparison with the others in the presence of noise. The most important conclusion obtained by comparing the resultant images between scenario I and II is that the minimum required SNR values to detect the targets for scenario I is higher than scenario II. Consequently, the proposed system is more sensitive in scenario II than scenario I in the realistic environment.
Quantitative analysis
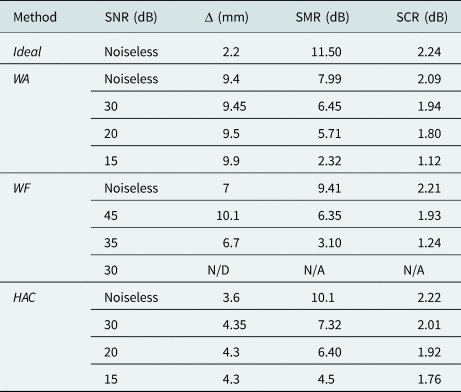
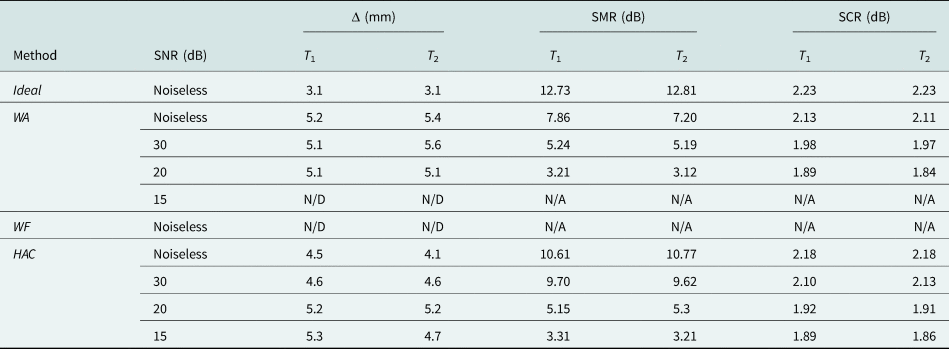
In order to evaluate the ability of the proposed method for the detection of tumor(s), several quantitative metrics are analyzed in this subsection. Let us assume B as all the points within the breast area and T as all the points located inside the target region. The following most commonly used metrics are investigated [Reference Bond, Li, Hagness and Van Veen9, Reference Loughlin, Oliveria, Galvin, Jones and Halloran42]:
• The metric Δ: which is defined as the absolute distance between the real center of the tumor, Tc and the predicted location of the tumor, which is estimated by the maximum energy on the reconstructed image I as following:
(7)$$\Delta = \Vert {\,p^\ast{-}T_c} \Vert \;{\rm where}\;p^\ast{ = } \arg {\rm max}\lsqb {I\lpar p \rpar } \rsqb \;\forall p\in B.$$

Consequently, the accuracy of the target location in the resultant images is specified by the parameter Δ.
• The metric signal to mean ratio (SMR): which is specified as the ratio of the backscattered energy's average value over the tumor area to the average value over the whole breast tissues, and given by:
(8)$${\rm SMR} = 10\log \displaystyle{{{\rm mean}\lsqb {I\lpar p \rpar } \rsqb } \over {{\rm mean}\lsqb {I\lpar p \rpar } \rsqb }}\matrix{ {\forall p\in T} \cr {\;\;\forall p\in B\;\;} \cr }\!\!\! .$$

Therefore, a high value of this metric indicates that the tumor can be identified easily from the reconstructed image.
• The metric signal to clutter ratio (SCR): which is used to investigate how much the energy of the tumor area is above the energy of the clutter, and can be written as follows:
(9)$${\rm SCR} = 10\log \displaystyle{{{\rm max}\lsqb {I\lpar p \rpar } \rsqb } \over {{\rm max}\lsqb {I\lpar p \rpar } \rsqb }}\matrix{ {\forall p\in T} \cr {\;\forall p\in B\;\& \;p\notin T\;} \cr } $$

Hence, the value of SCR quantifies the presence of any artifact at the location of the tumor inside the breast. If the artifacts are not effectively removed, the SCR will be low.
The calculated quantitative metric values for the images obtained from scenario I and II are listed in Tables 1 and 2, respectively. As the target(s) are not detected in one reconstructed image, their metric values are denoted by N/D (Not-Detected for the metric Δ) and N/A (Not-Assigned for the metrics SCR and SMR). It is clear that detection accuracy according to the metric values is the highest in the noiseless environments for both scenarios I and II. Also as shown in Tables 1 and 2, the metric values of the proposed HAC method is better than the WA, WF methods and are closer to those of ideal one for both scenarios I and II in the noiseless environments. Therefore, the higher amounts of the obtained SCR and SMR for the proposed HAC method prove the artifacts are removed more effectively. Also regarding the calculated metric values of Δ, it can be seen the predicted location of the target(s) using the HAC is closer to the real location of them in comparison with the other methods. Since the location of twin tumors T1 and T2 were not detected by the WF in the noiseless environment of scenario II (see Fig. 9(b)), their metric values are not specified in Table 2.
Quantitative metric values of the reconstructed images for scenario I

Quantitative metric values of the reconstructed images for scenario II

Quantitative investigations of scenario I and II in the noisy environment show the least SNR for a successful detection of the tumor(s) is obtained by using the proposed HAC method. In addition, it can be concluded that the proposed HAC shows a similar performance for the gradual SNR reduction in both scenarios I and II, while the possibility of tumor(s) detection usually occurs at higher values of SNR in scenario II by using the other methods. As a result, the proposed HAC algorithm can be a more practical method to detect the tumor(s) for a high-resolution breast cancer detection systems.
Conclusion
This paper presents a novel approach of HAC method for the breast cancer detection systems. By applying the proposed HAC, all time-delays of multi-static channels are taken into account, thus the time-dependent location of tumor response can be estimated precisely in the time-domain recorded signals of each transmission channel. Besides, an improved 3D back-projection algorithm is investigated in this paper. By employing this algorithm, a better approximation of transmission channels can be achieved based on Fermat's principle for the conformal setup of MIS. Therefore, the coherent reflected signals which are scattered from target(s) can be sum constructively. To validate the performance of the proposed methods for the breast cancer detection applications, a single and twin tumor targets are embedded within a realistic fibro-glandular breast. Obtained quantitative metric values of the reconstructed images reveal that the proposed calibration algorithm has a better ability to detect the cancerous tumor than the WA and WF methods. Besides, investigation of the effect of noise on the feasibility of detecting the target(s) shows the proposed MIS can be a good practical candidate for breast cancer detection applications.
 Mehdi Mehranpour received his B.Sc. degree in Electrical Engineering from Tabriz University, Tabriz, Iran, and M.Sc. degree in Telecommunication Engineering from Urmia University, Urmia, Iran. He is currently working toward the Ph.D. degree at Imam Khomeini International University, Qazvin, Iran. His research interests include microwave and radar imaging, numerical methods in electromagnetics, phased arrays, antennas and propagation, equivalent circuit models, reconfigurable structures, radar systems, signal processing, and electromagnetic theory.
 Saughar Jarchi received her B.S. degree in electrical engineering from the Amirkabir University of Technology, Tehran, Iran and the M.Sc. degree from the University of Tehran, Tehran, Iran. She received the Ph.D. degree in the field and wave communications from the University of Tehran in 2012. In 2012, she joined the Faculty of Technical and Engineering, Imam Khomeini International University (IKIU), Qazvin, Iran as an assistant professor. Her work background and research interests include metamaterials and plasmonics; applications of metamaterials and periodic structures in antenna enhancement providing compact, wideband, and high gain antennas, as well as the design of planar, low profile antennas for MIMO and biomedical applications.
 Ayaz Ghorbani received the Postgraduate Diploma, M.Phil. and Ph.D. degrees in communication engineering from the University of Bradford, Bradford, UK, in 1984, 1985, and 1987, respectively. Also he was on sabbatical leave from 2004 to 2005 in the same University. Since 1987, he has been teaching various courses in the Department of Electrical Engineering, Amirkabir University of Technology, Tehran, Iran. He has authored or co-authored more than 180 papers in various journals as well as different conferences. He has also written (in Persian) more than 10 books in the field of microwave engineering, radar, electromagnetics, and electromagnetic compatibility. Dr. Ghorbani received the John Robertshaw Travel Award and the URSI Young Scientists Award from Bradford University and the General Assembly of URSI, Prague, Czech Republic, in 1987 and1990, respectively. He also received the Seventh and Tenth Khwarizmi International Festival Prizes, for design and implementation of an anti-echo chamber and microwave subsystems in 1993 and 1995, respectively. He is currently a Professor in the Department of Electrical and Electronic Engineering, Amirkabir University of Technology, Tehran, Iran.
 Asghar Keshtkar was born in Ardabil, Iran, in 1962. He received the B.Sc. degree in electrical engineering from Tehran University, Tehran, Iran, in 1989, the M.Sc. degree in electrical engineering from the University of Khaje-Nasir, Tehran, in 1992, and the Ph.D. degree in electrical engineering from the Iran University of Science and Technology, Tehran, in 1999. He is currently a Professor with the Faculty of Engineering and Technology, Imam Khomeini International University, Qazvin, Iran. His current research interests include electromagnetism, electromagnetic launchers, antennas, and bio-electromagnetism.