Introduction
Accurate estimation of the biomass of winter wheat provides an important data source for precision fertilization, water management and growth monitoring. Biomass estimation based on remote sensing data can provide biomass values over large areas and its spatial distribution (Running et al., Reference Running, Thornton, Nemani and Glassy2000, Piao and Xu Reference Piao and Xu2004, Bao et al., Reference Bao, Gao and Gao2009, Zhao et al., Reference Zhao, Xu, Yang, Jin, Li and Xia2014). Remote sensing methods can compose of mechanism model methods, semi mechanism models or statistical regression models (Parton et al., 2003, Zhang et al., Reference Zhang and Zhou2008, Gao et al., Reference Gao, Pan and Fu2009). Due to some difficulties to get the thorough parameters required by the mechanistic and semi mechanistic models, a statistical regression model based on different vegetation indexes, such as the Normalized Difference Vegetation Index (NDVI) is a commonly used method to estimate biomass (Rouse et al., Reference Rouse, Haas, Schell and Deering1974, Zhao et al., Reference Zhao, Xu, Yang, Jin, Li and Xia2014). From former studies (Tucker and Sellers, Reference Tucker and Sellers1986, Paruelo et al., Reference Paruelo, Epstein, Lauenroth and Burke1997, Piao and Xu, Reference Piao and Xu2004, Lu, Reference Lu2006, Zhao et al., Reference Zhao, Xu, Yang, Jin, Li and Xia2014, Liu et al., Reference Liu, Ren, Chen, Tang, Wu and Li2016), the accuracy of statistical regression models mainly depends on the vegetation indexes, and usually the hyperspectral with narrow band can improve the estimation precision.
Comparing with satellite remote sensing, UAV based remote sensing is heavily influenced by clouds. An UAV, however, can work also under more complex weather, such as cloudy or heavily hazed conditions (Xia et al., Reference Xia, Zhang, Chen, Zhao and Jiang2016). UAV based remote sensing can provide data of different spatial resolution, of 10 cm or better, which cannot be achieved by the current commercial satellite data, e.g. Worldview 4 data with maximum resolution of 31 cm.
In this study, we calculated the NDVI and Ratio Vegetation Index (RVI) (Major et al., Reference Major, Baret and Guyot1990) based on band selection, and compared the performance between NDVI and RVI to evaluate winter wheat biomass using hyperspectral data with high spatial resolution.
Materials and Methods
The UAV flight experiment and the field biomass data collection was done on 15 Nov, 2016, at Xiaotangshan National Precision Agriculture Research Demonstration Base, Beijing, China. The content below is the detailed information about the instrument and experiment.
Instrument
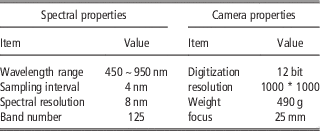
The hyperspectral device used in the application is a Cubert UHD-185 provided by the Cubert GmbH technology company which provides 125 bands from 450 to 950 nm with 4 nm sampling interval, more detailed information about this camera is shown in Table 1. The UAV used in this study was a DJI Spreading Wings s1000 and DJI A2 flight controller.
Basic parameter of the UHD 185 hyperspectral camera

Experiment
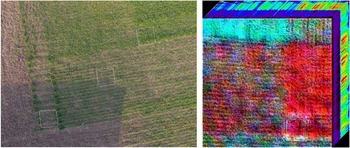
At the research demonstration base, the main crop is winter wheat, as presented in Figure 1 left. The UAV flew at 06:15 UTC, and the flight altitude was 20 meters. As shown in the Figure 1 (left), the size of the ground samples was 1 m * 1 m each, and 9 ground samples with different wheat coverages were arranged in the wheat field. After completing the flight, the hyperspectral data was converted to the file in TIFF format, as shown in Figure 1 (right). Then the aboveground biomass of every ground sample was obtained and weighed.
The ground samples (left, taken by Panasonic GH4) and the hyperspectral images cube with 125 bands (right, R(860 nm), G(550 nm), B(440 nm)).

Results
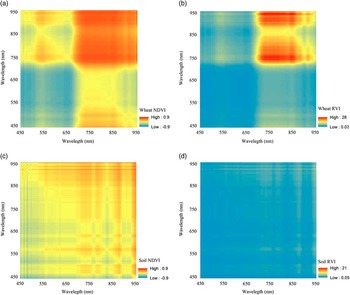
Unlike multispectral data, hyperspectral data usually cover more than one hundreds bands with narrow bandwidths. In order to get the most optimal bands to calculate NDVI and RVI, it is necessary to compare the performance of each band for these two indexes. In this study, every second band of all bands were selected to calculate the NDVI and RVI for the pixel covered with wheat and soil, as shown in Figure 2. In Figure 2, both the x axis and y axis present wavelengths with the unit nm. The wavelength increases from 450 nm to 950 nm from the lower left corner to top left corner on the y axis; wavelength also increases from 450 nm to 950 nm from the lower left corner to bottom right corner on the x axis.
The NDVI RVI for every two bands, (a) NDVI for a wheat pixel, (b) RVI for a wheat pixel, (c) NDVI for a soil pixel, (d) RVI for a soil pixel.

As can be found in Figure 2, both the NDVI and RVI can indicate the wheat growth status well (Figures 2 (a) and (b)). Comparing the NDVI and RVI method for a wheat pixel, we found the RVI has a narrower wavelength range than the NDVI to calculate the index optimally. Besides the RVI seems more sensitive to the wavelength than the NDVI, the RVI showed in top right area of the Figure 2(b) has a steeper distribution curve than the same area in Figure 2 (a). The reason why RVI presents steeper distribution curve than NDVI is the increase of RVI value is higher than that of NDVI when the vegetation grows well. That is to say, NDVI has a low sensitivity to high vegetation area.
Both NDVI and RVI can be also used for soil pixels, and the results are shown in Figure 2 (c) and (d). Figures 2 (a) and (c) show that the NDVI may be contaminated by soil, because the value at the top right part in Figure (c) is also high. But comparing with Figure 2 (b) and Figure 2 (d), the RVI seems more effective to mask the soil information.
Different from satellite data, the spatial resolution of hyperspectral UAV data depends on the flight altitude, speed and camera parameters. For example, the hyperspectral image shown in Figure 1 (right) has the spatial resolution of about 0.8 cm. Although the image with high spatial resolution can provide more spatial detail about the wheat and soil, but it will also bring more difficulties for us to match the NDVI and RVI values with the wheat biomass measured on ground for the reason that we cannot collect the ground wheat for the corresponding pixel one by one. Hence, in order to overcome this problem, one ground sample is equally divided into 9 parts and the ground biomass for each part is collected. As a result, we got 81 sample plots in the experiment filed.
Another problem is the inhomogeneous background, as shown in Figure 1 (left), the first ground sample on the left bottom area, the sample is composed with soil and wheat. For the inhomogeneous background, if we calculate the mean spectral reflectance (wheat and soil) as the input reflectance to calculate the NDVI and RVI, and then use the NDVI and RVI index to match the ground biomass, it may cause some errors and decrease the precision. Because the reflectance of soil may decrease the reflectance features of the wheat, so some measures were taken to reduce the impact, for example, the images were processed manually, the pixels covered with soil were removed from the image and replaced by mask value, only the wheat pixels were chosen to calculate the mean reflectance. According to former studies, different fitted models were selected to retrieval the biomass (Xu et al., Reference Xu, Yang, Tao, Qin, Liu and Miao2007, Zhao et al., Reference Zhao, Xu, Yang, Jin, Li and Xia2014, Liu et al., Reference Liu, Ren, Chen, Tang, Wu and Li2016), and linear models were chosen to fit the correlation between the vegetation indexes (NDVI and VRI) method and the 81 ground samples in the study.
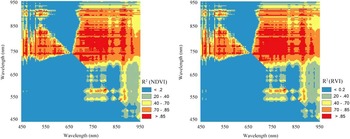
The coefficient of determination R2 for every two bands is presented in Figure 3. Both the NDVI and RVI achieve high accuracies for wavelengths 680~880 nm on x axis and 700~850 nm on y axis. The R2 difference between them mainly focuses on 680~750 nm on x axis and 750~800 nm on y axis, the RVI can use more bands to calculate the biomass than the NDVI when achieves similar R2. The wavelengths greater than 850 nm on y axis and wavelengths on x axis from 650 to 900 nm provide the same efficiency to indicate the wheat biomass as the wavelength from 750 to 850 nm on y axis and wavelength from 650 to 900 nm on x axis. In the Figure 3, despite some wavelengths around 890 and 910 nm which show high R2, the wavelengths greater than 850 nm on y axis and wavelength on the x axis from 650 to 900 nm provide less efficiency to denote the biomass when compared to the wavelengths 680~880 nm on the x axis and 700~ 850 nm on y axis.. This may be due to the data getting noisy at wavelengths greater than 860 nm since CCD elements become opaque for electrons around these wavelengths.
Two-dimensional distribution of R2 for NDVI RVI fit results, (a) NDVI method, (b) RVI method.

Generally, to retrieve R² higher than 0.88, a wavelength around 820 nm combined with wavelengths 725 nm to 750 nm are appropriate for calculating the NDVI, and the wavelength range from 820 to 832 nm, 808 to 794 nm, 770 to 788 nm combine with wavelengths range from 725 nm to 750 nm, 890 nm are reasonable for calculating the RVI.
Conclusions
By using hyperspectral data obtained from a UAV to calculate NDVI and RVI and then establishing linear regressions between the vegetation indexes and ground wheat biomass, we obtained optimal bands with a coefficient of determination R2 higher than 0.88. For calculating the NDVI, optimal bands are located mainly around 820 nm and 725 nm to 750 nm. For assessing RVI, the wavelength range from 820 to 832 nm, 794 to 808 nm, 770 to 788 nm, 725 nm to 750 nm and 890 nm for RVI are most suitable. But due to the time limit, some problems about the retrieval of wheat biomass on the ground were not considered in this study. For example, the background signal (e.g., soil type, soil moisture) influences on the results, the data collection time influences on the results, as well as the impact of mixed pixels or high spatial resolution on the results were all ignored. In addition, other different vegetation indexes, different growing seasons and fitting of other models were not discussed in the study.
Acknowledgements
This study was supported by Beijing Natural Science Foundation (6164032), National Natural Science Foundation of China (31601228) and State’s Key Project of Research and Development Plan (2016YFD0200700).