Introduction
Water deficit and flooding are consequences of unpredictable rainfall patterns, and both have devastating effects on rice production. Drought stress as a result of water deficit accounts for the majority of yield loss in the rain-fed rice-growing ecology (Cairns et al., Reference Cairns, Impa, O'Toole, Jagadish and Price2011; Handmer et al., Reference Handmer, Honda, Kundzewicz, Arnell, Benito, Hatfield, Mohamed, Peduzzi, Wu, Sherstyukov, Takahashi, Yan, Field, Barros, Stocker, Qin, Dokken, Ebi, Mastrandrea, Mach, Plattner, Allen, Tignor and Midgley2012). The use of irrigation systems to ameliorate the problem created by water deficit is threatened by the increasing reality of climate change and competition for water usage for domestic and industrial purposes (Molden et al., Reference Molden, Frenken, Barker, de Fraiture, Mati, Svendsen, Sadoff, Finlayson and Molden2007; Akinbile et al., Reference Akinbile, Abd El-Latif, Abdullah and Yusoff2011). Therefore, it is strategic to develop and select parental lines which are tolerant to drought stress for sustainable yield.
Intermittent drought spells may occur at any time during the rice production cycle. However, a terminal drought, which coincides with the reproductive stage of rice development, is also not uncommon (Xangsayasane et al., Reference Xangsayasane, Jongdee, Pantuwan, Fukai, Mitchell, Inthapanya and Jothiyangkoon2014). Floral initiation starts during the reproductive phase, then fertilization occurs and grains are set and ripe (Moldenhauer and Slaton, Reference Moldenhauer, Slaton and Slaton2001). These development processes involve a series of cell division and metabolic activities requiring constant and sufficient moisture availability (Sundberg and Østergaard, Reference Sundberg and Østergaard2009). It is thus, the most critical stage in rice development when drought stress occurrence could result in a significant economic loss (Verulkar et al., Reference Verulkar, Mandal, Dwivedi, Singh, Sinha, Mahato, Swain, Dongre, Payasi, Singh, Bose, Robin, Babu, Senthil, Jain, Shashidhar, Hittalmani, Vera Cruz, Paris, Hijmans, Raman, Haefele, Serraj, Atlin and Kumar2010).
Crop plants are evolving with adaptive characteristics, including adjustment of phenological events such as flowering time to enable their survival in water-deficit environments (Kazan and Lyons, Reference Kazan and Lyons2015). Riboni et al. (Reference Riboni, Galbiati, Tonelli and Conti2013) reported that drought stress hastens phenological events in some Arabidopsis lines. In rice, drought stress may delay flowering time (Saikumar et al., Reference Saikumar, Varma, Saiharini, Kalmeshwer, Nagendraa, Lavanyaa and Ayyappa2016; Kang and Futakuchi, Reference Kang and Futakuchi2019), and flowering time also can remain unaltered (Zou et al., Reference Zou, Liu, Mei, Liu, Yu, Li, Wu, Chen and Luo2007; Ibrahim, Reference Ibrahim2014), depending on genotype. Flowering time remaining unaltered under drought stress could be due to drought escape or physiological mechanisms that allow the plant to continue functioning under reduced soil moisture (Shavrukov et al., Reference Shavrukov, Kurishbayev, Jatayev, Shvidchenko, Zotova, Koekemoer, de Groot, Soole and Langridge2017; Kebede et al., Reference Kebede, Kang, Bekele and Sparks2019).
At Africa Rice Center, Ibadan, Nigeria, the recombinant inbred lines (RILs) from the cross between WAB638-1 and PRIMAVERA showed variability for alterations in flowering dates under water stress (Semon, unpublished). The highest-yielding individuals were further evaluated and putatively identified as exhibiting flowering delay and no delay responses under drought stress. The flowering delay was recorded as the number of days to 50% flowering in stress treatment relative to the control (Ibrahim, Reference Ibrahim2014).
Varietal selection under drought stress may consider many traits (Kumar et al., Reference Kumar, Dixit, Ram, Yadaw, Mishra and Mandal2014). Nevertheless, desired varieties should perform reasonably well in terms of grain-yield. Assessing rice adaptation to stress-prone environments using estimates of stress indices, grain-yield and yield-related traits, such as flowering time, proved useful (Raman et al., Reference Raman, Satish, Nimai, Mukund, Shukla, Dwivedi, Singh, Singh, Padmini, Ashutosh, Robin, Chandrababu, Abhinav, Tilatoo, Hittalmani, Haefele, Piepho and Kumar2012; Kumar et al., Reference Kumar, Dixit, Ram, Yadaw, Mishra and Mandal2014). Characterizing germplasm variations based on these adaptive features will be helpful for the efficient use of breeding resources. The aims of the current study were thus to confirm and classify flowering responses of WAB638-1/PRIMAVERA breeding lines under drought stress. The study suggested that the roots of the rice plants may provide information for understanding of drought adaptation mechanisms.
Materials and methods
Experimental materials
Ninety-eight high-yielding RILs selected from the F8 generation of the cross WAB638-1/PRIMAVERA and the parents were used in the study. PRIMAVERA (Oryza sativa, japonica ecotype) is a high-yielding and drought susceptible upland variety. WAB 638-1 (O. sativa, indica ecotype) is a variety adapted to both upland and lowland conditions and mildly tolerant to drought stress. The generations were developed through the single seed descent method.
Experimental setup
The experiments were conducted at the Africa Rice Center, Ibadan, Nigeria. The experimental materials were planted on the field during the dry seasons of 2016 and 2017 under two growing conditions (drought stress and control treatments). The experiment was arranged in a randomized complete block design in two replications. Each rice genotype was planted in a two-row plot of 1 m length, at a spacing of 0.2 m. The rows were separated by 0.2 m. There were six hills per row with five seeds per hill, which was thinned to two seedlings after establishment. All recommended agronomic practices for upland rice production (Oikeh et al., Reference Oikeh, Nwilene, Agunbiade, Oladimeji, Ajayi, Mande, Tsunematsu and Samejima2008) were observed.
In 2016, 12 randomly selected RILs were evaluated with the parents in the screen-house under drought stress and control treatments for rooting attributes. The plants were grown in polyvinyl chloride (PVC) pipes (42 × 12 × 6 cm3) filled with river sand thoroughly mixed with compost in the ratio 2:1. The experiments were laid out in a completely randomized design with three replications. Each genotype was planted in a three-PVC pipe row. One plant was maintained per PVC pipe till maturity.
The plants were fully irrigated by watering every day, ensuring there is no leaf rolling until the drought treatment in the stress plots. Water application was withheld in the stress plots at about the panicle initiation stage (about 60 d after sowing) for 21 d and resupplied afterwards. The intensity of drought stress was assessed using the leaf rolling scores recorded at 13.00 h GMT following SES (2014), and with the Irrometer – Model SR (Irrometer Co. Inc., USA) installed at 20 cm into the soils.
Data collection
Eight plants were sampled from the inner portion of each plot to determine the numbers of days to 50% flowering and grain yield. The root traits were determined at maturity in the screen-house experiment. The roots were carefully separated from the soil in the PVC pipe by washing with water. The root traits measured were the number of roots, root length, root volume, root fresh weight, root dry weight, shoot fresh weight and shoot dry weight.
Stress indices such as stress tolerance index (STI), mean productivity (MP), stress tolerance (ST), stress susceptibility index (SSI) and drought resistance index (DRI) were estimated using yield data (Arif et al., Reference Arif, Attaria, Shokat, Akram, Waheed, Arif and Börner2020): STI = (yp × ys)/ȳp2; MP = (yp + ys)/2; ST = yp − ys; SSI = (1 − (ys/yp))/(1 − (ȳs/ȳp)); DRI = ys × (ys/yp)/ȳs; where ys = yield under stress; ȳs = mean yield under stress; yp = yield under control and ȳp = mean yield under control.
Data analysis
The data obtained from the field and screenhouse trials were subjected to analysis of variance (ANOVA) using SAS (SAS Institute, Cary, New Caledonia, USA). Means of traits were separated according to Fischer's least significant difference (LSD) at 0.05 level of probability. Correlation coefficients for all traits were obtained. The RILs and the parents were grouped according to their flowering response. The significant difference between flowering response groups was analysed using the independent sample t-test implemented in R (R Core Team, Vienna, Austria).
Results
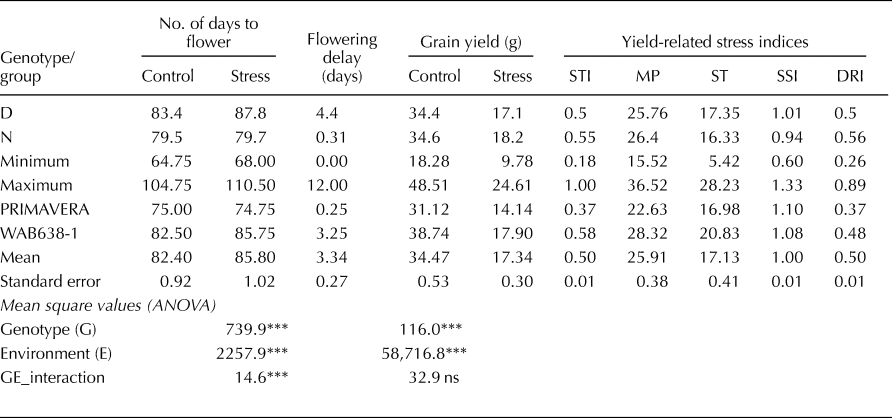
The ANOVA revealed significant (P < 0.001) genotypic and treatment (environment) differences for days to 50% flowering and grain yield in the field trials (Table 1). Although the genotype by environment interactions was not significant (P < 0.05) for grain yield, the treatment effect was observed in reduced grain yield in drought stress treatment compared with the control. Flowering time delay (FD) was recorded in 75 genotypes (including WAB638-1), while 25 genotypes (including PRIMAVERA) had no delay under drought stress compared to the control (Table 1 and online Supplementary Table S1). The genotypes were grouped as flowering delay (D) genotypes (FD > 1 d) and no delay (N) genotypes (FD < 1 d). The two groups significantly differ (P ⩽ 0.05) for the numbers of days to 50% flowering (online Supplementary Table S1). However, there was no significant difference (P ⩽ 0.05) between the two groups for the grain yield.
Summary of days to 50% flowering, flowering delay (days) and yield performance of genotypes in drought and control treatments

STI, stress tolerance index; MP, mean productivity; ST, stress tolerance; SSI, stress susceptibility index; DRI, drought resistance index; D, flowering delay group (n = 75); N, flowering unaltered (no delay) group (n = 25); ns, not significant.
*, ** and ***: probability of significance at P < 0.05, 0.01 and 0.001 respectively.
The FD is the difference between the number of days to 50% flowering in the stressed and well-watered plot of each genotype. The maximum flowering time delay recorded was 12 d (Table 1 and online Supplementary Table S1). Average values of STI, MP, ST, SSI and DRI were 0.5, 25.91, 17.13, 1.00 and 0.5, respectively. The mean values for the STI, MP and DRI for the D group (0.5, 25.76 and 0.5 respectively) were slightly lower than those of the N group (0.55, 26.4 and 0.56 respectively) whereas, ST and SSI in the D genotypes (17.35 and 1.01 respectively) were slightly higher than the values obtained for the N genotypes. Also, the RILs were in-between the two parents in relation to all the yield-related stress indices except for the DRI, which was higher in the RILs than those of the two parents.
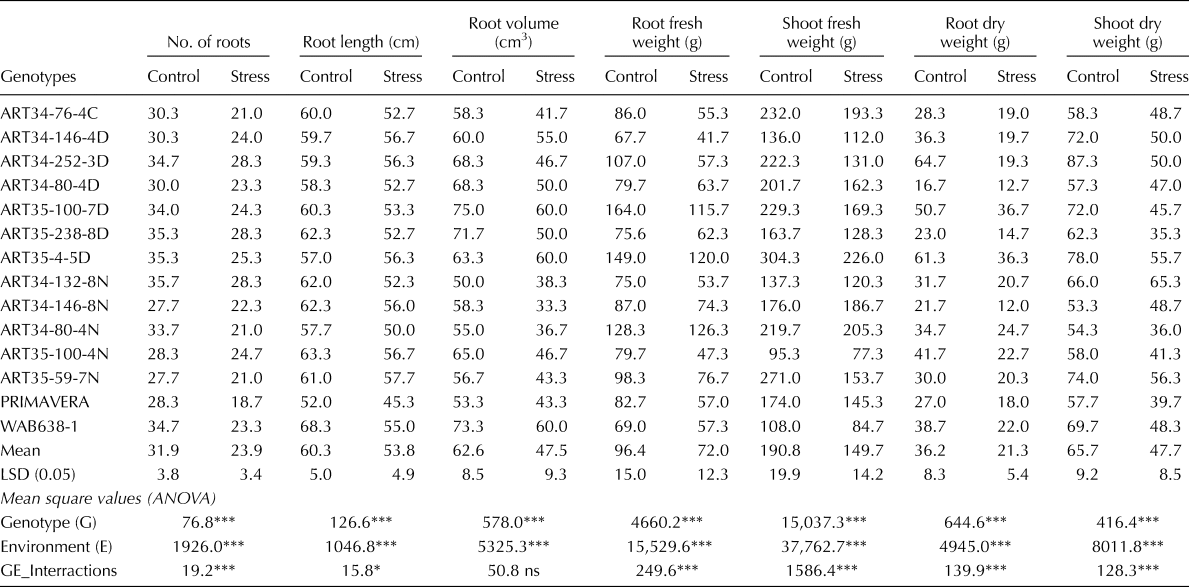
In the 2016 screenhouse experiment, the genotype and treatment differences were significant (P < 0.001) for all of the evaluated traits (Table 2). The effect of genotype by environment interaction was also significant (P < 0.05) for all the root traits except for root volume. Compared with the control, drought stress decreased all of the evaluated root traits.
Root characters under drought stress and control environments

ns, not significant; LSD (0.05), least significant difference at 5%.
*, ** and ***: probability of significance at P < 0.05, 0.01 and 0.001 respectively.
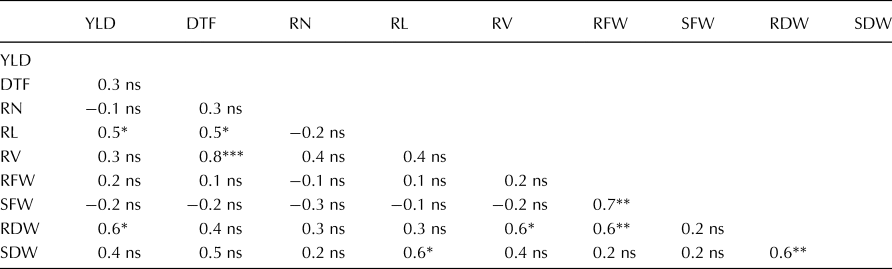
Correlation analysis revealed a positive significant (P < 0.05) relationship for grain yield with root length (r = 0.5) and root dry weight (r = 0.6), as shown in Table 3. Also, the number of days to 50% flowering significantly correlated with root length (P < 0.05; r = 0.5) and volume (P < 0.001; r = 0.8). The root volume significantly (P < 0.05) correlated with the root dry weight (r = 0.6), while the root length was correlated with the shoot dry weight (r = 0.6). There was a highly significant (P < 0.01) correlation between the root dry weight and the shoot dry weight (r = 0.7).
Correlation coefficients of agronomic and root traits, and grain yield

DTF, number of days to 50% flowering; YLD, grain yield (g); RL, root length (cm); RN, number of roots; RV, root volume (cm3); RFW, root fresh weight (g); RDW, root dry weight (g); SFW, shoot fresh weight (g); SDW, shoot dry weight (g); STR, drought stress treatment; CTR, control treatment; ns, not significant.
*, ** and ***: probability of significance at P < 0.05, 0.01 and 0.001 respectively.
Discussion
In the rain-fed ecosystem, drought stress is the widest spread and damaging of all environmental stresses, particularly in the upland areas. The severity of the drought depends on its intensity, timing and crop type. The drought stress treatment in the current study was moderately severe, with the soil water potential peaked at −55 kPa (online Supplementary Figure S1). According to Singh et al. (Reference Singh, Kukal, Jat and Sidhu2014), the sensitivity of rice to water-deficit stress may show as the soil dries below saturation (i.e. increase in soil water potential above 0 kPa). However, it is significant with increasing yield loss as the root zone dries beyond soil water potential of about −10 kPa at about 15 cm depth (Bouman and Tuong, Reference Bouman and Tuong2001; Belder et al., Reference Belder, Bouman, Spiertz, Peng, Castañeda and Visperas2005). Soil water potential data complemented with visual observation of leaf rolling (online Supplementary Figure S2). According to Dasgupta et al. (Reference Dasgupta, Das and Senb2015), visual observations of leaf rolling, wilting and drying may complement soil water potential in monitoring drought stress. In rice, leaf rolling is an index of drought stress correlating with leaf water potential (Gana, Reference Gana2011). Furthermore, the control treatment plot showed no indication of drought stress, and no panicle burnt that may indicate heat stroke (Rasheed et al., Reference Rasheed, Wahid, Farooq, Hussain and Basra2011) observed in this study.
In this study, the effect of drought stress treatment was noted in the reduction of grain yield. The observations in our study are similar to those of other previous studies, where drought stress reduced phenotypic traits, including the grain yield (Ndjiondjop et al., Reference Ndjiondjop, Manneh, Cissoko, Drame, Kakai, Bocco, Baimey and Wopereis2010; Bocco et al., Reference Bocco, Lorieux, Seck, Futakuchi, Manneh, Baimey and Ndjiondjop2012; Singh et al., Reference Singh, Reddy, Redona and Walker2017).
Furthermore, crop phenology was altered in 75 genotypes by delaying flowering time and increasing the number of days to maturity under drought stress but was unchanged in 25 genotypes. Flowering delay due to drought stress has been previously reported in rice (Wopereis et al., Reference Wopereis, Kropff, Maligaya and Tuong1996; Pantuwan et al., Reference Pantuwan, Fukai, Cooper, Rajatasereekul and O'Toole2002; Lafitte et al., Reference Lafitte, Ismail and Bennett2004; Ndjiondjop et al., Reference Ndjiondjop, Manneh, Cissoko, Drame, Kakai, Bocco, Baimey and Wopereis2010; Saikumar et al., Reference Saikumar, Varma, Saiharini, Kalmeshwer, Nagendraa, Lavanyaa and Ayyappa2016). The trait appears to be governed by a lower plant-water status (Kumar et al., Reference Kumar, Sarawgi, Ramos, Amarante, Ismail and Wade2006) and associated with grain yield (Pantuwan et al., Reference Pantuwan, Fukai, Cooper, Rajatasereekul and O'Toole2002; Singh et al., Reference Singh, Reddy, Redona and Walker2017). Kang and Futakuchi (Reference Kang and Futakuchi2019) reported flowering delay under drought stress relative to control, which varied within progenies derived from the same parents. Variation in flowering time under drought stress may be useful in breeding programmes for crop adaptation to changing climate (Kazan and Lyons, Reference Kazan and Lyons2015). The flowering delay genotypes may be suitable in the case of intermittent drought type, where there is a possibility for rainfall after a short period of drought. Otherwise, the genotypes with little or no delay may be selected for the terminal drought condition (Pantuwan et al., Reference Pantuwan, Fukai, Cooper, Rajatasereekul and O'Toole2002). Premature flowering has also been reported in some plants as a means of survival under severe terminal stress but may reduce plant yield under chronic stress conditions (Schmalenbach et al., Reference Schmalenbach, Zhang, Reymond and Jiménez-Gómez2014; Kazan and Lyons, Reference Kazan and Lyons2015).
Germplasm characterization is essential for effective utilization of plant genetic resources; the RILs were characterized and classified according to the flowering time response they employed for adaptation to drought stress as follows:
• Flowering time delaying genotypes (D): The genotypes in this category delayed flowering by one or more days in the drought stress treatment compared with the control. These plants produced flowers and grains when the soil moisture content became favourable in the drought stress environment.
• No delay or unaltered flowering time genotypes (N): The flowering time of genotypes in this group is the same in both drought stress and control treatments. Plants that fall into this category flowered and produced grains during the period of drought stress (online Supplementary Figure S3).
The current classification of the WAB638-1/PRIMAVERA population according to flowering time response under drought stress confirmed the previous report by Ibrahim (Reference Ibrahim2014). Flowering delaying mechanism under drought stress appears as a drought avoidance strategy whereby plant growth and development processes are slowed down until soil moisture condition is better. Mechanism of slow plant growth under a drought avoidance strategy may be associated with small or closed stomata to minimize water loss (Shavrukov et al., Reference Shavrukov, Kurishbayev, Jatayev, Shvidchenko, Zotova, Koekemoer, de Groot, Soole and Langridge2017). It may result in reduced photosynthesis and general metabolic process required for floral induction until the water was reintroduced and plants resumed reproductive functions. Unaltered flowering time (no delay) mechanisms, on the other hand, took the features of drought tolerance strategy and may have developed adaptive features that enabled them to continue the development and metabolic processes under stress (Kebede et al., Reference Kebede, Kang, Bekele and Sparks2019).
Many studies have employed several yield-related indices to determine the best stress-tolerant rice genotypes under drought (Mau et al., Reference Mau, Ndiwa, Oematan and Markus2019; Arif et al., Reference Arif, Attaria, Shokat, Akram, Waheed, Arif and Börner2020). Genotypes with a lower value for SSI or higher value for DRI are considered to have better performance under stress (Raman et al., Reference Raman, Satish, Nimai, Mukund, Shukla, Dwivedi, Singh, Singh, Padmini, Ashutosh, Robin, Chandrababu, Abhinav, Tilatoo, Hittalmani, Haefele, Piepho and Kumar2012). The RILs seemed to perform better than the two parents with SSI and DRI, with the N genotypes having the best yield performance. Stress indices such as SSI and DRI are yield-related stress indices suggested as potential indicators arising from different biological responses to drought stress (Nauraein et al., Reference Nauraein, Mohammadi, Ahrizad, Moghaddam and Sadeghzadeh2013; Arif et al., Reference Arif, Attaria, Shokat, Akram, Waheed, Arif and Börner2020).
Correlation between plant traits such as phenological events, grain yield and root parameters in the current study suggests that these traits are key factors in relation to the other to which they correlated (Ukaoma et al., Reference Ukaoma, Okocha and Okechukwu2013). In rice, root hydraulic conductance that can potentially increase water uptake under water-limited conditions is determined by root parameters, including root length and root volume (Lipiec et al., Reference Lipiec, Doussan, Nosalewicz and Kondracka2013; Henry et al., Reference Henry, Wehler, Grondin, Franke and Quintana2016). In a previous study with the same population of RILs, Ibrahim (Reference Ibrahim2014) proposed the concept of compensatory genotypes, where the RILs developed new roots and tillers under drought stress to compensate for the effects of the water stress. Similarly, increased root growth under water stress has been reported in other plant species such as Catharanthus roseus (Jaleel et al., Reference Jaleel, Gopi, Sankar, Gomathinayagam and Panneerselvam2008). However, the current study did not consider plant/root growth parameters to validate the concept of compensatory genotypes. Nonetheless, root parameters such as root volume and length seemed to have a role to play in the observed drought adaptation mechanisms employed by genotypes in the current study. Previous studies suggested that long and thick roots could penetrate the compact layers of the soil profile for the uptake of water and nutrients available in the deeper zones (Nguyen et al., Reference Nguyen, Babu and Blum1997; Singh et al., Reference Singh, Reddy, Redona and Walker2017).
In conclusion, the current study confirmed that 98 high-yielding RILs studied employed various adaptation mechanisms, including delaying flowering under reproductive stage drought stress. The genotypes were consequently characterized to enable their use in parental selection towards rice improvement programmes, particularly for drought adaptation at the reproductive stage in the upland ecology. The genotypes were grouped into delay (D) genotypes (FD > 1 d) and no delay (N) genotypes (FD < 1 d), which significantly differ (P ⩽ 0.05) for numbers of days to 50% flowering. The flowering delay genotypes may be suitable for intermittent drought, while genotypes with little or no delay may be selected for terminal drought conditions. The maximum flowering time delayed was 12 days. Of these two groups, yield-related stress indices such as SSI and drought tolerance index revealed that the genotypes with no delayed flowering time outperformed those delaying flowering and the parents under drought stress. Based on the correlation analysis, the study indicated that some root parameters, including root volume, root length and root dry matter, might have contributed to the adaptation mechanisms employed by the inbred lines under drought stress. Further studies should consider the role of root and plant growth parameters for understanding the adaptation mechanism and flowering time response of the rice population. Our study provided insight into the utilization of genetic diversities in the recombinant inbred population for drought adaptation in the upland ecology.
Supplementary material
To view supplementary material for this article, please visit https://doi.org/10.1017/S1479262121000010
Acknowledgement
The authors sincerely appreciate the management of Africa Rice Center, Ibadan regional station in the provision of plant materials, and a conducive environment for the implementation of this project.