NOMENCLATURE
- C 1, . . ., C 7
normalised invariants
- d
focal length
- E
direction cosine matrix
- fDZ
dead zone function
- fk
function that calculates index value from image data
 ${{\cal F}_{sm}}$
smoothing filter
- g(x, y)
pixel value at (x, y)
- h
altitude of focal spot
- Mk
maximum value of index value k
- nC
number of evaluated moment invariants
- pi
camera position of divided area i
- (x, y)
position
- (x image, y image)
position on image plane axis
- (xG, yG)
position on ground plane axis

Greek Symbols
- αi, k
index value of look-up table
- βk
index value calculated from image data received from onboard camera
- γj
averaged image data gradient at wavelength number j
- Δγ
directional difference of gradient
- ηpq
central moments of order p and q
- λ1, . . ., λ7
invariants with respect to translation, scale, and rotation
- μpq
invariant with respect to translation and scale
- σnoise
ratio of standard deviations of added noise to error between maximum and minimum pixel values in field of view
- ϕ, θ and ψ
roll, pitch, and yaw angle, respectively
- Φ
image data
- Φj
image data at wavelength number j
- $\hat{\Phi }$
transformed image data of onboard camera
- Ω
Mars surface
- Ωi
divided Mars surface

Abbreviations
- CRISM
Compact Reconnaissance Imaging Spectrometer for Mars
- EDL
Entry, Descent, and Landing
- FPGA
Field-Programmable Gate Arrays
- GNC
Guidance, Navigation, and Control
- HiRISE
High Resolution Science Experiment
- IMU
Inertial Measurement unit
- MRO
Mars Reconnaissance Orbiter
- THEMIS
Thermal Emission Imaging System
Subscript
- i
divided area segments number
- j
wavelength number
- k
index value number
- l
pixel number
Operators
- ∇
gradient
- ∠
angle of vector
- ~
smoothed image data
1.0 INTRODUCTION
The Mars aircraft has been developed as a tool for Mars explorations, and enables long-distance observations at high resolution(Reference Braun, Wright, Croom, Levine and Spencer1,Reference Levine, Croom, Wright, Killough and Edwards2) . In Japan, the working group for the Mars Exploration Aircraft has been developing a Mars aircraft, and high-altitude experiments have been performed(Reference Anyoji, Okamoto, Hidaka, Kondo, Oyama, Nagai and Fujii3–Reference Fujita and Nagai11). Specifically, fundamental aircraft performances on the Mars atmosphere have been investigated, such as high-lift coefficients and lightweight structures. However, the guidance, navigation, and control (GNC) and the self-localisation systems are important to guide the aircraft along the desired path on Mars.
The inertial measurement unit (IMU) and the Doppler radar have been mainly used in the entry, descent, and landing (EDL) systems of past Mars missions(Reference Braun and Manning12). Aiming towards the achievement of more precise navigation, the terrain relative navigation has been under investigation for the Mars 2020 mission(Reference Johnson, Ansar, Matthies, Trawny, Mourikis and Roumeliotis13,Reference Johnson, Cheng, Montgomery, Trawny, Tweddle and Zheng14) . Specifically, the obtained images are matched with a prepared map, and the results are fused with IMU data using an extended Kalman filter. These processes are carried out in real time using field-programmable gate arrays (FPGA).
Generally, real-time image-matching algorithms requires high computational performance. Because our developing Mars aircraft is lightweight and small, a small avionics system with a relatively low performance will be used. Therefore, a localisation method requiring low-computational performance is necessary(Reference Arai, Takamura, Inoue, Ono and Adachi15). In Reference Lightsey, Mogensen, Burkhart, Ely and DuncanRef. 16, the real-time navigation was proposed for the final approach and EDL phase using the Mars network orbiter. However, it is difficult to maintain the network to a Mars orbiter during the entire duration of the flight of the Mars aircraft. A new localisation method with low-computational complexity is required that can be executed using the onboard devices only.
In the present research, a new self-localisation method using multispectral images is proposed. Prior to the flight, the look-up table is constructed connecting the position to the index values, which are calculated from the image moment invariants and averaged gradient information, estimated from images acquired from the Mars surface at different wavelengths. The aircraft position can be estimated by matching the images taken by the onboard broadband camera to the look-up tables.
The estimated errors of the proposed method with specific camera altitude and angle are validated using the multispectral images of the Mars surface. Additionally, the robustness of the proposed methods to image noise is analysed.
2.0 SELF-LOCALISATION METHOD VIA MULTISPECTRAL IMAGE
2.1 Index-matching algorithm using observed data of the Mars exploration
Prior knowledge that relates the local information obtained by the Mars aircraft to the global position on Mars is necessary for self-localisation. It should depend on the exploration data of past missions. The Mars Reconnaissance Orbiter (MRO) performed the extended survey using several instruments. The High Resolution Science Experiment (HiRISE) obtained detailed images with a resolution of 0.3 m at an altitude of 300 km. Additionally, the Compact Reconnaissance Imaging Spectrometer for Mars (CRISM) obtained spectrum data within the wavelength range of 370 to 3,920 nm. It has a resolution of 18 m at an altitude of 300 km and is used to produce a map of surface mineralogy. The MRO is also equipped with a grayscale image camera and a low-resolution camera. The Mars odyssey was equipped with the Thermal Emission Imaging System (THEMIS) with a resolution of 100 m used for the analysis of minerals.
These observed data have potential applicability to the self-localisation of the aircraft. In the present research, the spectral image obtained by CRISM is applied to the self-localisation because it contains image information spanning a wide wavelength range with sufficient resolution, thereby resulting in high-estimation precision. The localisation algorithm is constructed based on the simple mapping of index values calculated using several images at different wavelengths.
2.2 Index values using Hu moment invariants
The proposed algorithm requires index values estimated from the spectral image. The index values are required to be substantial to account for the variation of the camera angle and position. Therefore, the Hu moment invariants(Reference Hu17) are applied for the self-localisation. It is used mainly for pattern recognition. Let the pixel value at the position from the centroid (x, y) be g(x, y). Central moments of order p and q are defined as:
 $$\begin{equation}
{\mu _{pq}} = \mathop \int\!\!\!\int {x^p}{y^q}g\left( {x,y} \right)dxdy
\end{equation}$$
This calculation is invariant with respect to translations. Invariants ηpq with respect to both translation and scale are defined as:
 $$\begin{equation}
{\eta _{pq}} = \frac{{{\mu _{pq}}}}{{{\mu _{00}}^{\frac{{p + q + 2}}{2}}}}
\end{equation}$$
Invariants with respect to translation, scale, and rotation, are defined as:
 $$\begin{equation}
{\lambda _1} = {\eta _{20}} + {\eta _{02}},
\end{equation}$$
 $$\begin{equation}
{\lambda _2} = {\left( {{\eta _{20}} - {\eta _{02}}} \right)^2} + 4\eta _{11}^2,
\end{equation}$$
 $$\begin{equation}
{\lambda _3} = {\left( {{\eta _{30}} - 3{\eta _{12}}} \right)^2} + {\left( {3{\eta _{21}} - {\eta _{03}}} \right)^2},
\end{equation}$$ \\
 $$\begin{equation}
{\lambda _4} = {\left( {{\eta _{30}} + {\eta _{12}}} \right)^2} + {\left( {{\eta _{21}} + {\eta _{03}}} \right)^2},
\end{equation}$$
 $$\begin{eqnarray}
{\lambda _5} &=& \left( {{\eta _{30}} - 3{\eta _{12}}} \right)\left( {{\eta _{30}} + {\eta _{12}}} \right)\left\{ {{{\left( {{\eta _{30}} + {\eta _{12}}} \right)}^2} - 3{{\left( {{\eta _{21}} + {\eta _{03}}} \right)}^2}} \right\} \nonumber\\
&&+\, \left( {3{\eta _{21}} - {\eta _{03}}} \right)\left( {{\eta _{21}} + {\eta _{03}}} \right)\left\{ {3{{\left( {{\eta _{30}} + {\eta _{12}}} \right)}^2} - {{\left( {{\eta _{21}} + {\eta _{30}}} \right)}^2}} \right\},
\end{eqnarray}$$
 $$\begin{equation}
{\lambda _6} = \left( {{\eta _{20}} - {\eta _{02}}} \right)\left\{ {{{\left( {{\eta _{30}} + {\eta _{12}}} \right)}^2} - {{\left( {{\eta _{21}} + {\eta _{03}}} \right)}^2}} \right\} + 4{\eta _{11}}\left( {{\eta _{30}} + {\eta _{12}}} \right)\left( {{\eta _{21}} + {\eta _{03}}} \right),
\end{equation}$$
 $$\begin{eqnarray}
{\lambda _7} & = & \left( {3{\eta _{21}} - {\eta _{03}}} \right)\left( {{\eta _{30}} + {\eta _{12}}} \right)\left\{ {{{\left( {{\eta _{30}} + {\eta _{12}}} \right)}^2} - 3{{\left( {{\eta _{21}} + {\eta _{03}}} \right)}^2}} \right\} \nonumber\\
&&-\, \left( {{\eta _{30}} - 3{\eta _{12}}} \right)\left( {{\eta _{21}} + {\eta _{03}}} \right)\left\{ {3{{\left( {{\eta _{30}} + {\eta _{12}}} \right)}^2} - {{\left( {{\eta _{21}} + {\eta _{03}}} \right)}^2}} \right\},
\end{eqnarray}$$
Finally, these are normalised for the robustness to noise(Reference Hupkens and Clippeleir18), and indices C 1, . . ., C 7 are defined as:
 $$\begin{equation}
{C_1} = \frac{{{\lambda _1}}}{{{\lambda _1}}} = 1,{\rm{\ }}\ {C_2} = \frac{{{\lambda _2}}}{{{\lambda _1}^2}},{\rm{\ }}\ {C_3} = \frac{{{\lambda _3}}}{{{\lambda _1}^3}},\ {C_4} = \frac{{{\lambda _4}}}{{{\lambda _1}^3}},{\rm{\ }}{C_5} = \frac{{{\lambda _5}}}{{{\lambda _1}^6}},\ {C_6} = \frac{{{\lambda _6}}}{{{\lambda _1}^4}},\ {C_7} = \frac{{{\lambda _7}}}{{{\lambda _1}^6}}
\end{equation}$$
These indices are invariant with respect to translation, scale, and rotation.
2.3 Index values using the gradient of pixel values
Hu moment invariants evaluate the distribution of the pixel values as a function of the distance from the centroid. Because this estimate is invariant with respect to rotation, the direction of the distribution that constitutes meaningful information for the self-localisation cannot be evaluated. The direction of the distribution, exhibiting unidirectional decreasing or increasing tendencies, can potentially constitute another index value. However, calculating the direction in the acquired image requires the heading angle of the aircraft, which is difficult to be measured on Mars. Therefore, the differences between the directions of the distributions of several spectral images acquired at different wavelengths are estimated without the heading angle of the aircraft. Herein, the gradients of the images are used. Specifically,
(1) Let the spectral image data be Φ = [Φ1, Φ2, . . ., Φj, . . .], where j is the wavelength number.
(2) The image data are smoothed using a moving average filter in accordance to
$\tilde{\Phi } = [ {{{\tilde{\Phi }}_1},{{\tilde{\Phi }}_2}, \ldots ,{{\tilde{\Phi }}_j}, \ldots } ]$, where $\tilde{\# } = {{\cal F}_{sm}}\{ \# \}$ is a smoothing filter for the image data $\# $.(3) The gradients of the smoothed images are then calculated using the Prewitt operator, and the average value is estimated and used as the gradient of the image,
(11)
$$\begin{equation}{\gamma _j} = \sum\nolimits_l {\nabla {{\tilde{\Phi }}_{j,l}}} ,\end{equation}$$


where l is a pixel number of the divided area, and  $\nabla {\tilde{\Phi }_{j,l}}$ is a gradient vector at the pixel number l of the image data
 ${\tilde{\Phi }_j}$. The directional difference between the different images acquired at different wavelengths is defined as:
 $$\begin{equation}
{l^{({j_1},{j_2})}} = \angle {{\rm{\gamma }}_{{j_1}}} - \angle {{\rm{\gamma }}_{{j_2}}},
\end{equation}$$
where ∠ is the operator that calculates the angle of the vector, such that ∠a = tan − 1(ax/ay), and ax and ay are the x and y components of vector a, respectively.
Hereafter, the angle values are mapped within the range of ( − π, π]. Because the index value in Equation (12) is the difference of the directions of the two images, the aircraft heading angle information is not required. Obviously, this estimate is invariant with respect to the rotation of the images.
2.4 Compensation of geometric distortion
The localisation algorithm is constructed assuming that the image obtained from the camera is directed perpendicularly downward. However, the image is distorted based on the aircraft attitude. In addition, the ground size in the field of view depends on the altitude of the aircraft. Before the calculation of the index values, the obtained image should be transformed to the image obtained from the camera directed perpendicularly downward and having the same ground size and shape in the field of view.
The Mars aircraft will be equipped with an altitude sensor and an attitude estimation system(Reference Kuribara, Mochizuki and Tokutake19). The transformation algorithm compensating of attitude and altitude is as follows (Fig. 1):
Transformation of image.

Let the pixel position on the image plane axis of the image obtained from the onboard camera be (x image, y image) and the pixel value at (x image, y image) be g(x image, y image).
Let the focal length of the onboard camera be d; the altitude of the focal spot be h; and the roll, pitch, and yaw angles of the aircraft be ϕ, θ, and ψ, respectively.
The position of the pixel on the ground (xG, yG) corresponding to the pixel on the image plane at (x image, y image) can be calculated as the solution of the following equation:
 $$\begin{equation}
\left[ {\begin{array}{@{}*{1}{c}@{}} {{x_G}}\\ {{y_G}}\\ 0 \end{array}} \right] = \left[ {\begin{array}{@{}*{1}{c}@{}} 0\\ 0\\ { - h} \end{array}} \right] + k \times {\rm{E}}\left( {\phi ,\theta ,0} \right) \times \left[ {\begin{array}{@{}*{1}{c}@{}} {{x_{{\rm{image}}}}}\\ {{x_{{\rm{image}}}}}\\ d \end{array}} \right],
\end{equation}$$
 $$\begin{eqnarray}
&& E(\phi, \theta, \psi) \nonumber\\
&&\quad = \left[ {\begin{array}{c@{\;\;\,\;}c@{\;\;\,\;}c} \,{\rm cos}\, \theta \,{\rm cos}\, \psi & \,{\rm cos}\, \theta \,{\rm sin}\, \psi & -\,{\rm sin}\, \theta \\
\,{\rm sin}\, \phi \,{\rm sin}\, \theta \,{\rm cos}\, \psi - \,{\rm cos}\, \phi \,{\rm sin}\, \psi & \,{\rm sin}\, \phi \,{\rm sin}\, \theta \,{\rm sin}\, \psi + \,{\rm cos}\, \theta \,{\rm cos}\, \psi & \,{\rm sin}\, \phi \,{\rm cos}\, \theta \\
\,{\rm cos}\, \phi \,{\rm sin}\, \theta \,{\rm cos}\, \psi + \,{\rm sin}\, \phi \,{\rm sin}\, \psi & \,{\rm cos}\, \phi \,{\rm sin}\, \theta \,{\rm sin}\, \psi - \,{\rm sin}\, \theta \,{\rm cos}\, \psi & \,{\rm cos}\, \phi \,{\rm cos}\, \theta
\end{array}} \right]\nonumber\\
\end{eqnarray}$$
This transformation compensates the aircraft attitude to the ground, i.e., roll and pitch angles. It is difficult to measure the yaw angle on Mars. However, the index values of the Hu momentum invariant and gradient error between different wavelengths are invariant with respect to the rotation. Therefore, the compensation of the yaw angle is not required. Finally, the image data set having the same area size and shape is extracted from the calculated image data with position (xG, yG) and pixel value g(x image, y image).
2.5 Localisation procedure
The proposed method depends on a simple matching algorithm. The look-up table mapping the position to the index values was constructed. The index values were calculated by shifting the assumed camera position in the spectral images of the Mars surface, which contain the flight area. In the flight mission, the multispectral images are obtained by the onboard camera, and the index values are calculated in real time. The aircraft position is estimated by matching the index values to the look-up table. The self-localisation procedures are shown below, as follows:
(Preprocessing)
(1) The Mars surface Ω is divided into Ωi, i = 1, 2, . . ., n such that Ω = ∪Ωi. Let the camera position of the image area Ωi be pi. In this case, i is the number of the divided area segments mapping to the camera's position. Let the spectral image data obtained by CRISM with a wavelength wj for the divided area Ωi be Φi, j, and Φi = [Φi, 1, Φi, 2, . . ., Φi, j, . . .].
(2) The index values αi, k = fk(Φi), k = 1, 2, . . . are calculated for each divided area Ωi.
${f_k}( \# )$ is a function that calculates the index values from the image data $\# $, and k is the number of the index values.(3) The look-up table mapping the camera position pi to the index values αi, k is constructed.


(Real-time processing)
(1) The spectral image is obtained from the onboard spectral camera. The obtained image is transformed to have the camera angle directed perpendicularly downward and obtain an image of same size as the look-up table. Let the transformed image data be
$\hat{\Phi }$.(2) The index functions are calculated for the acquired spectral image data
$\hat{\Phi }$. The calculated index values ${f_k}( {\hat{\Phi }} )$ are denoted by βk.(3) Find the position pi from the look-up table whose index values αi, k are close to the calculated index values βk, k = 1, 2, . . . by minimizing the cost function Ji. Ji is defined by representing the error of the index values between the images obtained by the onboard camera and the look-up table at position pi.


This algorithm utilises several indices calculated from the images acquired at different wavelengths. The estimation precision can be improved by using additional indices and additional spectral images acquired at different wavelengths.
3.0 NUMERICAL SIMULATIONS
3.1 Cost function and matching criteria
The proposed self-localisation method is validated using the images taken by CRISM of MRO near Holden crater(20). The position of the original image is at a latitude of −26.8°– −26.608° (587 pixels) and at an East longitude of 325.338°–325.596° (701 pixels). From the original image, 400×400 pixels2 were extracted and used for the validation. Since the size of one pixel equals 19.4 m, the extracted area is 7,760×7,760 m2. The observed images were acquired within the period of February 24, 2007 at 11:11:48–February 24, 2007 at 11:13:39. The images were acquired at six different wavelengths, that is, the wavelengths of 442 nm, 533 nm, 592 nm, 1,080 nm, 1,500 nm, and 2,503 nm, were used to construct the look-up table. The wavelengths 442 nm, 533 nm, and 592 nm, are in the violet, green, and orange light regions of the visible spectrum, respectively. The wavelengths 1,080 nm, 1,500 nm, and 2,503 nm, are in the infrared range. The extracted images of each wavelength are shown as grayscale images (Fig. 2). It can be seen that both visible images and infrared images reflect the landform. However, comparing the visible and infrared images, different patterns appear.
Spectral images of the Mars surface(20).

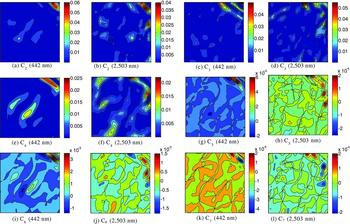
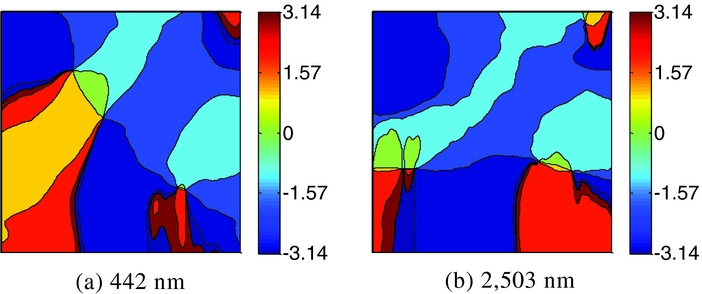
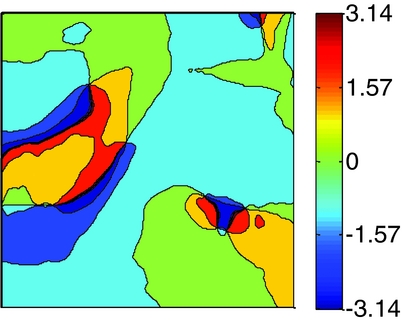
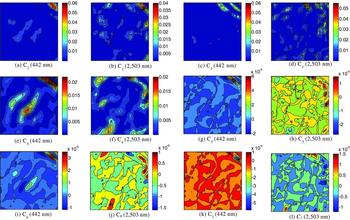
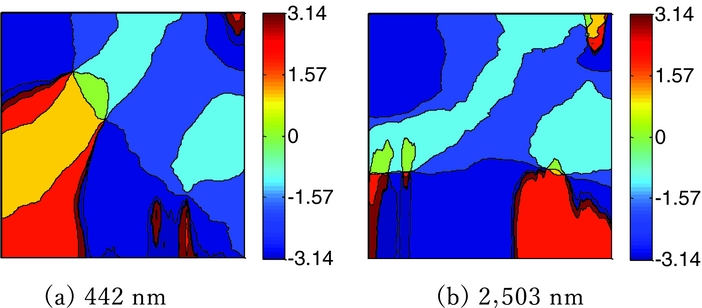
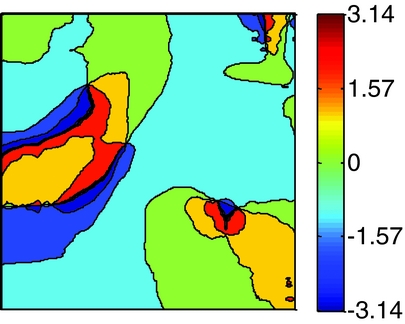
The moment invariants C 2, . . ., C 7 of the wavelengths 442 nm and 2,503 nm are shown in Fig. 3. The distribution patterns vary with respect to the degrees of the moments and the wavelengths. The direction of the gradient ∠γi, j for the images of the wavelengths 442 nm and 2,503 nm are shown in Fig. 4. Figure 5 shows the difference of the directions (Equation (12)). The direction of the gradient of Fig. 4 varies globally as compared to the distribution of the moment invariants shown in Fig. 3. Therefore, moment invariant has a few local minima, and it is suitable as a cost function for the minimisation problem.
Distributions of moment invariants.

Direction of gradients.

Difference of the gradient directions.

To construct the cost function, two typical images were selected, that is, the image at a wavelength of 442 nm from the visible spectrum, and the image at a wavelength of 2,503 nm from the infrared spectrum. The moment invariants C 5, C 6, and C 7 were used. Because the undulation of the distributions of C 2, C 3, and C 4 were low, they were eliminated from the cost function. (Case 1)
The cost function can be expressed using the following:
 $$\begin{equation}
{J_i} = \frac{1}{{{n_C}}}\sum\nolimits_{k = 1}^{{n_C}} {\left( {\left| {{\alpha _{i,k}} - {\beta _k}} \right|/{M_k}} \right) + {f_{DZ}}\left( {\left| {{\alpha _{i,{n_C} + 1}} - {\beta _{{n_C} + 1}}} \right|} \right)/\pi } ,
\end{equation}$$
 $$\begin{equation}
{f_{DZ}}\left( x \right) = \left\{ {\begin{array}{c@{\quad}c} {x - \rho }&{\left( {x \ge \rho } \right)}\\ 0&{(\left| x \right| < \rho )}\\ {x + \rho }&{\left( {x \le \rho } \right)} \end{array}} \right.
\end{equation}$$
• nC is the number of the evaluated moment invariants. Mk is the maximum value of the moment invariant in each image, and the size of the dead zone ρ is 0.1 rad.
• The index values αi, 1 − αi, nC(nC = 6) correspond to the three moment invariants C 5, C 6, and C 7, calculated from the image acquired at the two wavelengths of 442 nm and 2,503 nm.
• The index value αi, nC + 1 is the difference of the gradient direction between the images acquired at 442 nm and 2,503 nm (Equation (12)).
The divided area Ωi is assumed to be 100×100 pixels squared. The cost function is calculated and the look-up table is constructed by shifting the centre of Ωi by one pixel. It is assumed that the onboard camera is at the centre of each divided area Ωi. Additionally, it is assumed that the onboard camera is directed perpendicularly downward, and the obtained image has the same size and shape of field of views as that of the look-up table.
The following optimisation problem is solved to find the self-location in accordance with:
 $$\begin{equation}
\mathop {\min }\limits_i {J_i}
\end{equation}$$
Let the optimised i be i opt. The symbol p i opt is the estimated self-location.
In the present research, the cost function was calculated for all the pixels, and the minimum value was calculated.
3.2 Simulation results
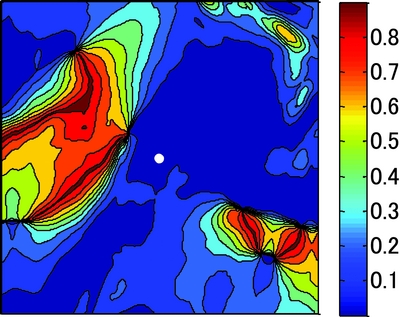
In these simulations, it was assumed that the self-position was at central pixel of the searched area of 400×400 pixels2 at location (200, 200). The optimisation problem for the cost function for Case 1 was solved and the self-location was estimated. The obtained position which minimised the cost function was at the pixel location (200, 200). The estimated error was zero. The calculation was performed by PC with Intel Core i7-6700HQ CPU and MATLAB®. The calculation time was approximately 2.9s. The distribution of the cost functions is shown in Fig. 6. In the present research, all pixels were examined in the effort to estimate the minimum cost function. Obviously, the true position can be obtained using this method. However, as it can be seen in Fig. 6, the distribution of the cost function varies globally, and few local minima exist. Therefore, gradient methods may be effective to search for the minimum cost function based on an appropriate initial position.
Distribution of cost function (O: actual self-location).

3.3 Robustness to image noise
In the actual mission, it is expected that the acquired image will contain noise, such as electrical noise and noise due to dust in the atmosphere. Correspondingly, the estimated errors under the variation of the image noise were studied. In the simulations, Gaussian noise was added to the original image. The noise level is defined by σnoise, which is the ratio of the standard deviations of the added noise to the error between the maximum and minimum pixel values in the field of view. The value of σnoise varied from 0 to 1. Figure 7 shows examples of noised images from where the self-locations were estimated. The average and standard deviations of the estimated errors are evaluated based on 50 independent calculations performed with the same size of σnoise. In addition to the cost function in Case 1, the cost functions that included all the moment invariants (Case 2), and the cost function that included only moment invariant (Case 3) were studied.
Noised image.

(Case 2)
The cost function is expressed by Equation (13).
• The index values αi, 1 − αi, nC (nC = 36) are six moment invariants C 2, . . ., C 7 calculated from the images acquired at six different wavelengths, namely, 442 nm, 533 nm, 592 nm, 1,080 nm, 1,500 nm, and 2,503 nm
• The index value αi, nC + 1 is the difference of the gradient direction between the images acquired at 442 nm and 2,503 nm.
(Case 3)
The cost function is as follows:
 $$\begin{equation}
{J_i} = \frac{1}{{{n_C}}}\sum\nolimits_{k = 1}^{{n_C}} {\left( {\left| {{\alpha _{i,k}} - {\beta _k}} \right|/{M_k}} \right)}
\end{equation}$$
• The index values αi, 1 − αi, nC(nC = 6) are the three moment invariants C 5, C 6 and C 7, calculated from the images acquired at wavelengths 442 nm and 2,503 nm.
Figure 8 shows the mean value and the standard deviation of the estimated error. The estimated error in Case 2 is approximately half the value of Case 1 for all the noise levels studied. In Case 1, the cost function contains three moment invariants for the acquired images at the two distinct wavelengths. In Case 2, the cost function contains six moment invariants for the images acquired at the six different wavelengths. In Case 2, the number of the index values is larger than that for Case 1, thereby resulting in a more precise estimation. The cost function in Case 3 does not contain the gradient information of the multispectral images. It results in a larger estimated error compared to Case 1.
Estimated error (the size of one pixel equals 19.4 m).

Figure 9 shows the distributions of the moment invariants calculated from noised images (σnoise = 0.6). Compared to Fig. 3, it can be seen that the distributions of the moment invariants for the noised images are slightly jagged. However, global trends do not differ considerably. Figures 10 and 11 show the directions of the gradients and the difference of the directions of the gradients calculated from the noised images, respectively. Compared to Figs. 4 and 5, it can be seen that the global trends are similar. Figure 12 shows the distribution of the cost functions as a function of variations of the noise level. It can be seen that the distributions of the cost functions are hardly affected by image noise. The distributions of the cost functions in Cases 1 and 2 differ considerably from those in Case 3. The cost functions of Cases 1 and 2 contain moment invariants and gradient information that show global undulations, which is suitable for optimisation problems. However, the distributions of the cost functions in Case 3 that contain only the moment invariants are comparatively flat. This results in an overestimation of the error for the noised images.
Distributions of moment invariants for noised images (σnoise = 0.6).

Directions of gradient of noised images (σnoise = 0.6).

Difference of the directions of gradient of noised images (σnoise = 0.6).

Distributions of cost functions (O: actual self-location).

4.0 CONCLUSIONS
In this work, a new self-localisation method was proposed using multispectral images. The look-up table mapping the position and the index values was constructed. The index values were defined from the image moment invariants and the gradient of the pixel values, which are calculated for the numerous spectral images acquired at different wavelengths.
The self-location was determined by mapping the index values calculated from the multispectral images obtained by the onboard camera to the entries of the look-up table. The estimation precision and the robustness to image noise were analysed through numerical simulations using the actual Mars surface image of the MRO. It was revealed that the proposed method is robust to image noise and can be improved by using additional images acquired at different wavelengths. The proposed method can introduce various types of information using multispectral images with simple indexes requiring low-computational complexity. It is an advantage for the implementation to the flight model of the actual Mars mission.
The performance of the fundamental algorithm under specific conditions was discussed in the present research. It is important that the proposed method is improved for its planned application to the actual mission. The condition of image acquisition, such as the directions of the sun and dust, should be compensated. Combining additional sensors with the proposed system, such as the IMU, implementation of the self-localisation algorithm with increased time-efficiency and precision may be achieved.