I. INTRODUCTION
Recently, titanium (Ti) film has drawn extraordinary attention for its applications in microelectronics, microelectromechanical systems, and medical industry owing to its remarkable photoelectric performance, excellent corrosion resistance, and good mechanical properties.Reference Lütjering and Williams1–Reference Balazic, Kopac, Jackson and Ahmed3 As the starting substrate materials for preparing TiO2 nanotube arrays by anodization, the quality (dense, uniform) of Ti films and their adherence to the substrate are critical to the formation process of titania nanotubes. Nowadays, TiO2 nanotube arrays on conductive glass substrates (fluorine-doped tin oxide, F:SnO2, FTO) had been widely used in electrochromic devices and dye-sensitized solar cells.Reference Berger, Ghicov, Nah and Schmuki4,Reference Varghese, Paulose and Grimes5 Many techniques devoted to prepare Ti films on the desired substrate have been developed. Among all these techniques, sputtering method has been extensively used to deposit Ti thin films on conductive glass substrates.Reference Ji, Lin, Zheng, Liu, Dudik, Zhu and Burda6,Reference Chen, Wang, Li, Huang and Sun7 Sputtering involves physical ejection of fine particles of a material such as its atoms or molecules from a pure target and their condensation and nucleation onto a substrate. Ti films produced by sputtering processes commonly exhibit a wide variety of micro- and nanostructural properties including grain size, lattice defects, crystallographic orientation, and surface morphology. The unique properties and various applications of Ti generally depend on its morphology, structure, and chemical nature. Therefore, so far several research groups have tried to analyze the physical and chemical characteristics of bulk Ti and Ti films.Reference Avelar-Batista, Wilson, Davison, Matthews and Fancey8–Reference Passeggi, Vergara, Mendoza and Ferrón10
Many investigators have noted that the formation of films with a specific structure and morphology depends upon deposition conditions, such as substrate temperature, deposition rate, angle of incident, inert gas pressure, surface roughness of the substrate, and sputtering power as well as upon the material itself.Reference Jeyachandran, Karunagaran, Narayandass, Mangalaraj, Jenkins and Martin11–Reference Durst, Ellermeier and Berger14 In general, the detailed basic studies on the composition, structure, and morphology of the Ti films prepared under conventional conditions are of particular importance because such type of conditions is widely used for preparing most of the Ti-based coatings and films. For example, Jeyachandran et al. have investigated the properties of Ti films (77–117 nm thickness) deposited by DC magnetron sputtering and reported the formation of amorphous and crystalline films under different sputtering conditions.Reference Jeyachandran, Karunagaran, Narayandass, Mangalaraj, Jenkins and Martin11 In 2003, Godfroid et al. have studied the effect of deposition rate on the growth of ultrathin Ti films deposited on SnO2 by magnetron sputtering.Reference Godfroid, Gouttebaron, Dauchot, Leclere, Lazzaroni and Hecq15 The growth mode of Ti thin films has changed from Volmer Weber mode to a pseudo Frank van der Merwe mode with the increase in deposition rate. The nanostructured Ti thin films of 150 nm thickness deposited on Si substrate by ion beam sputtering technique were studied by Muraishi et al.Reference Muraishi, Aizawa and Kuwahara16 They show that as deposited films exhibited hcp structure with [0001] textured grains. However, there is still a lack of information on thicker Ti films. Chawla, et al. have studied the effect of sputtering power, pressure, and substrate temperature on structural and morphological properties of magnetron sputtered Ti thick films (2–6.5 µm thickness).Reference Chawla, Jayaganthan, Chawla and Chandra17 Furthermore, in our previous work,Reference Einollahzadeh-Samadi and Dariani18 the morphological analysis had been used to investigate the effect of substrate temperature and deposition rate on crystal structure, grain size, and surface roughness of Ti films of 2700 nm thickness deposited by DC magnetron sputtering. We reported the correlation between optical properties of Ti films and deposition conditions, to present a fundamental recipe for preparing Ti films with desired morphological and optical properties.Reference Einollahzadeh-Samadi and Dariani18 For further investigations, we deposited Ti films of 2400 nm thickness at two different substrate temperatures [room temperature (RT) and 250 °C] and two different deposition rates (66 and 90 nm/min). Also, we decrease the inert gas pressure to 0.8 Pa, which is lower compared to our previous workReference Einollahzadeh-Samadi and Dariani18 where the films were deposited at 1.6 Pa Ar pressure. Then, we correlated Ti film structure, morphology, and optical properties to substrate temperature, deposition rate, and inert gas pressure. Our morphological studies indicate that by increasing the substrate temperature and/or decreasing sputtering rate, as well as decreasing the inert gas pressure, the root-mean-square (RMS) surface roughness will decrease. We also study the changes in the roughness exponent in terms of surface diffusion, grain growth, and flux shadowing mechanisms. Also, we show that the correlation length ξ depends on the growth conditions and can be directly related to the crystalline quality. And we show its coincidence with the x-ray diffraction measurements.
II. EXPERIMENTAL
A. Titanium film preparation
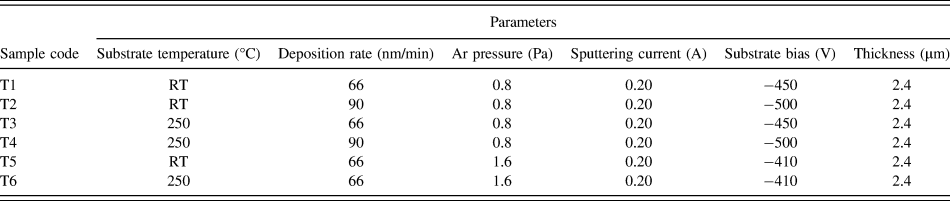
Ti thin films were deposited by DC magnetron sputtering onto an optically transparent conductive glass (Fluorine-doped SnO2 conductive glass, FTO, Pilkington TEC Glass, sheet resistance 8 Ω/square, transmittance 80% in the visible range) substrate using a 99.99% pure Ti target (2 in. diameter and 5 mm thick). The substrates were cleaned by rinsing in ultrasonic baths of acetone, methanol, and deionized water for 20 min to remove any organic contaminations. The base pressure was 6.6 × 10⁻³ Pa and the sputtering was carried out in an Argon atmosphere. The sputtering power was kept constant at 90–100 W, while substrate temperature, deposition rate, and Ar pressure were varied from RT to 250 °C, 66 to 90 nm/min, and 0.8–1.6 Pa, respectively (details specified in Table I). Prior to depositing Ti films, the target was presputtered for 15 min with a shutter located in between the target and the substrate to remove the surface oxide on the target. The target–substrate distance was kept at 100 mm, during deposition.
Deposition conditions of titanium deposited onto FTO glass substrate.

B. Characterization
Thickness of the deposited Ti films was obtained by a field emission scanning electron microscope (FESEM, Hitachi S-4166 model, Japan). Composition of the deposited films was obtained by energy dispersive x-ray (EDX) spectroscopy (INCA Oxford). The structural properties of the Ti films are studied by x-ray diffractometry (XRD, Philips PW 3040, Austin, TX) with Cu Kα (λ = 0.154059 nm) radiation. The surface morphology and the RMS surface roughness of the films are characterized by atomic force microscopy (AFM, Nanosurf Model easy scan2-SPM with an etched silicon cantilever in contact mode, Liestal, Switzerland). The scans are extended over 5 µm2 × 5 µm2 areas. Optical reflection measurements are carried out by using a spectrophotometer (Ocean Optics model HR 4000 CG-UV-NIR, Dunedin, FL) spanning the wave length range from 200 to 1100 nm.
III. RESULTS AND DISCUSSION
In this section, we analyze the prepared samples and discuss the results. These analyses include; structural, morphology, and optical properties of the samples.
A. Structure
Figure 1 illustrates the XRD patterns of Ti films, which are deposited under different conditions. It is found from the figure that the films exhibit crystalline structure with only α-Ti phase and hcp structure (JCPDS 44-1294). Actually, the diffraction patterns show that the films exhibit characteristic peaks of α-Ti crystal planes, i.e., (002), (100), (101), (102), (110), and (103). Also, strong (002) preferential orientation in the Ti films could be seen, which indicates crystalline structure with a preferential orientation along “c” axis. Furthermore, the 2θ position of the 002 peak in all the Ti films is higher than the value of 38.42° reported for the bulk Ti.Reference Sailor and McCarthy19 This shift in the peak position is due to the uniform distribution of the internal stress in the Ti films.Reference Cullity20 Such a relative shift in the 002 peak position ranges from 38.70° to 39.47° for different deposition conditions.
X-ray diffraction patterns of 2.4 µm Ti films deposited onto FTO glass substrate as a function of (a) substrate temperature and deposition rate (deposited at fixed Ar pressure of 0.8 Pa) and (b) substrate temperature and Ar pressure (deposited at fixed deposition rate of 66 nm/min) as tabulated in Table I.
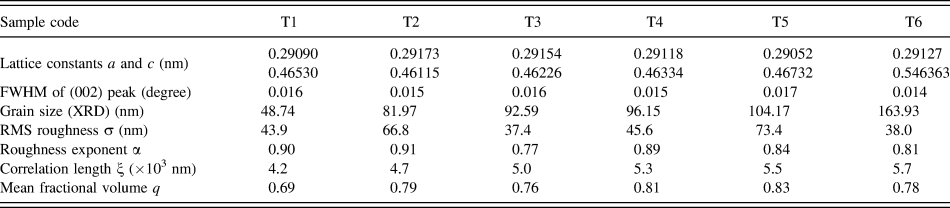
Figure 1(a) shows the XRD patterns of Ti films deposited at a fixed Ar gas pressure of 0.8 Pa, but at different substrate temperatures (RT and 250 °C) and different deposition rates (66 and 90 nm/min). Table II shows the calculated values of lattice constants a and c for the films, which are in good agreement with those reported for a bulk α-Ti phase crystal.Reference Andersson, Collen, Kuylenstierna, Magneli, Magnéli, Pestmalis and Åsbrink21 By comparing the XRD pattern of the samples shown in Fig. 1(a), it can be found that from sample T1 to T3 (i.e., with increasing the substrate temperature, see Table I) the position of 002 peak is shifted to higher angles (from 38.80° to 39.12°). The same result keeps when we increase the deposition rate (from T1 to T2). We notice that the intensity ratio of (002) preferred orientation becomes stronger by increasing substrate temperature and/or increasing deposition rate [see Fig. 1(a)]. This could be due to the increase in the energy of incident atoms which can improve the crystal growth. Such a behavior is also reported by other research groups.Reference Sonoda, Watazu, Zhu, Shi, Kato and Asahina22,Reference Zhang, Zhong, Zhou and Sun23 Also, Fig. 1(b) shows the XRD patterns of Ti films deposited at the fixed deposition rate of 66 nm/min but at different substrate temperatures (RT and 250 °C) and also at different Ar gas pressures (0.8 and 1.6 Pa). It is clear from Fig. 1(b) that the position of 002 peak is shifted to lower angles (from 38.80° to 38.15°) by increasing the Ar pressure (from 0.8 to 1.6 Pa) indicating an increase in the lattice constant (see Table II). Actually, by increasing the Ar pressure (from sample T1 to T5 and from sample T2 to T6) the lattice constant increases (from 0.46530 to 0.46732 nm and from 0.46115 to 0.46363 nm, respectively). Furthermore, at lower substrate temperature, the intensity ratio of the refractive peaks for lower pressure is stronger than that of the higher pressure samples. Obviously, this could be due to the increase in the Ar pressure decreases the energy of incident atoms evaporated at low substrate temperatures, and therefore, leads to a reduction in the crystal growth of the film.Reference Klabunde, Löhmann, Bläsing and Drüsedau24,Reference Sasaki and Nafarizal25 In contrast, there is no clear change in the peak intensity ratio with increasing the Ar pressure at higher substrate temperature. One also can easily distinguish the peaks associated with SnO2 (JCPDS 46-1088), component of the FTO glass substrate, where are marked by filled circles in the figure. Beyond these extra peaks, the spectra show no characteristic peaks of any impurities or other phases of Ti.
Lattice constant, RMS roughness, FWHM, grain size, roughness exponent, correlation length, and mean fractional volume of Ti deposited films at different sputtering conditions.
Bulk values of lattice constants; a = 0.29505 nm, c = 0.46826 nm.
To assess the crystalline quality of the deposited films, the crystalline grain size (d) is evaluated according to the Williamson–Hall's formulaReference Williamson and Hall26:
 $${{\beta {\rm{cos}}\,\theta } \over \lambda } = {1 \over d} + \eta {{{\rm{sin}}\,\theta } \over \lambda }\quad ,$$
where β is the full width at half maximum (FWHM) of XRD peaks (in radians) (Table II), λ is the x-ray wave length (Cu Kα = 0.154 nm), θ is the Bragg diffraction angle, η is the lattice stress in the sample, and d is the average grain size which is the unknown parameter and should be calculated from this formula. To determine the effect of sputtering conditions on the crystalline grain size, the Williamson–Hall plot is performed and shown in Fig. 2. The solid lines in the figure present the linear fits to the data; therefore, the grain size values can be obtained from the plot through the intercept of the fitted lines with the vertical axis. The estimated grain sizes are summarized in Table II. According to these results, the deposited Ti films onto FTO glass contain nanocrystalline grains of about 48–163 nm. The film deposited at 250 °C, 66 nm/min, and 1.6 Pa (sample T6) has the minimum FWHM (0.014°) and the maximum d (163.93 nm) and is expected to possess the best crystalline quality. As Fig. 2 shows, sample T6 has the strongest (002) diffraction peak, that is, the stronger the (002) diffraction, the better the crystal quality.
Williamson–Hall plot to determine the crystalline size of Ti films deposited at different (a) deposition rate and substrate temperature (deposited at fixed Ar pressure of 0.8 Pa) and (b) substrate temperature and Ar gas pressure (deposited at fixed deposition rate of 66 nm/min).
Moreover, it can be observed that the substrate temperature and the deposition rate have direct effect on the grain size, which is in agreement with the reports of Refs. Reference Thornton13, Reference Liu and Yang27, and Reference Savaloni and Kangarloo28. It can also be concluded from Table II that the crystalline grain size monotonically increases with temperature and/or deposition rate. Such a dependence of the grain size on the substrate temperature can be consistently described by the activation energy model proposed by Grovenor et al.Reference Grovenor, Hentzell and Smith29 However, for the films deposited at the constant temperature, an increment of the deposition rate from 66 to 90 nm/min leads to the strong coalescence of the neighboring grains which in turn results in larger grains.
From Table II, it can be also seen that for the samples deposited at 0.8 Pa (T1 to T4) the estimated grain size ranges from 79 to 96 nm. These values are approximately half of the grain size values (ranging from 104 to 163 nm) for T5 and T6 which are deposited at 1.6 Pa. Therefore, one may concluded that the grain size increases linearly with the Ar pressure.
B. Surface morphology
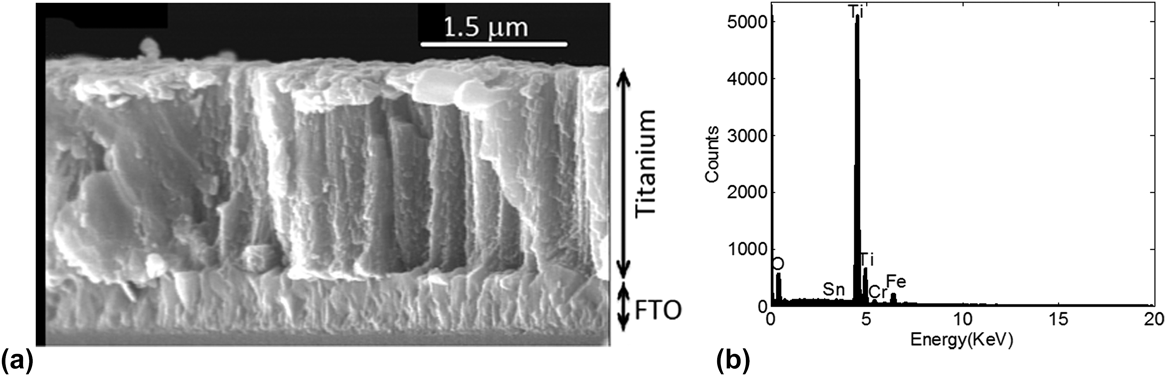
Figure 3(a) shows a cross-sectional view of a Ti film deposited at RT, 66 nm/min, and 0.8 Pa Ar atmosphere onto FTO glass substrate (sample T1). As the image shows the Ti film thickness is about 2.4 µm. Furthermore, void free microstructure with uniform and compact surface morphology without peeling and cracking with columnar structure can be observed in the film. The result of the chemical analysis by EDX spectroscopy [Fig. 3(b)] indicates that an almost pure Ti film is formed with a low oxygen contamination level (below 2%). Also, the EDX spectra reveal that the FTO glass substrate is composed of Sn and O, as it is clearly confirmed by the XRD patterns [Figs. 1(a) and 1(b)].
(a) Cross-sectional FESEM image of Ti thin films deposited at room temperature, 66 nm/min, and 0.8 Pa Ar atmosphere and the corresponding (b) EDX.
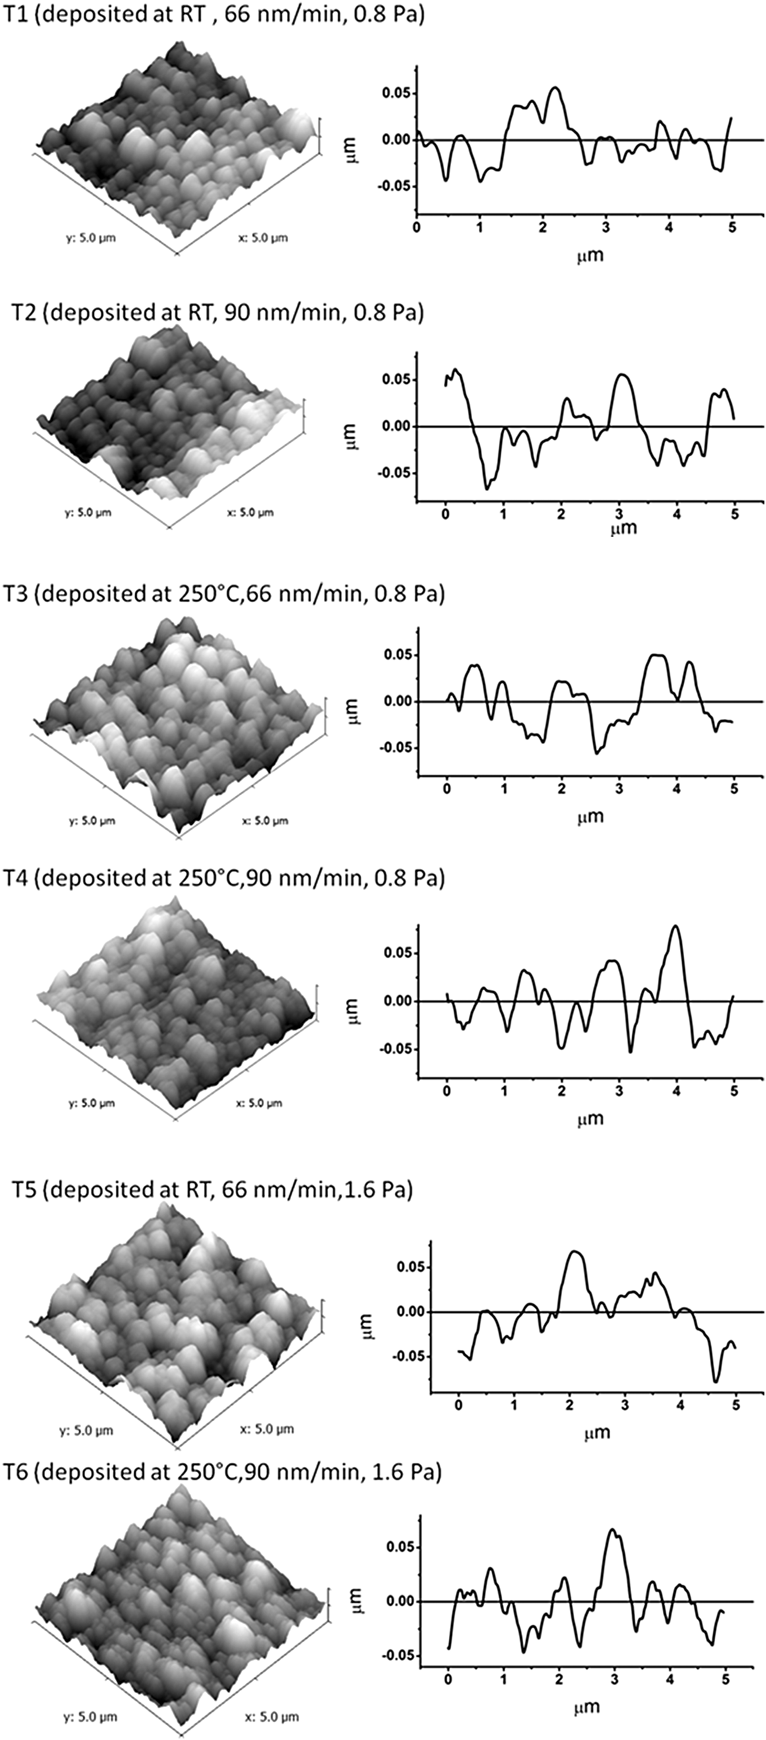
The surface morphology and the grain structure of the Ti thin film deposited onto FTO glass substrate at different sputtering conditions are characterized by AFM images (Fig. 4). The figure shows that the film is composed of grains with diameter of about 75–95 nm, which confirms the nanocrystalline nature of Ti films. The three-dimensional AFM images accompanying line profiles of the studied samples are shown in Fig. 5. The studied surfaces are equal to 5 µm × 5 µm in area. The 3D images of Ti films clearly indicate that the morphology is relatively uniform for all films. To obtain more information about the RMS surface roughness, in this study we performed a particle analysis. The values of RMS surface roughness of Ti films deposited at various substrate temperatures, deposition rates, and Ar gas pressures are computed by surface profile length (Fig. 5) and given in Table II. As the table shows, sample T3 deposited at 250 °C, 66 nm/min, and 0.8 Pa has smoother surface compared to the other samples. It is concluded that smoother films can be obtained at higher substrate temperatures and/or lower deposition rates and/or lower Ar pressures. Moreover, the quantitative information of the surface morphology can be extracted from the height–height correlation function H(r), defined asReference Qi, Huang, Tang, Cheng, Shao and Fan30:
 $$H\left( r \right) = {1 \over {N\left( {N - n} \right)}}\mathop\sum\limits_{j = 1}^N {\mathop\sum\limits_{k = 1}^{N - n} {{{\left[ {h\left( {k + n,j} \right) - h\left( {k,j} \right)} \right]}^2}} } \quad .$$
Grain structure of Ti thin films deposited at different sputtering conditions studied by AFM.
3D AFM images (the scanned area 5.0 µm × 5.0 µm) and accompanying line profiles of Ti thin films deposited at different sputtering conditions.
Here h(k,j) is the height of the measured surface by AFM at the point (k,j), N × N the total number of points at which the surface heights have been measured. For a self-affine surface, H(r) scales asReference Als-Nielsen and McMorrow31:
 $$H\left( r \right) = 2{\sigma ^2}\left\{ {1 - \exp \left[ { - {{\left( {{r \over \xi }} \right)}^{2\alpha }}} \right]} \right\}\quad ,$$
where σ is the RMS surface roughness, α is the roughness exponent, and ξ is the correlation length. When r is smaller than ξ, H(r) scales as H(r) ∼ r 2α, while for r larger than ξ, H(r) approximately saturates to a constant value. Figure 6 shows the height–height correlation functions in the log–log scale for the samples. The roughness exponents α can be extracted from a linear fit to H(r) in the short-range part and are listed in Table II. With roughness exponent α and RMS surface roughness σ, the correlation length ξ can be obtained by fitting the curve of H(r) with Eq. (3) (Table II). These three surface parameters σ, α, and ξ are independent from each other and completely characterize roughness of a surface. In fact, when the Ti atoms approach the substrate surface, three major phenomena contribute in the depositing process: shadowing effect, surface diffusion effect, and grain growth. The competition between these three processes will determine the roughness exponent. Surface diffusion effect, which tends to smooth the surface, is the only process responsible for lowering the exponent, while the shadowing effect and oriented grain growth destabilize surface smoothness during the film deposition. Therefore, they will increase the roughness exponent.Reference Zhang, Ma and Zhang32
Height–height correlation function H(r) plot to determine roughness exponent α and correlation length ξ of Ti films deposited at different (a) deposition rate and substrate temperature (deposited at fixed Ar pressure of 0.8 Pa) and (b) substrate temperature and Ar gas pressure (deposited at fixed deposition rate of 66 nm/min).
As Table II shows, from T1 to T3 (from T1 to T5) by increasing the substrate temperature (increasing Ar pressure), the roughness exponent decreases from 0.90 to 0.77 (from 0.90 to 0.84). For Ti film deposited at RT, the larger roughness exponent α of 0.90 can be explained based on the shadowing effect mechanism. Shadowing is a phenomenon arising from the geometric constraints imposed by the roughness of the growing film which leads to a rough surface with columnar growth structure.Reference Wang and Zhang33 With increasing the substrate temperature from RT to 250 °C, the Ti atoms will obtain higher energy. Therefore, the surface diffusion effect is dominant, yielding a relatively smoother surface with lower RMS surface roughness values and roughness exponents. On the other hand, increasing deposition rate from 66 to 90 nm/min at low Ar pressure (from T1 to T2 and/or T3 to T4) leads to a 1.1–3.1% increase in the roughness exponent. While this value is a 16.3% increase in the roughness exponent at high Ar pressure (1.6 Pa). In the films deposited at high deposition rate and high Ar gas pressure, the nucleation and fast grain growth overcome the surface diffusion of Ti atoms, and therefore, a higher roughness exponent can be achieved.
The correlation length can be interpreted as the average distance between two defects, or dislocations, or any other kind of imperfections in the crystal. Thus, ξ should reflect the crystalline quality.Reference Ganguli and Ingale34 In other words, a higher defect or dislocation density corresponds to a smaller value of the correlation length and vice versa. The relatively high values of ξ ∼ 4.2 × 10³–5.7 × 10³ nm for all the samples indicate the low density of defects or dislocations existing in the deposited Ti films. This is also confirmed by the XRD spectrum with a remarkably high intensity 002 peak [Figs. 1(a) and 1(b)] and the crystalline grain size (Table II). As Figs. 1(a) and 1(b) show sample T6 has the highest (002) peak intensity and mean while from Table II we notice that the highest value of crystalline grain size and correlation length is obtained for this sample.
Finally, considering both the XRD and AFM results, it is obvious that the mean diameter of the grains and RMS surface roughness is sensitive to substrate temperature, deposition rate, and Ar gas pressure. The influence of these deposition parameters on the mean grain size and the roughness characterization can be related to the adatom mobility during film deposition. It means that at higher substrate temperatures, surface adatoms have enough energy to migrate on the substrate, so the intergrain voids begin to be filled in and the structure transforms into a transition zone of tightly packed fibrous grains with smoother surface.Reference Chinmulgund, Inturi and Barnard12 Also, samples deposited with the higher deposition rate, show larger spherical grains with a relatively rough surface (see Table II). In fact, increasing the deposition rate leads to the strong coalescence of the neighboring grains, which in turn results in larger grains and rougher surface morphology.Reference Thornton13 Moreover, comparing samples deposited at different inert gas pressures indicates that increasing the Ar pressure increases the grain size and RMS surface roughness. Actually, increment in the Ar pressure leads to more numerous collisions between atoms on the film and ambient gas atoms, which accompanied with the adatom surface mobility, results in a greater roughness for the resulting surface.Reference Barnes, Kelly, MacKay, Mateeva, O'Brien and Lagally35 In principle, one controls the grain size and RMS surface roughness of the films by controlling the Ar pressure during deposition process.
C. Optical properties
In this subsection, we investigate the effect of sputtering conditions on the optical properties of the Ti films. The reflectivity of the films versus photon energy is shown in Fig. 7. As the figure shows that the reflectivity of all the films increases with decreasing photon energy. From Fig. 7(a), it can be seen that sample T4 (deposited at substrate temperature of 250 °C and deposition rate of 90 nm/min) has the highest reflectivity between the samples deposited at fixed Ar pressure of 0.8 Pa. In Fig. 7(b), we compare the samples deposited at fixed deposition rate of 66 nm/min. The figure indicates that sample T5 (deposited at substrate temperature of 250 °C, and Ar pressure of 1.6 Pa) has the highest value of the reflectivity compared to the samples deposited at RT and Ar pressure of 0.8 Pa. Therefore, it can be concluded that the decrement of the reflectivity for the samples deposited at low substrate temperature is related to the loss scattering which are the highest for these samples because of their high roughness (see Table II and related discussion).Reference Bennett, Bennett and Nagel36 To achieve more information about the effect of the deposition conditions and morphology on the optical properties of the samples, their refractive index,  $\hat N\left( E \right) = n\left( E \right) - i\kappa \left( E \right)$, can be calculated from their reflectivity spectrum. In fact, the real and imaginary parts of the refractive index are evaluated by applying the Kramers–Kronig relations to the reflectance data.Reference Lucarini, Saarinen, Peiponen, Vartiainen and Rhodes37
Reflectivity of Ti films deposited at different (a) deposition rate and substrate temperature (deposited at fixed Ar pressure of 0.8 Pa) and (b) substrate temperature and Ar gas pressure (deposited at fixed deposition rate of 66 nm/min).
Figure 8 shows the real and imaginary parts of the film refractive index versus photon energy for the different sputtering conditions. As the Figs. 8(a) and 8(b) represent the real part of the refractive index, n increases with increasing photon energy. Increasing the deposition rate (from sample T1 to T2, deposited at RT and 0.6 Pa) the real part of refractive index increases from 0.35 to 0.6 at 1.5 eV and from 0.78 to 0.95 at 5 eV [Fig. 8(a)]. Also, as the Fig. 8(b) shows, increasing the Ar pressure (from sample T1 to T5, deposited at RT and 60 nm/min) the real part of refractive index increases from 0.35 to 1.3 at 1.5 eV and from 0.8 to 0.9 at 5 eV. In the low photon energy region (below 2.0 eV), increasing the substrate temperature at constant Ar pressure and deposition rate increases the real part of refractive index, for instance, increasing the substrate temperature from sample T1 to T3 increases the real part of refractive index from 0.13 to 0.5. Whereas, in the high photon energy region (above 4 eV), increasing the substrate temperature at constant Ar pressure and deposition rate shows no clear effect [Figs. 8(a) and 8(b)].
Real and imaginary parts of refractive index of Ti films deposited at different (a) deposition rate and substrate temperature (deposited at fixed Ar pressure of 0.8 Pa) and (b) substrate temperature and Ar gas pressure (deposited at fixed deposition rate of 66 nm/min).
The relationship between deposition conditions and the extinction coefficient κ is also shown in Figs. 8(a) and 8(b). Ti films deposited at RT, 66 nm/min, and/or lower Ar pressure represent lower extinction coefficient than the films deposited at 250 °C, higher deposition rate, and/or higher Ar pressure [Figs. 8(a) and 8(b)]. In addition, by increasing the substrate temperature, an increase in the refractive index can be observed, as shown in Figs. 9(a) and 9(b). Any increase in the refractive index with increasing the substrate temperature attributes to the decreased surface roughness, which in turn decreases the surface optical scattering and optical loss.Reference Yoon, Kim, Kim, Lee and Yoon38–Reference Lai, Li, Wang, Hu, Wang, Hou, Song and Jiang40 It can be seen that the refractive index of the samples slightly increases with the increase of the deposition rate [see Fig. 9(a)]. We argue that the denser structure (see below for further discussion) is a reason for larger refractive index of the film deposited at higher deposition rate.
Refractive index of Ti films deposited at different (a) deposition rate and substrate temperature (deposited at fixed Ar pressure of 0.8 Pa) and (b) substrate temperature and Ar gas pressure (deposited at fixed deposition rate of 66 nm/min).
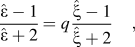
Moreover, it can be extracted from the Figs. 8(a) and 8(b) that the real and imaginary parts of the refractive index increase with any increment in the Ar pressure. This is also true for the total refractive index of the films [Fig. 9(b)]. Actually, at low sputtering gas pressures, more intensive collisions between the particles occur, leading to the formation of looser films. Hence, the Ti films deposited at lower Ar pressure are less dense than the films deposited at the higher pressure. This finding is in coincidence with the other reported resultsReference Muraishi, Aizawa and Kuwahara16,Reference Chawla, Jayaganthan, Chawla and Chandra17,Reference Thornton41 where by increasing the substrate temperature, deposition rate, and/or Ar pressure an increase in the refractive index was observed. We use Maxwell–Garnett (MG) theoryReference Garnett42 to further clarify the effect of sputtering parameters and the morphology on the optical properties of the Ti film deposited onto FTO glass substrate. In the MG theory, the dielectric function  $\hat \varepsilon = {\varepsilon _1} + i{\varepsilon _2}$ (where ε1 = n 2 + κ2 and ε2 = 2nκ) of the aggregated system is related to the dielectric function
 $\hat \xi$ of the metal, by the following relationReference Garnett42:
 $${{\hat \varepsilon - 1} \over {\hat \varepsilon + 2}} = q{{\hat \xi - 1} \over {\hat \xi + 2}}\quad ,$$
where q is the fractional volume of the metal in the medium and changes between 0 and 1. When q is equal to 1, it means that the system is a bulk metal and as the q decreases, the condensation of the metal in the medium decreases.Reference Lee, Chang, Ogi, Iskandar and Okuyama43 In the other words, the metal's porosity is defined as the pore space in the metal and can be calculated by 1 − q. Measuring the optical properties and calculating the values of q give useful information about roughness, condensation, and aggregation of the films. The values of q are calculated for the samples with the different sputtering conditions and plotted versus the photon energy in Fig. 10. Also, the mean value of q is tabulated in Table II. As Fig. 10 and Table II show, the value of q depends on the deposition conditions and morphology of the films. By increasing the substrate temperature from RT to 250 °C and/or increasing the deposition rate from 66 to 90 nm/min as well as increasing the Ar pressure from 0.8 to 1.6 Pa, the q value increases (Table II). This is in agreement with the argument that by increasing the substrate temperature, the deposition rate and/or sputtering pressure the separation of the metallic grains decreases and leads to reduction of the voids density or porosity in the deposited films.Reference Liu and Yang27,Reference Thornton41 It can be concluded that this increment in the q value (decrement in the porosity) is another reason for increasing the refractive index value by increasing substrate temperature, deposition rate, and/or sputtering gas pressure.
Fractional volume (q) of Ti films deposited at different sputtering conditions as listed in Table I.
IV. CONCLUSION
In summary, Ti film has been successfully deposited using DC magnetron sputtering technique and its compositional, structural, morphological, and optical properties were studied. The EDX spectrum confirmed that there were no elemental impurities present in the deposited film composition. The XRD results revealed that the films possessed hcp symmetry with (002) preferred orientation having a lattice parameter a = 0.291 nm, c = 0.463 nm. Furthermore, the deposited Ti films onto FTO glass contain nanocrystalline grains of about 48–163 nm. This difference in grain size of the Ti films is due to the difference in sputtering conditions (substrate temperature, deposition rate, and Ar pressure). The grain size evaluated from the AFM measurements is in the range of 75–90 nm. Both the XRD and AFM studies show that the films are nanocrystalline. From the AFM results, we deduce that the roughness of the Ti films decreases with increasing substrate temperature and decreasing deposition rate. It is found that, increasing the Ar pressure at high substrate temperature has a negligible impact on the roughness of the surface. The optical properties of the film have also been found to controllably depend on the deposition conditions. We have shown that by decreasing the roughness and increasing the crystalline grain size, the refractive index of the films and the values of fractional volume q increase. So, it has been found that the morphology, denseness, and optical properties of the deposited films can be optimized by controlling the deposition conditions, such as substrate temperature, deposition rate, and inert gas pressure. These findings could provide good insight into the surface treatment for desirable applications, including electrochemical anodization of Ti films to synthesize TiO2 nanotube arrays.