1. Introduction
The study of palaeogeography has been carried out for years. This is why some find this field of research somewhat outdated. However, it is not the case and much more work needs to be done from a local to regional scale. The techniques employed to reconstruct global palaeogeographies have not varied much for decades, but the study of palaeogeography can now be revived using an alternative method: the coupling of multiple global models, among which plate tectonic, topographic, climate and vegetation models are regarded as the most important.
The present paper aims to report advances in palaeogeography using this alternative technique and presents the prospective methods to advance it further: the study of palaeogeographies (in plural), i.e. the evolution of palaeogeographies and their interactions with most of the fields of geosciences. Hence, the paper is constructed as follows: After a brief review of the main characteristics of ‘classic’ reconstructions (sections 2 & 3), an alternative and complementary approach will be presented (section 4), which is the approach used for the Panalesis model currently under development. Section 5 shows that Panalesis is designed to couple a global plate tectonic model with a topographic model, a climate model and a vegetation model. If such an approach can shed new light on the study of palaeogeographies (section 6), the aim is to go further and integrate a maximum number of constraints stemming from a large variety of fields of geosciences (section 7). Addressing palaeogeography ‘upside down’, i.e. the opposite to what is usually done, is believed to be a fructuous way to make advances in this active area of research (section 8).
2. Global palaeogeography
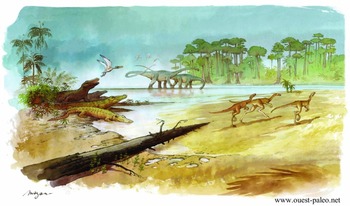
The term palaeogeography encompasses many aspects. For most people, talking about palaeogeography implicitly refers to a description of the palaeoenvironment as per Figure 1. However, at a global scale, objects smaller than a hundred kilometres will be hardly distinguishable. It means that an object as big as the present-day Lake Geneva for instance (at the border between France and Switzerland) would not be visible on a global reconstruction. It is a real problem because geologists will (rightly) argue that they report major lacustrine sequences (hundreds of metres thick and tens of kilometres long) that will not appear on global reconstructions.
Example of a beautiful palaeoenvironment as proposed by palaeoartists (here after Pierre Lavaud, alias Mazan, for an excavation site in Angeac, France). Such a reconstruction, however, must not be confused with global palaeogeography for which the temporal and spatial resolution is totally different.
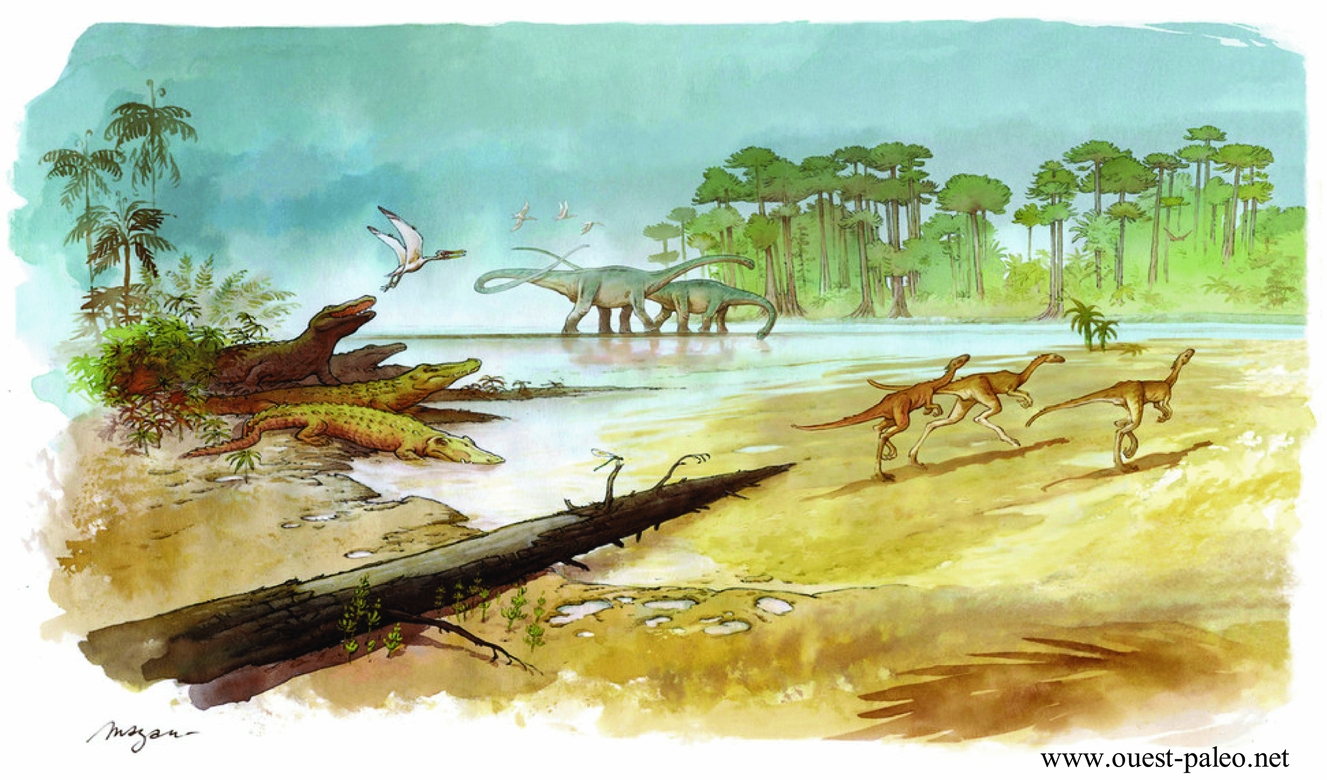
Similarly, the definition of the global coastline in the geological past is a huge issue. Not only does the spatial resolution issue mentioned above remain, but rapid sea-level changes over geological time add temporal uncertainty to the system. For the time being, therefore, the definition of palaeoenvironments all over the planet at a given geological time in the past (such as the beautiful picture in Fig. 1) is beyond our capabilities. A ‘Google Earth of palaeogeography’, where one can change the scale from a global view to a ‘street view’, might be the ‘Holy Grail’ to some but will remain unattainable for a long time.
3. ‘Classic’ palaeogeographic reconstructions
From pioneers in palaeogeographic reconstructions (Dewey & Bird, Reference Dewey and Bird1970; Scotese, Reference Scotese1976) up to now (e.g. Torsvik & Cocks, Reference Torsvik and Cocks2017), the same techniques have been employed to reconstruct palaeogeographies of the geological past. At a given locality, the palaeoenvironment is reconstructed from evidence mainly stemming from lithostratigraphic and palaeontological analyses, with a large emphasis on the shoreline (say, environments between the upper intertidal zone and the base of the photic zone). Those pieces of information are averaged out over a regional scale to account for temporal uncertainty issues and geological gaps (tectonic complications, eroded series, etc.). This huge and difficult work is repeated in as many places as possible on the planet. Then, the reconstructions are interpolated in order to propose a global palaeogeographic reconstruction. With the intention of covering most of the planet, series of different ages are considered for a given reconstructed point in time. Typically, series with an age of ± 5 Ma around the reconstructed time are considered temporally equivalent so that most palaeogeographic models propose reconstructions at best every 10 Ma. Obviously, an environment such as the one shown in Figure 1 may profoundly change in ± 5 Ma.
4. A different and complementary approach for global reconstructions
The proposed approach is different but not contradictory to the ‘classic’ approach. It relies on the fact that palaeogeographic reconstructions are primarily the concatenation of four main aspects: plate tectonic reconstruction, combined with a topographic reconstruction, climatic reconstruction and biosphere reconstruction. The latter is impossible to model in its entirety and complexity (as per Fig. 1 for instance), but we start from the premise that the global vegetation cover at least can be modelled and is of primary importance because of feedbacks on climate and topography and therefore on tectonics.
Now, for those four aspects, well-constrained and robust models do exist. They have their own operation, their own evolution, their own limits, and it is suggested that we now have the numerical capabilities to combine them in an integrated model for reconstructing palaeogeographies. This is the aim of the Panalesis model.
So far, the Panalesis model uses: (1) a global plate tectonic model inspired by the model developed at the University of Lausanne (UNIL). It uses the same techniques and savoir-faire (see Vérard, in press) but it is a brand new model with a new architecture designed to be coupled with other models (the UNIL model had too strong limitations for this purpose); (2) a topographic model Vérard et al. Reference Vérard, Hochard, Baumgartner and Stampfli(2015a) where a synthetic topography for most ‘geodynamical environments’ is defined from GIS objects described in the chosen plate tectonic model (in theory any plate tectonic models made in software that uses Geographic Information Systems). It results in a digital elevation model (DEM) for the entire surface of the planet for any reconstructed time slice; (3) the MITgcm, the climate model of MIT (Massachusetts Institute of Technology; http://mitgcm.org/); and (4) the BIOME4 global vegetation model (Kaplan, Reference Kaplan2001). The latter was, however, developed for the present-day vegetation and requires major modification for past vegetation. Once the integration is completed, ‘true’ coupling is planned and extension to other global models is anticipated.
5. Hierarchy for integrated models
The different models to be integrated have various time scales. It is important therefore to define a hierarchy to build the integration.
The core of Panalesis is the plate tectonic model because the changes are the slowest. On top of it, a first-order global palaeo-DEM is defined from our synthetic topography model. Global climate circulation can then be assessed using the MITgcm. From the modelled precipitation, the drainage system is defined on the palaeo-DEM and used for the water cycle to refine the climate model. Once equilibrium is found, the climate is used for the BIOME4 vegetation model, which in turn first of all modifies the land albedo and thus the climate model again.
At this stage, the first integration is complete, and the goal is to really couple the different models so that ‘true’ interaction and feedback can operate. From the first step (integration) to coupling, the various models require numerous specificities.
5.a. Plate tectonic model
The most important characteristic of a plate tectonic model is the definition of plate tectonic boundaries. It is stressed here that a list of Euler poles defining the position of continental fragments does not provide valuable information concerning plate boundaries (see Vérard, in press). Plate boundaries can only be defined from reconstruction to reconstruction. Even the ‘continuously closing plate’ technique (Gurnis et al. Reference Gurnis, Turner, Zahirovic, DiCaprio, Spasojevic, Müller, Boyden, Seton, Constantin Manea and Bower2012) does not help if the former plate shape is undefined. If the former plate shape is known, Gurnis et al.’s (Reference Gurnis, Turner, Zahirovic, DiCaprio, Spasojevic, Müller, Boyden, Seton, Constantin Manea and Bower2012) technique comes down to using the closing polygon option in arcGIS® together with the ‘dynamic plate boundary approach’ of Stampfli & Borel (Reference Stampfli and Borel2002).
Knowing plate boundaries enables the definition of the so-called ‘geodynamical environments’, i.e. mid-oceanic ridges, intra-oceanic subduction zones, active margins, collision zones, etc. surrounding the plates, but also intra-plate ‘geodynamical environments’ such as passive margins, large igneous provinces (LIPs), abandoned arcs, etc. (see Vérard, in press).
The plate tectonic model must also cover 100% of the Earth's surface. If plate tectonic characteristics are only defined partially, integration and coupling with other models will introduce major flaws. It is therefore important to propose in particular a coherent – if not true – scenario for the evolution of the Panthalassic Realm.
5.b. Topographic model
The ‘classic’ method to retrieve topography bears upon studies of local evidence such as lithological facies mostly providing information on deposits surrounding the shoreline or thermochronological (e.g. fission track) data quantifying the amount of uplift. Again, the technique used by Vérard et al. Reference Vérard, Hochard, Baumgartner and Stampfli(2015a) aims not to be contradictory but complementary to those methods on the one hand (meaning that both must be carried out), and on the other hand, to provide solutions not for one locality at one time, but solutions applicable to the entire planet at any chosen time.
The technique exploits information defined within the plate tectonic model and proposes a first-order, synthetic topography. The advantage is that the more robust the plate tectonic model is, the most plausible the topographies are, even if there is no field evidence (e.g. fission track) to support them.
In addition, it has been shown that the need for a palaeo-DEM is crucial to couple a plate tectonic model with other models (Perroud, Brunetti & Vérard, Reference Perroud, Brunetti and Vérard2015; Brunetti, Vérard & Baumgartner, Reference Brunetti, Vérard and Baumgartner2015).
5.c. Climate model
Numerous climate models for general circulation are available. The MITgcm is a coupled ocean and atmosphere model. It has been chosen because it is an open-source code with easy access to information; the ocean dynamics is among the best defined; it uses a cubed-sphere grid avoiding issues at the poles; and overall, topographic conditions can be easily changed.
Several configurations (and modules) can be chosen but we typically use two spatial resolutions (cs-32 with c. 2.8° resolution and cs-64 with c. 1.4° resolution). We include the SPEEDY package for the atmosphere (Molteni, Reference Molteni2003) and the Winton thermodynamic model for the sea-ice component (Winton, Reference Winton2000). Land ice (continental ice sheet) is not included so we run the GRISLI package offline (Ritz, Rommelaere & Dumas, Reference Ritz, Rommelaere and Dumas2001; Colleoni, Reference Colleoni2015). Water drainage is determined under arcGIS® in order to define the localization of fresh water supply to ocean basins.
Brunetti & Vérard (Reference Brunetti and Vérard2017) have shown that the numerical stability of such a model is not trivial and constructing good-quality control runs is crucial for climate simulations of the geological past.
Note that given the resolution used for the climate model, the fact that we define a first-order palaeo-DEM is of minor impact because topography has to be degraded for climate modelling anyway.
5.d. Vegetation model
Preliminary results show that global vegetation cover primarily has an impact on albedo as a feedback in climate modelling. The BIOME4 vegetation model (Kaplan, Reference Kaplan2001) is designed to model the present-day vegetation and is not adapted to deep time, in particular prior to the Cretaceous when angiosperms did not exist. Quantifying the impact of vegetation upon various parameters of palaeogeography is one of the crucial aspects in the coming years. Such work will undoubtedly require developing a specific vegetation model for deep time. However, if albedo remains the most prominent impact of vegetation upon climate, the use of BIOME4 might be viewed as an interesting proxy to assess vegetation cover density and therefore land albedo.
6. What can be expected from an integrated model?
The ‘classic’ method consists in reconstructing local palaeogeographies and interpolating them to obtain a global view. An integrated model somewhat aims at doing the opposite (‘upside down’). From general rules and global modelling, the goal is to propose synthetic solutions that can be tested against local or global data.
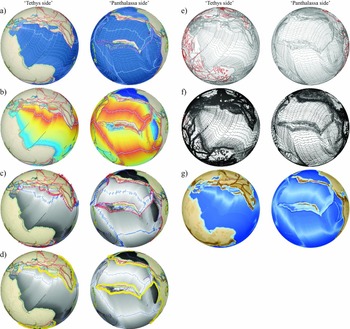
Such work has already been partially done using the UNIL model. From the sole plate tectonic model, Vérard et al. Reference Vérard, Hochard, Baumgartner and Stampfli(2015b) have confirmed, for instance, the first-order relationship between global plate tectonic activity and CO2 content in the atmosphere throughout the Phanerozoic. Many other investigations can be carried out from maps derived from a global plate tectonic model (see examples of derivative maps in Fig. 2). Indeed, it is possible to compute the age of the sea-floor all over the planet at any reconstructed time slice (Fig. 2b). It is also possible to define the rates of accreted material at mid-oceanic ridges and the rate of subduction at trenches (Fig. 2c). And, by combining the last two pieces of information, it is possible to compute the thickness of the lithosphere entering subduction and therefore to assess the volume of subducted material per unit time all around the planet (Fig. 2d). It would therefore be interesting to see whether any relationships exist, for instance, between the amount of subducted material and the petrography or geochemistry of magmatism right above within the upper plate. Such a study has never been conducted so far.
Example of derivative maps from a plate tectonic model: preliminary version for the Jurassic from the Panalesis model. (a) Plate tectonic model showing full reconstruction (continents and ocean) with definition of plate tectonic boundaries all over the planet; (b) interpolation of the sea-floor age; (c) definition of accretion rates at mid-oceanic ridges (blue arrows) and subduction rates at trenches (red arrows); (d) volume of subducted material (yellow circles proportional to subducted material); (e) GIS objects used for 3D conversion; (f) irregular grid generation for 3D conversion (after the technique of Vérard et al. Reference Vérard, Hochard, Baumgartner and Stampfli2015a); (g) interpolation into 3D global topography (palaeo-DEM).
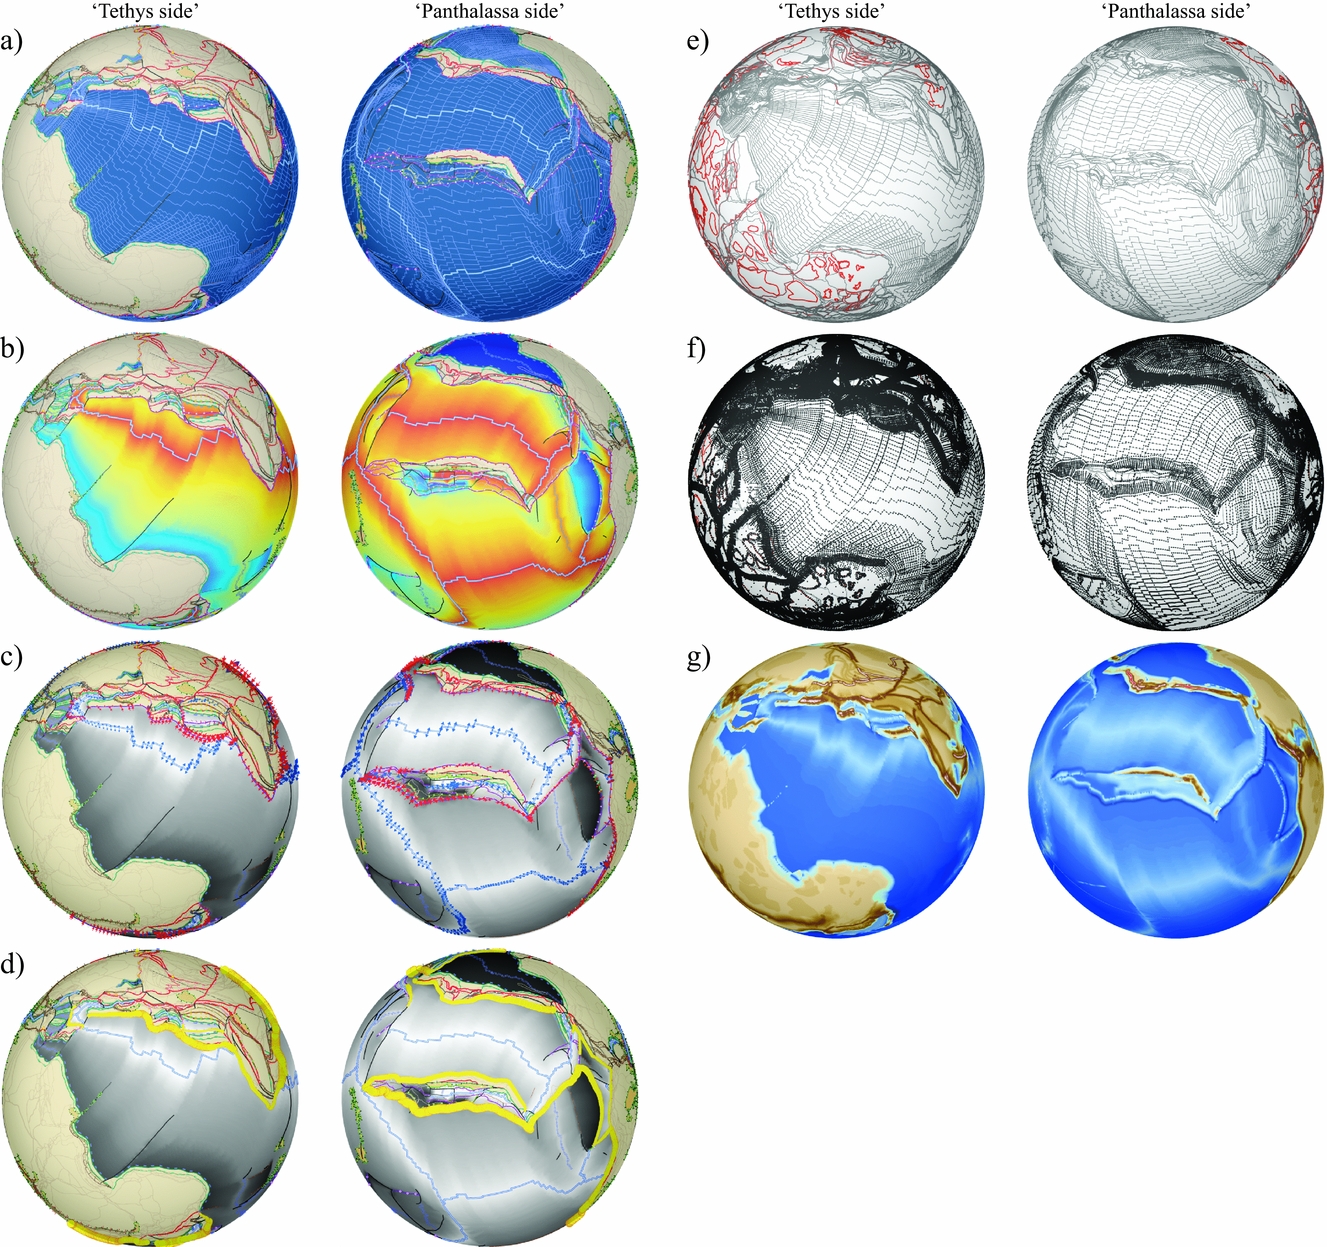
Moreover, with a full plate tectonic model, it is possible to go further. Using GIS objects (Fig. 2e), it is possible to define a grid (Fig. 2f) for global topography (Fig. 2g). After conversion of the UNIL plate tectonic model into 3D (palaeo-DEM), Vérard et al. Reference Vérard, Hochard, Baumgartner and Stampfli(2015a) have already generated synthetic global sea-level changes in good agreement with curves proposed in the literature.
However, an integrated model aims to go even further. The idea is to consider the multifactorial but prominent effects of a series of parameters, and see – through the generation of synthetic data – what they imply. Those synthetic data can then be compared with ‘real’ data at the local or global scale. With such an approach, the amount of data is highly increased, and it is possible to leverage the key sources in as many fields of geosciences as possible. The idea is to constrain the palaeogeographies not only with strict geological data (i.e. rocks) but with a maximum amount of data providing multiple viewpoints (e.g. proxies) about the same issue.
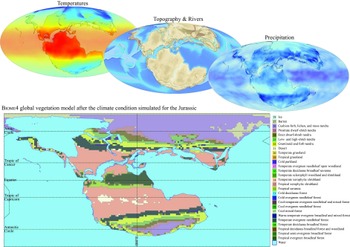
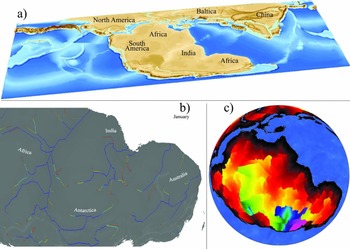
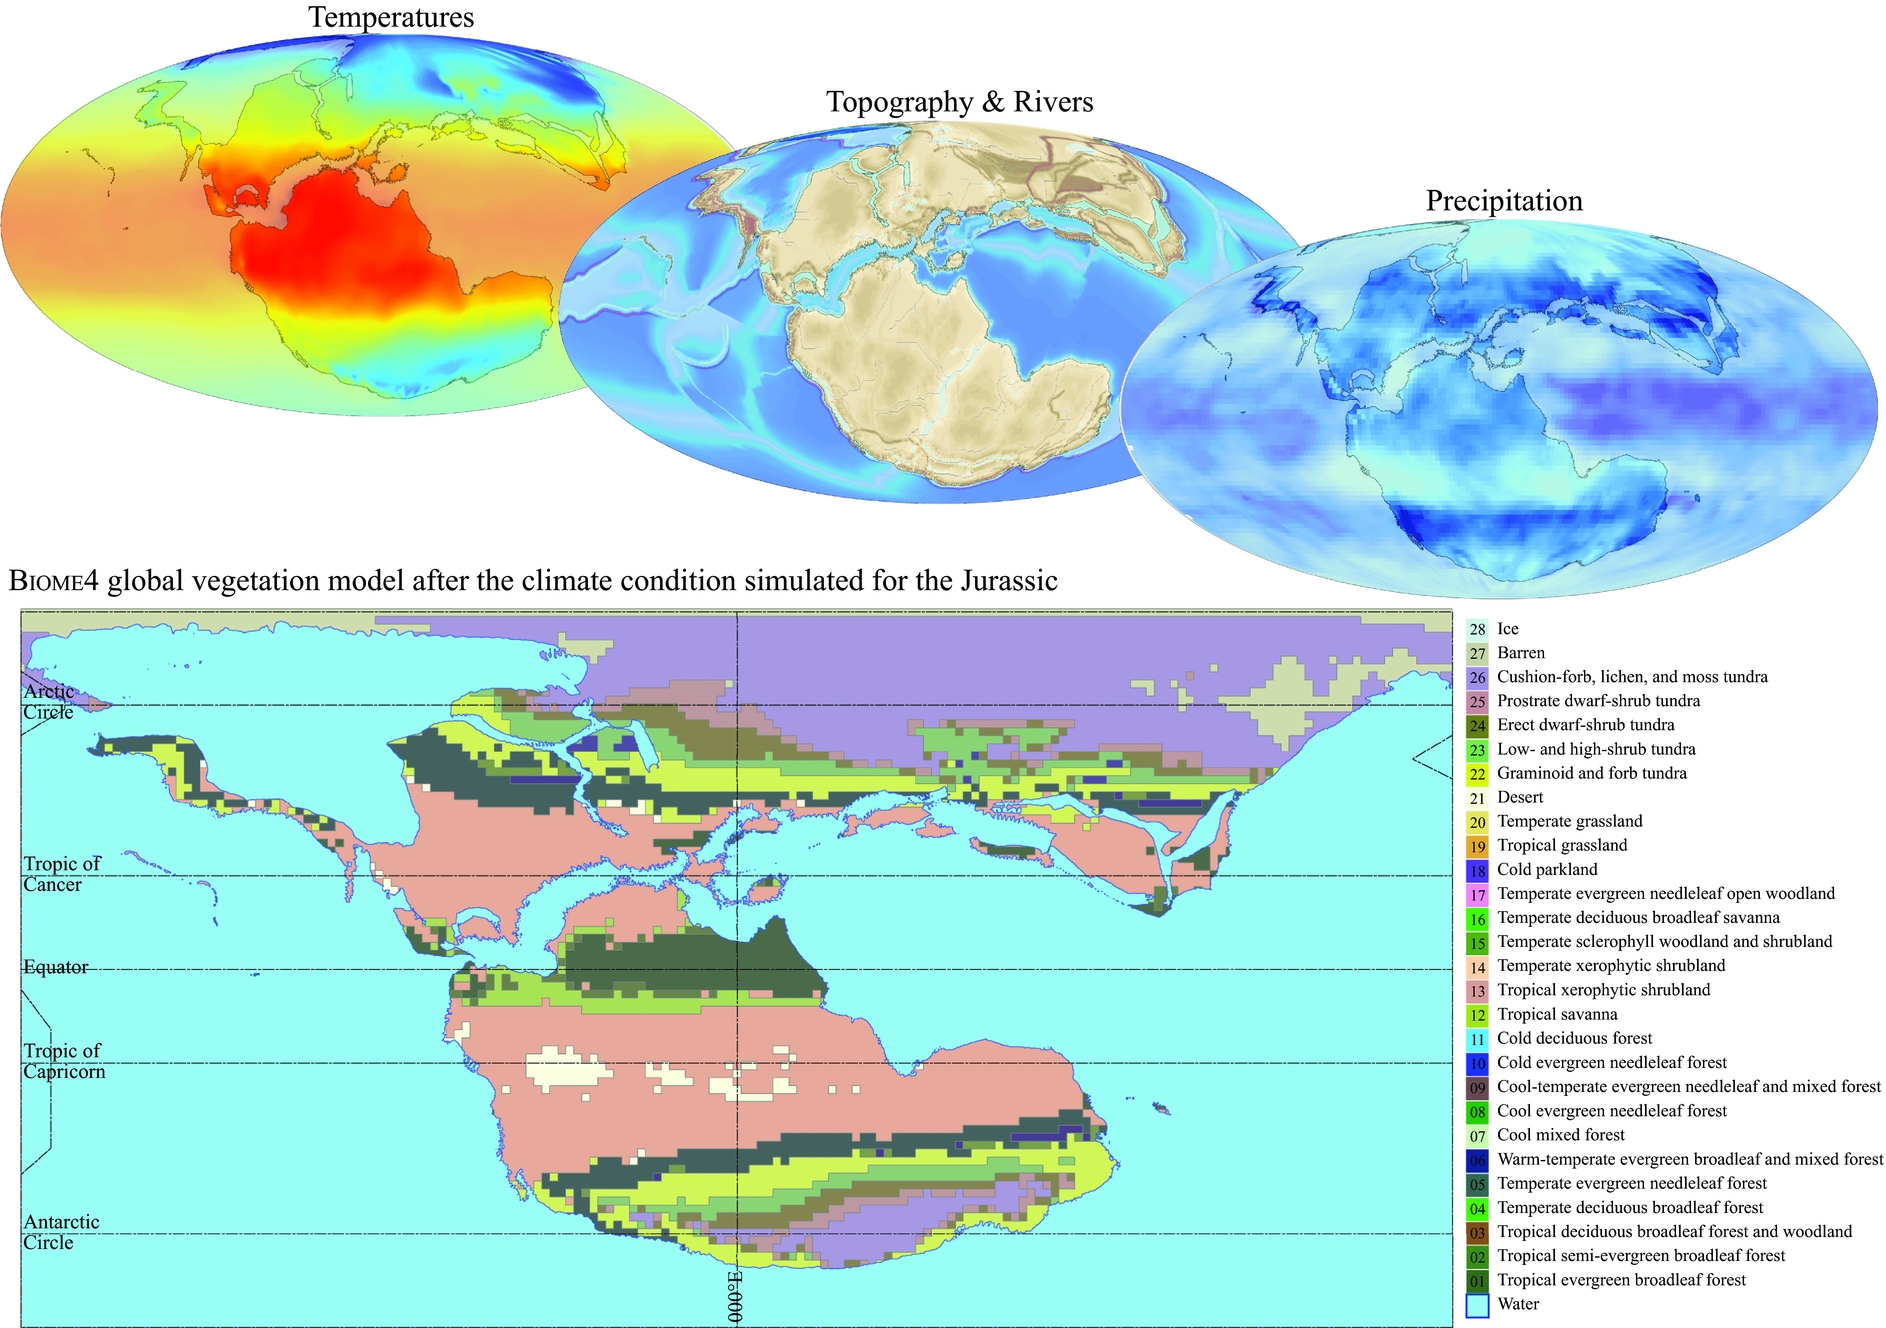
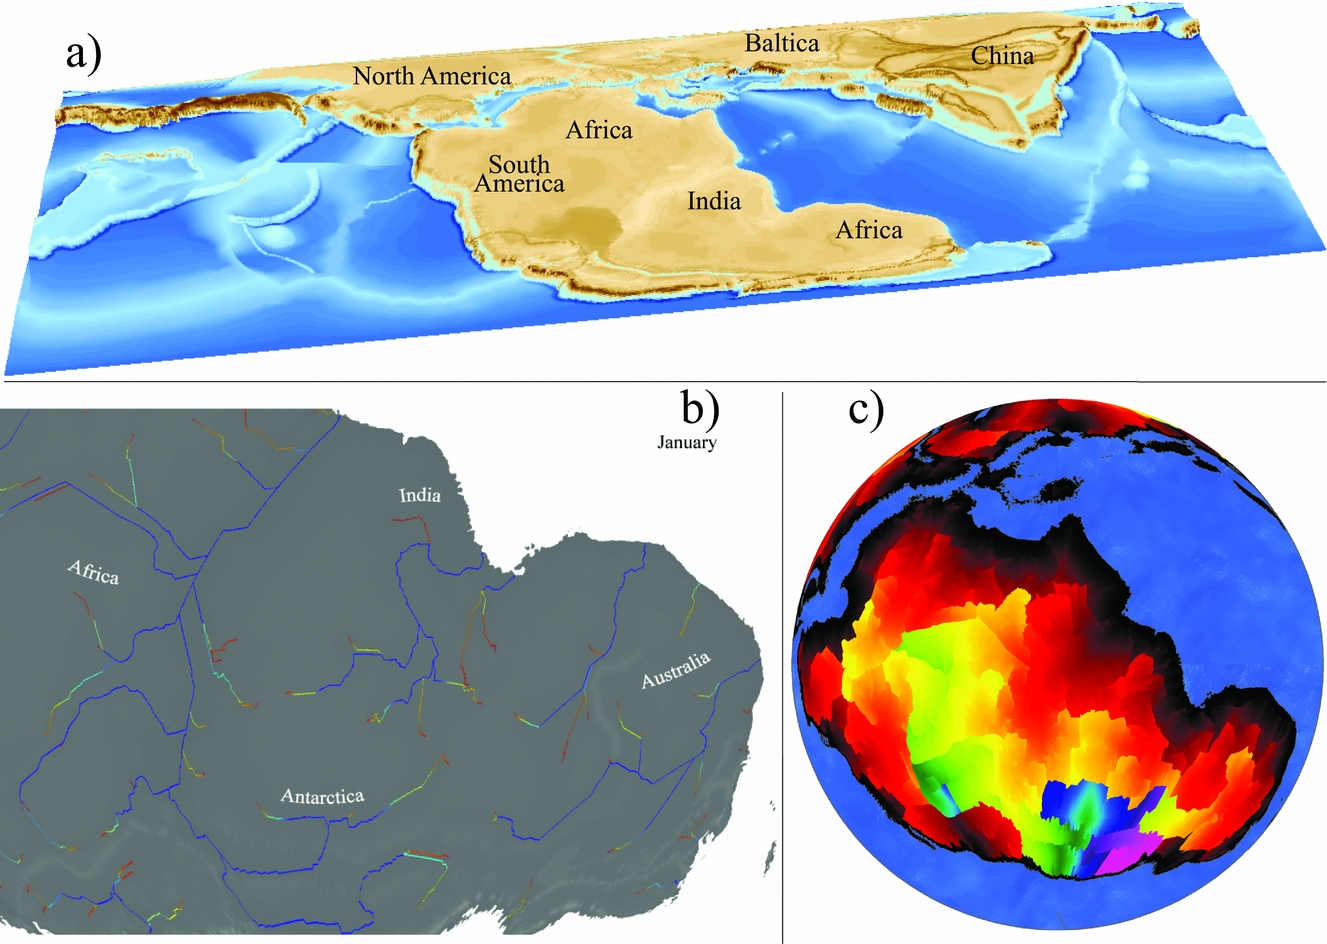
Following the hierarchy mentioned above, integration of the climate model (MITgcm) has already been carried out (e.g. Brunetti, Vérard & Baumgartner, Reference Brunetti, Vérard and Baumgartner2015; Brunetti & Vérard, Reference Brunetti and Vérard2017; Fig. 3). The impact of vegetation is also currently being investigated (Fig. 3) and work is under progress to evaluate the stability of the system and whether multiple equilibria (multiple attractors) exist or whether modelled solutions are relatively unique and robust. For such work, first steps towards ‘true’ coupling are necessary. The appraisal of the drainage system in deep time, in particular, is already used in the water cycle of the climate model (Fig. 4), but it is a call for further investigations in terms of tectonic–climate interaction. It is of particular importance to quantify the impact of climate on relief (and therefore on tectonics) and tectonics on climate through time. ‘True’ coupling thus requires the assessment of erosion rates, sediment fluxes and the amount of sedimentation at the global scale over a long time period.
Climate simulation for the Jurassic Period. The simulated climate conditions are used to run the BIOME4 global vegetation model, which in turn, modifies land albedo and therefore climate.
(a) Example of a palaeo-DEM for the Jurassic Period (Callovian); (b) hydrographic system definition from the precipitation simulated with the MITgcm; here, monthly mean for January in the area of the ‘Gondwana River’ (from red = low flow accumulation to blue = high flow accumulation); (c) definition of drainage basins with colour coding as function of distance along river paths to outfall (from black = short distance to pink = long distance).
7. Advances in palaeogeography
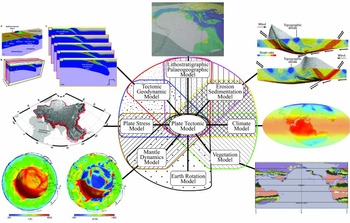
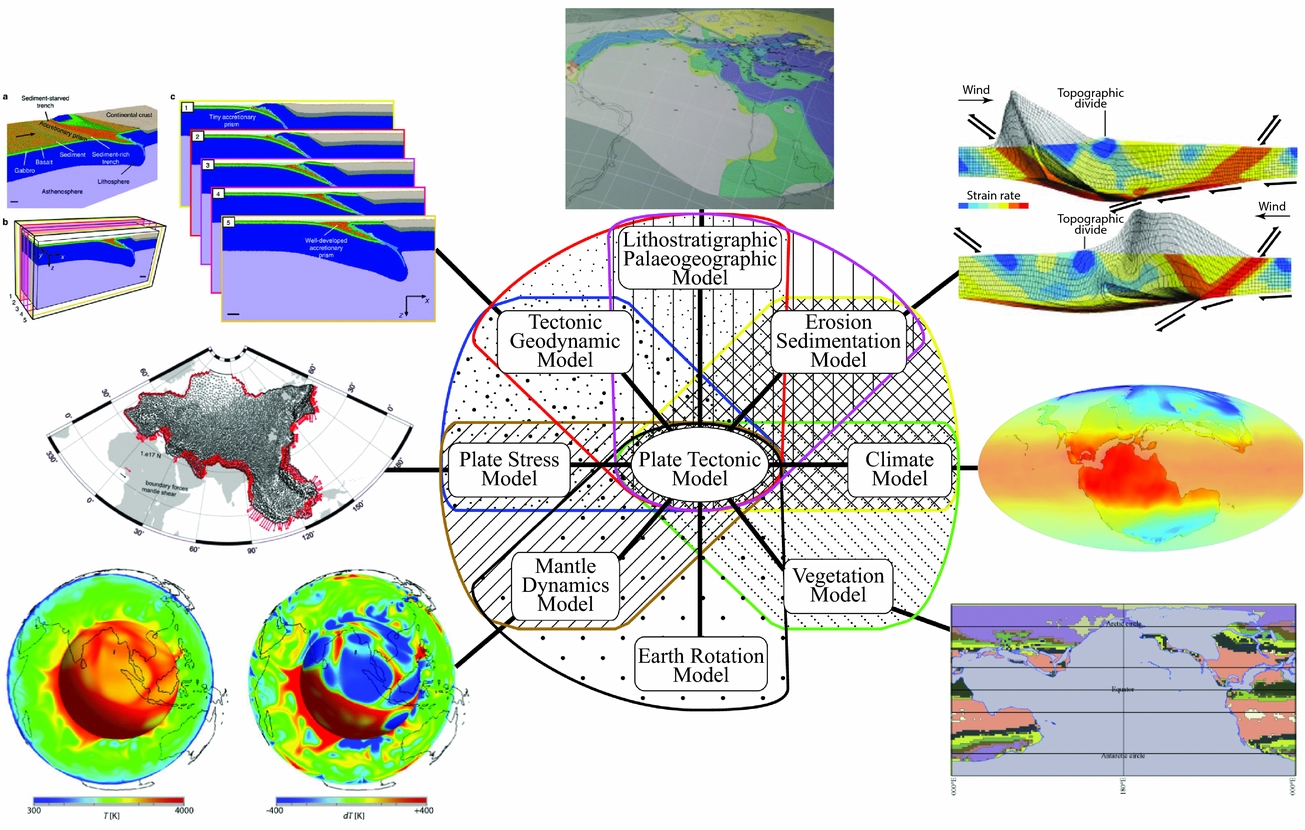
Advances in palaeogeography can be conducted through the coupling of different models around a core: a full plate tectonic model (Fig. 5). It supposes to find solutions or to foster new avenues to revive research in palaeogeography.
Illustration of synergies envisaged for a coupled model such as Panalesis. In addition to the climate model (MITgcm; http://mitgcm.org/; middle right) and vegetation model (BIOME4, Kaplan, Reference Kaplan2001; bottom right), other global models are aimed to be coupled such as mantle circulation models (here illustration after Davies et al. Reference Davies, Goes, Davies, Schubert, Bunge and Ritsema2012; bottom left), lithospheric plate stress model (here after van der Burgt et al. Reference van der Burgt, Govers, Webb, Stampfli, Vérard, Hochard, Davies and Wortel2013; middle left), tectonic model (here after Malatesta et al. Reference Malatesta, Gerya, Crispini, Federico and Capponi2013; top left), lithostratigraphic model (here after Wilhem, Reference Wilhem2014; middle top), tectonic–climate interaction model (topographic alteration after Willett, Reference Willett1999; top right).
Using Panalesis, prospective advances are the following, and require the support of all.
7.a. Improving the plate tectonic model and the associated databases
The Panalesis plate tectonics model is a global geodynamic model (i.e. that takes into account the forces acting at the boundaries of plates) in perpetual development. Improvements come from an increasingly better coherence with the field data. The collection of data must therefore be massive and requires an intense effort for its treatment (see C. Hochard, unpub. Ph.D. thesis, Univ. Lausanne, 2008). Several ideas are in germination to optimize this work, one of which could be to open a platform where the holders of these data could themselves compare their data to the model. A remarkable initiative in this direction has been made by others in terms of palaeobiology in particular (see https://paleobiodb.org/#/), but this impressive work could be extended to other data (such as lithofacies in particular) and quantitatively used as feedbacks to assess the quality of palaeogeographies.
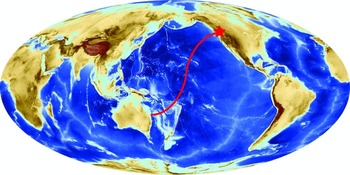
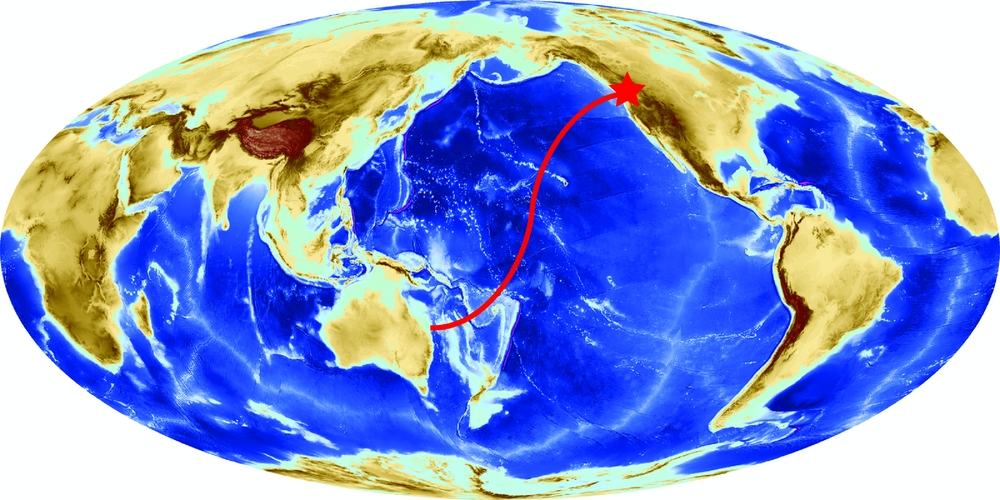
It is very difficult to correlate and analyse data from the past in the current configuration of the Earth. The data must be ‘sent back’ to their genuine configuration in the past to understand them correctly. A typical example is that if Late Palaeozoic data are obtained in the area of Vancouver, Panalesis suggests comparing them not to those in North America but to those in Australia (Fig. 6), because it was in this area that these lands were at that time.
Geological information must be ‘sent back’ in their genuine configuration to be correctly interpreted. For example, if data of Late Palaeozoic age are found in the region of Vancouver, Panalesis suggests comparing them with Australia, the region from where it originates.
7.b. Generating lithostratigraphic and palaeoenvironmental maps
The alternative approach put forward herein is complementary and not contradictory to the ‘classic approach’. It means that both must be made. In the style of Scotese, Boucot & McKerrow (Reference Scotese, Boucot and McKerrow1999), Dercourt, Ricou & Vrielynck (Reference Dercourt, Ricou and Vrielynck1993), Dercourt, Guetani & Vrielynck (Reference Dercourt, Guetani and Vrielynck2000), Golonka (Reference Golonka2007a,Reference Golonkab,Reference Golonkac, Reference Golonka2009) or others (see Vérard, in press), it would be useful to define lithostratigraphic and/or palaeoenvironmental maps based on the Panalesis model (as was done by Wilhem, Reference Wilhem2014 for the UNIL model; Fig. 5).
Indeed, Panalesis aims at producing synthetic data. Those will have to be compared with ‘true’ data and this will be much easier if the framework is common.
7.c. Integrating the four major aspects of palaeogeography throughout the Phanerozoic
The integration of the four major aspects of palaeogeography – i.e. plate tectonics, topography, climate and vegetation – is currently being extended for several time slices throughout the Phanerozoic.
The model integration (the concatenation of the four models) aims to determine the existence of critical thresholds, the validity ranges of simulated climates, and thus, in general, the robustness of the simulations. The idea is to take advantage of the various configurations and climate conditions that the Earth suffered throughout the Phanerozoic.
7.d. Being ready for ‘true’ coupling and for extension to other global models
Once the potential thresholds and sources of instability are known, once the ranges of validity and the robustness of the integrated model are determined, ‘true’ coupling can be carried out. It means that the plate tectonic model, the topographic model, the climate model and the vegetation model must (retro-)act on one another. For the time being, this is where we stand with the Panalesis model.
However, the aim is to extend modelling to the entire Phanerozoic. Extension has several advantages: (1) testing the model in various configurations; (2) understanding the first-order, long-term climate variability; (3) differentiating as much as possible between the signals in order to distinguish between cyclical events (low-frequency orbital parameters, galactic arm changes . . .), tectonics, or more extreme and punctuated events (trap volcanism, meteorites and even potential explosion effects of supernovae); (4) better assessing the role of the vegetation cover on the climate and vice versa. However, in parallel with the extension in time of climate modelling, it seems necessary to develop a model for palaeo-flora, so as to better constrain the impact of vegetation in the past, notably on water and CO2 cycles and also on sediment flow problems.
Henceforward, the general description of the palaeogeographic evolution stemming from the coupling of the four major aspects of palaeogeography will soon be tested against other major issues, with the aim to couple Panalesis to even more models.
One is the use of a global mantle circulation model, which can provide information on dynamic topography and lithospheric intra-plate stresses. The UNIL model has been used as boundary conditions to run global models at the University of Cardiff and University of Utrecht. The collaboration between teams was excellent and the results were promising (e.g. Hafkenscheid et al. Reference Hafkenscheid, Warners, van Oosterhout, Bergman, van der Burgt, Davies, Govers, Hochard, Kennan, Ross, Stampfli, Vérard, Webb and Wortel2013; Warners-Ruckstuhl, Govers & Wortel, Reference Warners-Ruckstuhl, Govers and Wortel2012, Reference Warners-Ruckstuhl, Govers and Wortel2013) with a remarkable validation of the UNIL model, notably by tomographic imaging (Hafkenscheid, Wortel & Spakman, Reference Hafkenscheid, Wortel and Spakman2006; P. Webb, unpub. Ph.D. thesis, Cardiff Univ., 2012). However, feedbacks to the plate tectonic model were missing. If, as Vérard et al. Reference Vérard, Hochard, Baumgartner and Stampfli(2015a) suggested, dynamic topography does not deeply impact the general definition of the coastline at a global scale, Panalesis shall assess its impact upon the drainage system in particular and the implications for the climate and vegetation systems. In addition to what was done at Cardiff and Utrecht in terms of dynamic topography at the beginning of the 2010s (e.g. P. Webb, unpub. Ph.D. thesis, Cardiff Univ., 2012), the style of work recently carried out by Müller et al. (Reference Müller, Hassan, Gurnis, Flament and Williams2017) on their model will be helpful in this regard (see also Flament, Reference Flament2014; Barnett-Moore et al. Reference Barnett-Moore, Hassan, Müller, Williams and Flament2017). However, all those works highlight the difficulty of replicating the location and timing of observed plumes, and up to now cannot be used to ‘correct’ for dynamic topography in the past.
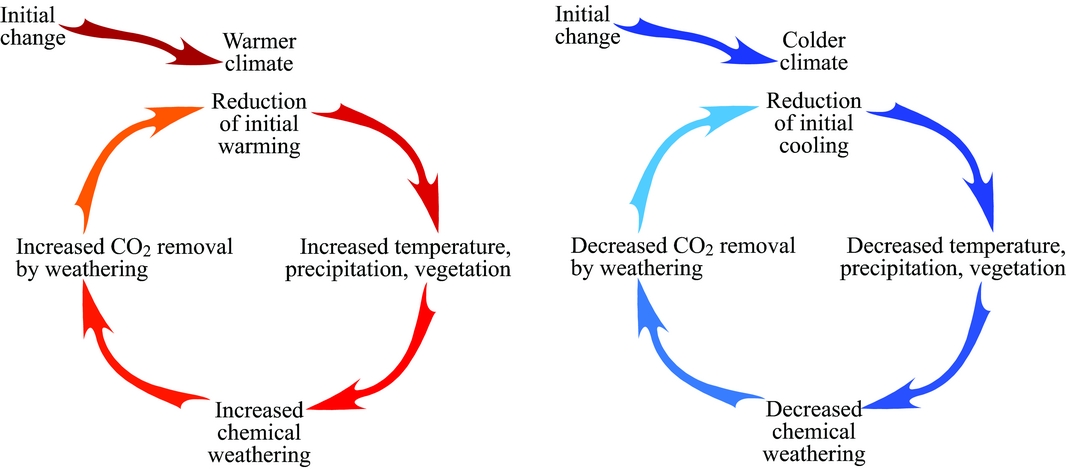
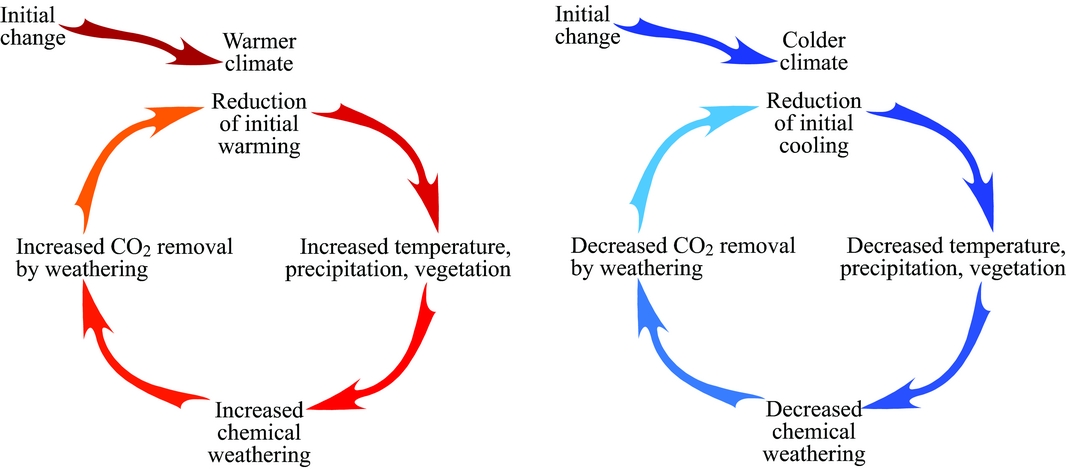
The other major challenge to meet is certainly the coupling of Panalesis to an erosion–sedimentation model. Erosion–sedimentation phenomena are at the heart of tectonic–climate interaction. In the 1990s, two papers raised a debate about the feedback between tectonics and climate. Molnar & England (Reference Molnar and England1990) suggested that uplift of mountain ranges was linked to the Cenozoic global climate cooling. Raymo & Ruddiman (Reference Raymo and Ruddiman1992), on the contrary, suggested that the rise of mountain belts (such as the Himalayan Plateau) modifies the climate. To understand this issue, research focused on the importance of weathering–erosion–sedimentation processes in the CO2 cycle. The chemical weathering of freshly exposed rocks (due to orogeny in particular) is now thought of as probably the predominant component for long-term CO2 removal in the atmosphere (e.g. Royer et al. Reference Royer, Berner, Montañez, Tabor and Beerling2004; see also Willett et al. Reference Willett, Hovius, Brandon and Fisher2006). Negative feedback between tectonics and climate appears to be a strong factor for climate stability (Fig. 7). If an initial increase (respectively, decrease) in CO2 content in the atmosphere occurs, the climate gets warmer (cooler), which leads to an increase (decrease) in temperature and precipitation, and in turn, leads to growth (decline) of vegetation. These factors favour (disadvantage) chemical weathering, which requires CO2 from the atmosphere to turn mineral species (e.g. feldspars) into others (e.g. clay minerals). The result is to decrease (increase) the CO2 content in the atmosphere, and therefore to reduce the effects of the initial change: it is a negative feedback. Hence, addressing tectonic–climate interactions corresponds to addressing the following questions: (1) are climate changes the results of long-term gradual evolution? As in the case of entering/exiting ice-ages for instance, are those gradual variations sufficient, or do we need more catastrophic events such as intense volcanic (plume-related?) activity or meteoritic impacts? What is the role of global tectonic activity versus the role of astronomical variations? Is it possible to relate the amount of subducted material to the CO2 cycle? What is the role of global vegetation in this cycle, and in the palaeodrainage system?
Negative feedback between tectonics and climate; modified after Ruddiman (Reference Ruddiman2001, op.cit. fig. 5-21).
The effects of erosion–sedimentation on the palaeo-topography are already taken into account in a global way in the mode of conversion into 3D of the plate tectonics model. However, important work remains to be done to adjust these effects to the results of climate models, and in particular to their spatial variability. On the other hand, everything remains to be done concerning taking into account tectonics in the CO2 cycle. The debate concerning whether the rise of the Himalayas modified the Cenozoic climate or the Cenozoic climate favoured the rise of the Himalayas was summarized by Molnar & England (Reference Molnar and England1990) with the formula ‘chicken or egg’. We are convinced – as in all other aspects mentioned here – that a response to such a debate cannot be considered by studying only one region of the world (the Himalayas) at a given era (the Cenozoic). The debate certainly requires indications from the entire globe over several Wilson cycles.
8. Concluding remarks
The ‘classic’ approach certainly remains the best tool to reconstruct palaeogeography at the local scale. Global reconstructions do not have the spatial resolution for this. The method, however, largely focuses on palaeoenvironments around the coastline. Little or no information is provided for the inland areas and for the deep ocean.
The ‘alternative’ approach presented herein takes the advantages of the wealth of plate tectonics and well-constrained global models to reconstruct a global palaeogeography covering 100% of the Earth's surface at any reconstructed time slice. It produces quantified synthetic solutions that can be compared with various types of data providing many viewpoints – and therefore many constraints – on specific palaeogeographic features. The coupling of numerous global models certainly reduces the number of potential solutions, and significantly helps to align theories/hypotheses with field data.
Advances in palaeogeography demand the development of such an ‘alternative’ approach in complement to the ‘classic’ approach employed for years. By addressing palaeogeography somewhat upside down, such an alternative approach can revive research in palaeogeography and, going further, open up the study of palaeogeographies (in plural), i.e. the evolution of palaeogeographies through time and their interactions with almost all fields of geosciences. The amount of associated work might look tremendous at first glance, but can be completed if objectives are addressed step by step.
Acknowledgements
Thank you to Guido Meinhold (Ed.) for his suggestions in the improvement of the manuscript and to three anonymous reviewers for their comments.