1. Introduction
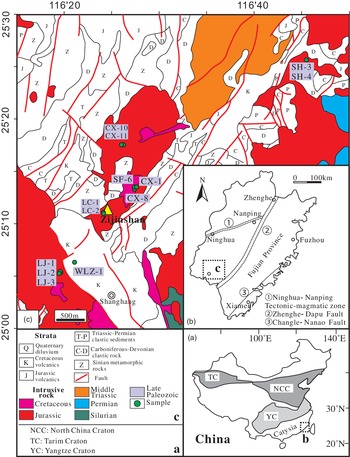
The Zijinshan area is located in southwestern Fujian Province, China (Fig. 1). As almost all the magmatic rocks in the Zijinshan area experienced intense alteration, attention has been focused on magmatic zircon studies. Previous studies on zircon U–Pb ages (Jiang et al. Reference Jiang, Liang, Bagas, Wang, Nie and Liu2013, Reference Jiang, Bagas and Liang2015; Liang et al. Reference Liang, Jiang, Wang, Li and Bai2013; Yu et al. Reference Yu, Pei, Qiu, Chen and Liu2013;; Xu et al. Reference Xu, Chen, Huang, Qi, Duan, Zhang, Wu, Zhang and Zhong2017) have shown that the Mesozoic magmatic rocks in this area mainly include intrusive rocks from the Middle Jurassic and intrusive-volcanic rocks from the Early Cretaceous. This large-scale Late Mesozoic magmatic activity is closely related to the formation of Cu, Au, Fe, Pb, Zn and Ag mineral deposits (Chen, Reference Chen1999; Zhang et al. Reference Zhang, Li, Feng and Dong2001; Mao et al. Reference Mao, Chen, Li, Ye and Zhao2006; Liang et al. Reference Liang, Jiang, Wang, Li and Bai2013; Jiang et al. Reference Jiang, Bagas and Liang2015; Li et al. Reference Li, Zhao, Zhang, Xu and Zhu2015; Duan et al. Reference Duan, Chen, Hollings, Duan, Chen, Hollings, Qi, Xu, Zhang, Xiao, Liu and Liu2017; Xu et al. Reference Xu, Chen, Huang, Qi, Duan, Zhang, Wu, Zhang and Zhong2017). The petrogenesis and magmatic evolution processes of the Zijinshan area Mesozoic magmatic rocks are still a topic of debate, with the contribution of mantle material being unclear. Wang et al. (Reference Wang, Li, Jian, Zhao, Xiong and Bao2005) and He et al. (Reference He, Xu and Niu2010) suggested that the Indosinian subcontinent mantle in the South China area was an enriched mantle (EM II); most zircon ϵ Hf(t) values are lower than depleted mantle values, which indicates an enriched source for many granitic rocks on the southeast coast (Li et al. Reference Li, Qiu and Yang2014). An increasing ϵ Hf(t) trend in the SE China Mesozoic magmas implies an increasing impact from a depleted asthenospheric mantle over time from the Late Jurassic to the Late Cretaceous. These rocks were derived from the mixing of different proportions of mantle-derived components with Palaeoproterozoic basement crust-derived magmas (He & Xu, Reference He and Xu2012; Liu et al. Reference Liu, Xu and Xia2014).
Geological sketch map of China (a), Fujian Province (b) and Zijinshan area (c).

The Zijinshan granitic complex (164–155 Ma) exhibits negative whole-rock ϵ Nd(t) values (−10.3 to −6.8) and ϵ Hf(t) values (−19.0 to −7.1), which, together with geochemical data, suggest that the Zijinshan granitic complex was most likely derived from the mixing of juvenile components and partial melting of the crust materials including Proterozoic orthometamorphic and parametamorphic rocks (Li et al. Reference Li, Zhao, Zhang, Xu and Zhu2015). Studies of Cretaceous magmatic rocks in the Zijinshan mineral field reveal arc-like geochemical signatures, with the heterogeneous Hf isotopic compositions (ϵ Hf(t) range of −9.4 to +0.1) of zircons suggesting an origin from mixing between crustal- and subduction-related mantle-derived melts due to lithospheric extension in response to subduction of the Pacific plate (Jiang et al. Reference Jiang, Liang, Bagas, Wang, Nie and Liu2013; Wang et al. Reference Wang, Fan, Zhang and Zhang2013; Li et al. Reference Li, Zhao, Zhang, Xu and Zhu2015; Chi et al. Reference Chi, Ni, Pan, Li, Wang, Yang, Xue and Liao2020). Muscovite 40Ar–39Ar and molybdenite Re–Os ages (113–105 Ma) for mineralization are coeval with the ages of the late Early Cretaceous rocks (Duan et al. Reference Duan, Chen, Hollings, Duan, Chen, Hollings, Qi, Xu, Zhang, Xiao, Liu and Liu2017; Huang et al. Reference Huang, Liang, Wu, Wu, Li and Bao2018; Zhao et al. Reference Zhao, Zhong, Mao, Bai and Xue2020). The zircons in late Early Cretaceous rocks have elevated Ce4+/Ce3+ values, indicating high oxygen fugacity. This suggests that the rocks formed from the mixing of subduction-related metasomatized mantle-derived high fO2 melts with crustal melts, whereas the Middle to Late Jurassic rocks were derived from the partial melting of crustal materials. This implies that the early Late Cretaceous rocks are characterized by higher oxygen fugacity with higher mineralization potential than the Middle to Late Jurassic rocks (Zhong et al. Reference Zhong, Chen, Pirajno, Chen, Li, Qi and Li2014; Duan et al. Reference Duan, Chen, Hollings, Duan, Chen, Hollings, Qi, Xu, Zhang, Xiao, Liu and Liu2017; Chi et al. Reference Chi, Ni, Pan, Li, Wang, Yang, Xue and Liao2020).
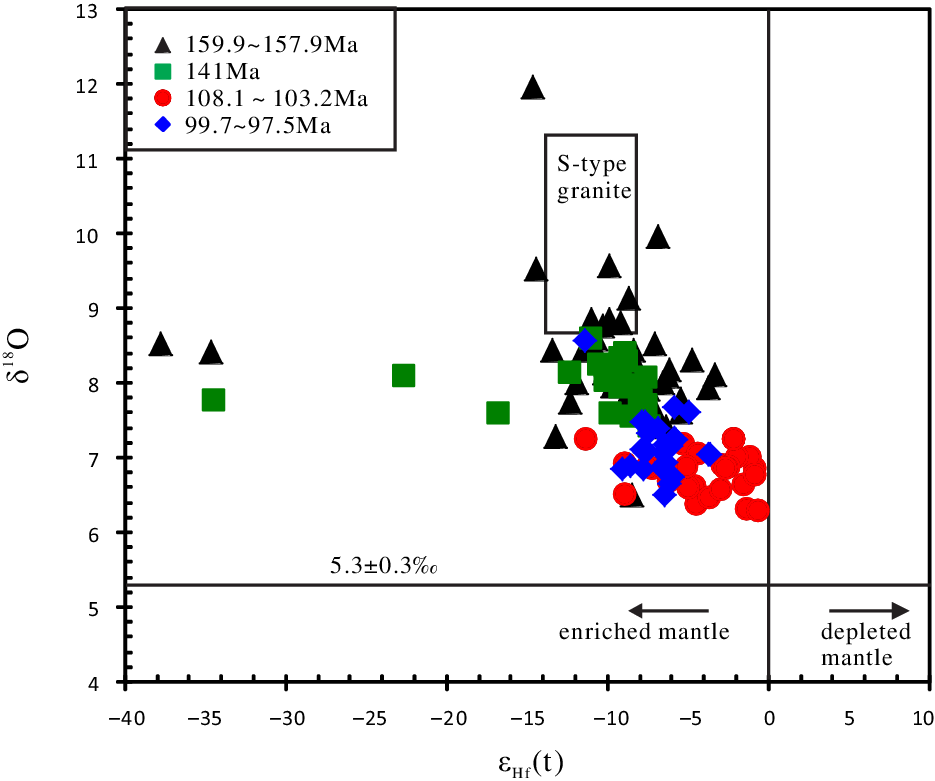
Magmatic zircon is an ideal mineral for age determination and petrogenesis studies of granitic rocks because of its high closure temperature for Pb and Hf, high U/Pb ratios and low Lu/Hf ratios. Owing to the development of in situ isotope analysis technology, isotope signatures of zircons with different ages and compositions can be used to reveal the genesis and evolutionary process of granitic rocks (Wu et al. Reference Wu, Li, Zheng and Gao2007). The presence of a large number of magmatic zircons in granites provides a clue to the magmatic history and the evolution of the magmatic source, and whether they experienced intense alteration. Concurrently, the O isotopes of magmatic zircon grains in equilibrium with mantle-derived magmas show a well-constrained and narrow range of δ18O values (c. 5.3 ± 0.3 ‰). This mantle zircon value is insensitive to magmatic differentiation, because the increase in bulk rock δ18O value is compensated for by an increase in zircon/liquid δ18O fractionation. Magmatic zircons derived from low- and high-temperature hydrothermally altered sources should have distinct O isotope compositions (Chen et al. Reference Chen, Deloule, Cheng, Xiao and Wu2003; Valley et al. Reference Valley, Lackey, Cavosie, Clechenko, Spicuzza, Basei, Bindeman, Ferreira, Sial, King, Peck, Sinha and Wei2005). Therefore, zircon O isotope analysis is effective in tracing the involvement of crustal and mantle materials in the magmatic source and in providing robust constraints on crust–mantle interactions and the contribution of mantle-derived materials to the formation of granites (Li et al. Reference Li, Li, Wang, Li, Liu and Tang2009 a). Preliminary studies on the zircon O isotope characteristics of the host magmatic rocks show the Early Palaeozoic, Late Triassic and Late Jurassic magmatic rocks were mainly sourced from the crust (Zhang et al. Reference Zhang, Wang, Li and Liu2017).
Because young (<200 Ma) juvenile crustal rocks will still have similar Hf isotopic composition to that of the depleted mantle, Hf isotope composition alone cannot effectively distinguish between mantle-derived and the young juvenile crustal-derived magmas involved in granite formation (Li et al. Reference Li, Li, Wang, Li, Liu and Tang2009a; Morag et al. Reference Morag, Avigad, Gerdes, Belousova and Harlavan2011). Therefore, a combined study of zircon Hf and O isotopes could play an important role in exploring the characteristics and relative importance of the potential mantle and crustal sources and magmatic evolution.
In this study, we present in situ data for zircon U, Pb, O and Hf isotope compositions, as well as whole-rock major and trace elements for the Mesozoic granitic rocks in the Zijinshan area. This data allowed discrimination between the new and reworked crust and helped us understand the magmatic evolution of the Zijinshan ore field.
2. Geological background and petrography
2.a. Geological background
The study area is located in the southwest depression zone of Fujian, and west of the NW-striking Zhenghe–Dapu deep fault zone, which extends for more than 1000 km (Fig. 1b). The NW-striking Yunxiao–Shanghang fault zone and NE-orienting Xuanhe zone anticlines intersect in the Zijinshan area. The Indosinian orogeny occurred in eastern China during the Early Triassic period. The tectonic framework changed from the predominant Tethys tectonic domain to the Circum-Pacific active continental margin, with intense tectonic deformation, magmatism and related mineralization, forming a series of granitoid belts (Mao et al. Reference Mao, Tao, Xie, Xu and Chen2001). The outcropped basement strata in the Zijinshan area are Late Neoproterozoic and Early Palaeozoic low-grade metamorphic rocks of flysch sediments. Late Jurassic and Early Cretaceous granitoids are widely distributed in this region (Fig. 1). Secondary ion mass spectrometry (SIMS) U–Pb ages of magmatic zircons from Mesozoic granitoids and mafic dikes show five separate episodes of magmatism (Zhang et al. Reference Zhang, Wang, Li and Liu2017): Early Proterozoic, Middle–Late Proterozoic, Silurian – Late Triassic, Late Jurassic and Early Cretaceous. Mesozoic Zijinshan magmatism occurred in two major phases: (1) Middle to Late Jurassic Zijinshan granitoids and (2) Early Cretaceous Shimaoshan volcanic rocks, Sifang granodiorite, porphyritic granodiorite and late aplite dykes (Xu et al. Reference Xu, Chen, Huang, Qi, Duan, Zhang, Wu, Zhang and Zhong2017).
2.b. Petrography
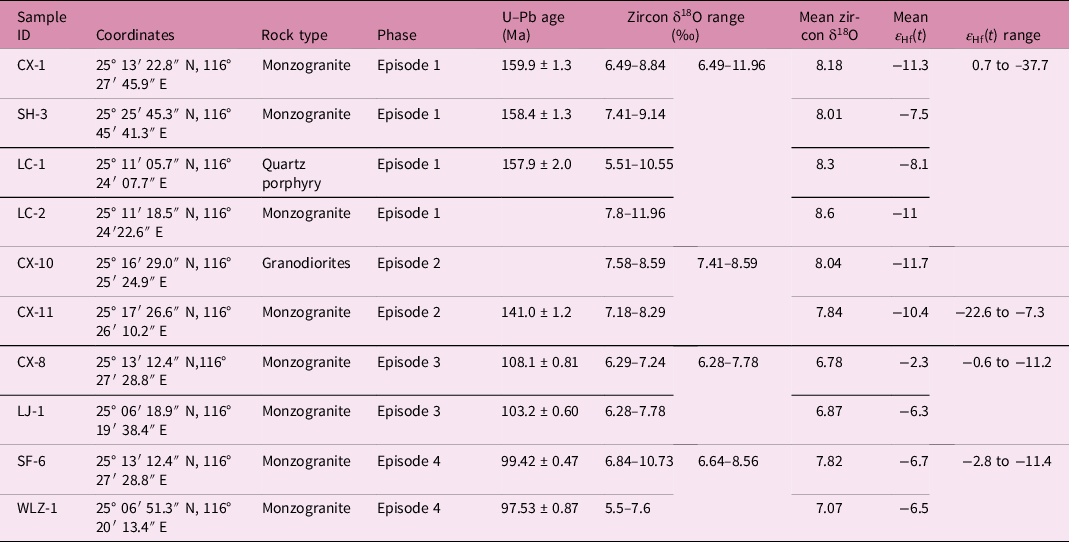
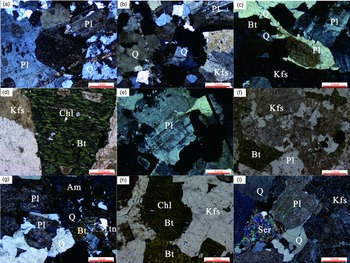
Thirteen granitic rocks were sampled from the Zijinshan plutons. These samples were mainly composed of monzogranite and granodiorite (Table 1). The monzogranite samples (CX-1, CX-8, LC-2, SH-3, SH-4, LJ-1, LJ-2, LJ-3, SF-6 and WLZ-1) were pink in colour, medium- to coarse-grained (Fig. 2a) and massive-structured. The monzogranite comprises quartz (25–35 %), plagioclase (25–30 %), alkaline feldspar (30–35 %), biotite (<5 %) and hornblende (1–3 %). The plagioclase occurred as euhedral to subhedral tabular crystals with polysynthetic albite twinning, exhibiting normal and oscillatory zoning. The grain size of the alkali feldspar was 2–5 mm, containing mainly orthoclase and perthite with evident Carlsbad twins (Fig. 2b) and perthitic texture (Fig. 2c), respectively. The quartz was inlaid in xenomorphic grains, and sericitization was common on the surface of the plagioclase (Fig. 2a–c) with polycrystalline twins and rhythmic bands (Fig. 2e). The biotite was often chloritized and the alkaline feldspar was often kaolinized.
Rock sample information

Thin-section photomicrographs of monzonitic granite (a–f) and granodiorite (g–i) in the Zijingshan area. (a) Plagioclase sericization; (b, c) granitic structure, plagioclase polycrystalline and potassium feldspar caspar twin and perthitic texture are developed; (d) chloritization often occurs in biotite; (e) plagioclase crystals show complex oscillatory zoning with resorption surfaces; (f) potassium feldspar clay mineralization development; (g) plagioclase in granodiorite sericitization; (h) biotite in granodiorite altered to chlorite; (i) most plagioclase is completely altered into sericite. Q – quartz; Pl – plagioclase; Per – perthite; Am – amphibole; Bt – biotite; Ttn – titanite; Ser – sericite.

The granodiorites (CX-10, CX-11) were light grey in colour, medium- to fine-grained (Fig. 2g) and composed of plagioclase (50%–55 %), K-feldspar (20%–25 %), quartz (20%–25 %), biotite (5%–10 %) and hornblende (1%–3 %), along with accessory magnetite, titanite, zircon and allanite. The plagioclase grains were usually polycrystalline twinned crystals of 2–3 mm; the potassium feldspar was light flesh red and occurred as euhedral to subhedral phenocrysts, with a size of 2–4 mm. Kaolinization of K-feldspar was commonly observed. Chloritization often occurred in the hornblende and biotite (Fig. 2h) while sericitization occurred in the plagioclase (Fig. 2i). One sample (LC-1) was mainly composed of quartz because of strong silicification. The protolith was a quartz porphyry, which developed into siliceous rock under the action of later fluid.
3. Analytical methods
3.a. Major and trace element analysis
Thirteen samples were collected for major and trace element study of whole rocks. These samples were crushed and ground to 200-mesh using an agate ring mill. The major and trace elements were analysed at the Institute of Regional Geology and Mineral Resources Survey in Hebei Province, China. Samples for major element analysis were fused into glass discs and analysed with X-ray fluorescence spectroscopy (XRF) using an AXIOS Minerals Spectrometer. Precision for the analytical results was typically 1–5 %. Rare-earth and other trace elements were analysed using inductively coupled plasma mass spectroscopy (ICP-MS) at the same institute. The whole-rock powders (50 mg) were dissolved in high-pressure Teflon bombs using an HF + HNO3 mixture for 48 h at ∼200 °C. The analytical uncertainties for most trace elements were generally better than 5 %, monitored by analyses of Chinese national standard samples GSR-1 and GSR-3.
3.b. Oxygen isotope analysis
Zircon in situ O isotopes were also analysed at the Institute of Geology and Geophysics using the Cameca IMS 1280 ion microprobe (CASIMS). The detailed analysis method can be found in Li et al. (Reference Li, Li, He, Li, Li, Gao and Wang2012). A single 133Cs+ ion beam with 2nA strength bombed the sample surface, and received both 16O and 18O simultaneously with two Faraday cups. The single-point measurement time was c. 5 min, the accuracy of the single group 18O/16O data is generally better than 0.2–0.3 ‰ (1σ), and the external precision of the sample was 0.5 ‰ (2SD). The reference material used for calibration of instrumental mass fractionation (IMF) was the Penglai zircon standard (Li et al. Reference Li, Long, Li, Liu, Zheng and Yang2010), which was mounted together with the samples. The measured 18O/16O ratio was corrected with the Vienna Standard Mean Ocean Water (V-SMOW) value (18O/16O = 0.0020052). In this study: (δ18O)M = [(18O/16O)M/0.0020052 − 1) × 1000(‰], IMF = (δ18O)M(standard) − (δ18O)V-SMOW, δ18Osample = (δ18O)M + IMF.
3.c. Zircon U–Pb dating
Eight samples were selected for zircon U–Pb, Hf and O isotope analysis. Zircons from c. 20 kg of the sample were first separated using magnetic and heavy liquid separation methods in order to concentrate them, and then hand-picked under a binocular microscope. Generally, more than 1000 grains of zircon were extracted from each sample. Zircon grains and zircon standard samples (Qinghu, Plésovice and 91500) were mounted in epoxy resin, polished to expose the interior of the grains and then coated with gold. The morphology and internal structure of the zircons were studied using the cathodoluminescence (CL) technique, using a JXA-8100 Electron Probe Microanalyzer for high-resolution imaging and energy-dispersive X-ray spectroscopy (EDS) at the State Key Laboratory of Continental Tectonics and Dynamics, Chinese Academy of Geological Sciences. The in situ O isotope ratios were analysed first and then the U–Pb data and Hf isotope analyses were repeated at the same sites previously analysed.
Zircon U–Pb dating was conducted using the CASIMS at the Institute of Geology and Geophysics, Chinese Academy of Sciences (IGGCAS), in Beijing. The detailed analytical method can be found in Li et al. (Reference Li, Liu, Li, Guo and Chamberlain2009b). Analyses were carried out with a beam diameter of 36 μm, 5 Hz repetition rate and energy of 10–20 J cm−2. A single O2− ion beam (20 µm × 30 µm in size and strength of 10 nA) bombarded the sample surface with an acceleration voltage of −13 kV. Oxygen flow was used to increase the sample chamber pressure to c. 5 × 10⁻⁶ T in order to improve the sensitivity to the Pb+ ion in zircon. Seven sets of data were analysed for each sample spot and the measuring time was c. 12 min. Internal zircon standards prototype Plésovice and Qinghu (Li et al. Reference Li, Tang, Guo, Yang, Hou and Hu2013) were measured alternately. The obtained standard deviation of 1.5 % (1σ) of the long-term monitoring standard sample (Li et al. Reference Li, Long, Li, Liu, Zheng and Yang2010) and the internal test accuracy of a single sample point together determine the single point error. The zircon 91500 standard (1065 Ma) was used as an external standard to correct Pb/U ratios and calculate Th and U content of zircon samples (Th = 29 μg g−1; U = 81 μg g−1) (Wiedenbeck et al. Reference Wiedenbeck, Allé, Corfu, Griffin, Mmier, Oberlif, Vonquadt, Roddick and Spiegel1995). The common Pb correction for the measured compositions was based on non-radiogenic 204Pb. The uncertainties given in the tables in the Supplementary Material available online at https://doi.org/10.1017/S0016756822000863 were 1σ for individual isotopic analyses.
3.d. Hf isotope analysis
Lu–Hf isotope analyses were conducted on the same zircon grains that were previously analysed for O isotope compositions and U–Pb geochronology. In situ zircon Lu–Hf isotope measurements were performed using a Neptune Plus MC-ICP-MS, coupled with a Resolution 193 nm laser ablation system at the Institute of Geology and Geophysics. This instrument is a double focusing multi-collector ICP-MS and can take high-mass-resolution measurements in multiple collector modes. A detailed description of analytical methods can be found in Wu et al. (Reference Wu, Yang, Xie, Yang and Xu2006). The laser ablation time was 26 s. The laser ablation pulse frequency was 10 Hz and the pulse power was 100 mJ, with a beam spot size of c. 60 µm. Isobaric interference of 176Lu and 176Yb to 176Hf was rectified by monitoring 175Lu and 172Yb signal strength, using the 175Lu/176Lu ratio (0.02655) and 176Yb/172Yb ratios (0.5886) (Chu et al. Reference Chu, Taylor, Chavagnac, Nesbitt, Boella and Milton2002). Zircon standard 91500 cross-referenced with zircon sample analysis was used for external monitoring of the instrument drift. In the process of analysis, the average 176Hf/177Hf ratio for the zircon standard Mud Tank was 0.282491 ± 27 (2σ), and for GJ it was 0.281971 ± 26 (2σ), which is consistent with the error range reported in the literature (Geng et al. Reference Geng, Li, Zhang, Zhou and Li2011; Li et al. Reference Li, Tang, Guo, Yang, Hou and Hu2013). The ϵ Hf value and two-stage depleted mantle model ages were calculated according to Wu et al. (Reference Wu, Li, Zheng and Gao2007) and references therein, using (176Lu/177Hf)CHUR = 0.0332; (176Hf/177Hf)CHUR,0 = 0.28277; (176Lu/177Hf)DM = 0.0384; (176Hf/177Hf)DM = 0.28325.
4. Results
4.a. Zircon SIMS U–Pb ages
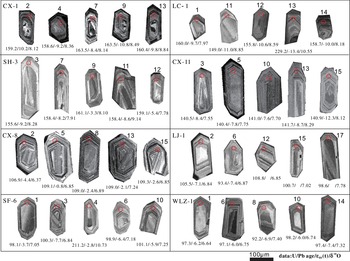
The zircons in this study were mostly colourless and transparent crystals, semi-automorphic to idiomorphic, with a length of 100–400 μm and a length-to-width ratio of 1:1 to 4:1. Cathodoluminescence images showed that the internal structure of the zircons exhibited clear oscillating zoning (Fig. 3). No influence of the alteration on these zircon grains was observed. The Th/U ratios of the zircons were generally >0.1 (Supplementary Table A.1 in the Supplementary Material available online at https://doi.org/10.1017/S0016756822000863), which is typical of magmatic zircons (Belousova et al. Reference Belousova, Griffin, O’Reilly and Fishe2002). The detailed dating results are listed in online Supplementary Table A.2. We use the 206Pb/238U age in the following discussion because it is more precise for younger zircons (Griffin et al. Reference Griffin, Graham, O’Reilly and Pearson2004).
Zircon cathodoluminescence images. Red circles represent the analysis location of Hf–O and U–Pb isotopes in the CL image. Small red numbers indicate U–Pb dating ages; white numbers indicate Lu–Hf isotope ϵ Hf(t) values; yellow numbers indicate zircon δ18O values.

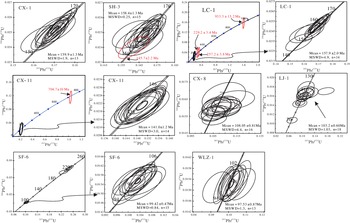
Samples CX-1, SH-3 and LC-1 displayed the oldest ages, in the range 157.9–159.9 Ma. Thirteen analyses from sample CX-1 yielded concordant 206Pb/238U ages ranging from 156.5 ± 2.4 to 163.5 ± 2.4 Ma, with a weighted mean age of 159.9 ± 1.3 Ma (MSWD = 1.9; Supplementary Table A.2; Fig. 4). Fifteen analyses from sample SH-3 yielded concordant 206Pb/238U ages ranging from 157.0 ± 2.4 to 161.2 ± 2.4 Ma, with a weighted mean age of 158.4 ± 1.3 Ma (MSWD = 0.25), excluding one younger age of 145.7 ± 2.2 Ma. Eleven analyses from sample LC-1 yielded concordant 206Pb/238U ages between 149.0 ± 2.2 and 162.8 ± 2.4 Ma, with a weighted mean age of 157.9 ± 2.0 Ma (MSWD = 4.9). Spots -9, 5 and 13 yielded much older 206Pb/238U ages of 933.3 ± 15.2 Ma, 257.2 ± 3.8 Ma and 229.2 ± 3.4 Ma, respectively, interpreted as the ages of xenocrystic zircons in the early intrusive or volcanic rocks.
U–Pb concordia plots illustrating the U–Pb ages of zircons from the Zijingshan area.

Thirteen analyses from sample CX-11 yielded concordant 206Pb/238U ages ranging from 138.7 ± 2.1 to 143.5 ± 2.1 Ma, with a weighted mean age of 141.0 ± 1.2 Ma (MSWD = 3.0; Fig. 4). One spot (9) from sample CX-11 yielded an age of 704.7 ± 10.0 Ma. Sixteen analyses from sample CX-8 yielded concordant 206Pb/238U ages ranging from 104.6 ± 0.9 to 112.6 ± 2.2 Ma, with a weighted mean age of 108.1 ± 0.81 Ma (MSWD = 4.4; Fig. 4). Fourteen analyses from Sample LJ-1 yielded concordant 206Pb/238U ages ranging from 113.9 ± 3.5 to 92.3 ± 2.2 Ma, with a weighted mean age of 103.2 ± 0.60 Ma (MSWD = 1.03). Spot 13 had a much lower 206Pb/238U age of 69.1 ± 1.7 Ma, likely due to the loss of lead.
Eleven analyses from sample SF-6 yielded concordant 206Pb/238U ages between 97.5 ± 1.5 and 101.1 ± 1.5 Ma, with a weighted mean age of 99.42 ± 0.47 Ma (MSWD = 0.84). Spots 2, 4, 12 and 13 had higher 206Pb/238U ages ranging from 220.4 ± 3.3 to 226.4 ± 3.4 Ma, which was interpreted as xenocrystic zircon. Thirteen analyses from sample WLZ-1 yielded concordant 206Pb/238U ages ranging from 92.2 ± 1.5 to 99.2 ± 1.5 Ma, with a weighted mean age of 97.53 ± 0.87 Ma (MSWD = 1.3). Overall, the average samples age can be divided into four episodes: 157.9–159.9 (samples CX-1, SH-3, LC-1), 141 (CX-11), 108.1–103.2 (CX-8, LJ-1) and 97.5–99.7 Ma (SF-6, WLZ-1), respectively.
4.b. Characteristics of major and trace elements
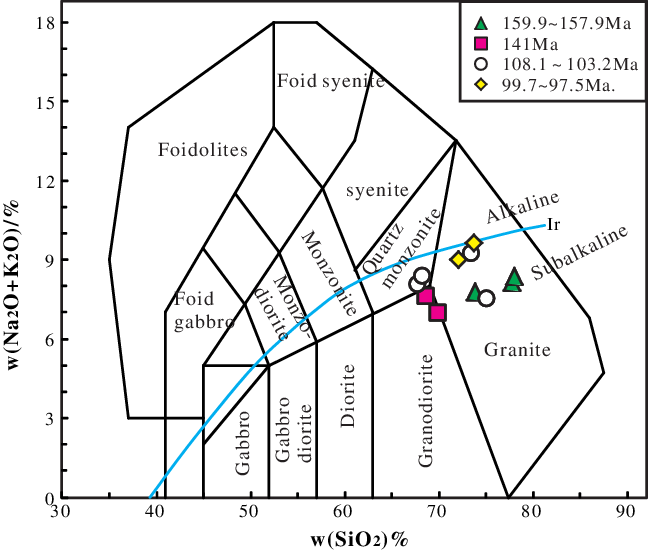
Thirteen samples were analysed for major and trace element compositions (Supplementary Table A.1, available online at https://doi.org/10.1017/S0016756822000863). The whole-rock SiO2 contents of the samples were mainly in the range 65.57–77.54 wt %. (Fig. 5). Zircon U–Pb age and microscopic features suggest that granitic rocks were intruded during the 157.9–159.9 Ma episode, which mainly consisted of granite; those intruded in the 141 Ma and the 108.1–103.2 Ma episodes consisted of granodiorite and quartz monzonite, and those in the 97.5–99.7 Ma episode consisted only of granite. Relatively higher SiO2 content is usually associated with lower contents of Fe2O3 T, MgO and CaO.
SiO2 vs Na2O + K2O(TAS) diagram. The Ir line marks the boundary between the alkaline rock series (top) and subalkaline rock series (bottom) (Middlemost, Reference Middlemost1994).

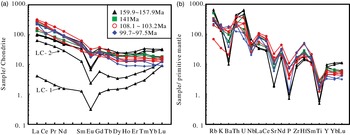
LC-1 and LC-2 are much more depleted of rare-earth elements (REE) and also show a trend of heavier REE (HREE) enrichment. Most of the samples show similar chondrite-normalized REE patterns (Fig. 6a): enrichment in light REE (LREE) with strongly fractionated LREE to HREE, slight fractionation of HREE, and samples of the oldest magmatic episode having a distinctly stronger Eu anomaly. In primitive-mantle-normalized spidergrams (Fig. 6b), all the samples were enriched in Rb, Th, U, La, Ce, Nd and Hf, and depleted in Ba, Nb, Sr, P and Ti. Petrological and geochemical data suggest that whole-rock trace element characteristics for most samples were not markedly altered by regional alteration.
Standardized rare earth element (a) and incompatible trace element (b; samples LC-1, LC-2 not plotted) diagrams. The values of chondrite and primitive mantle are from Sun & McDonough (Reference Sun and McDonough1989).

Sample LC-1 had an extremely high SiO2 content (98.97 wt %), and the protolith was quartz porphyry, which was altered into siliceous rock under the action of later fluid and had a lower REE content. As observed petrographically, the characteristics of the whole rock display intense silicification. Sample LC-2 with 73.90 wt % SiO2 content also exhibits relatively low ∑REE, which we interpret as resulting from strong alteration (Supplementary Table A.1, available online at https://doi.org/10.1017/S0016756822000863; Fig. 6). The whole-rock data of samples LC-1 and LC-2 do not represent primitive magmatic compositions.
4.c. O isotope composition of zircon grains
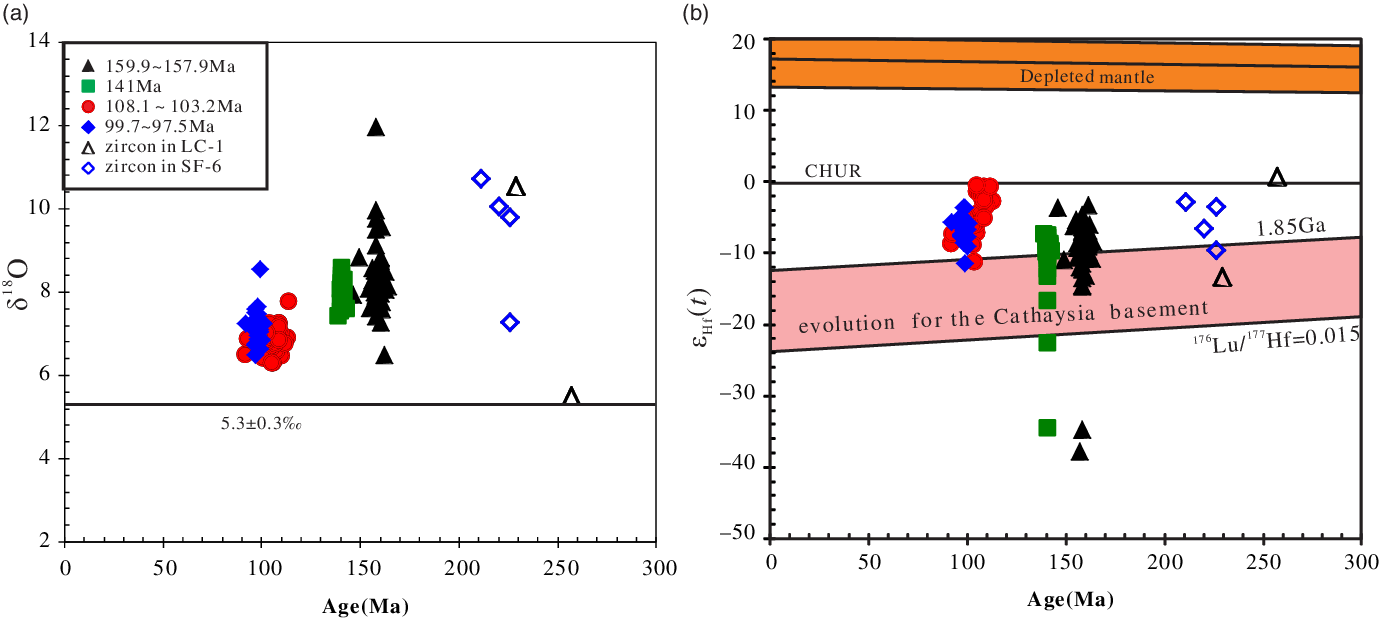
The zircon O isotope data are listed in Supplementary Table A.3 (available online at https://doi.org/10.1017/S0016756822000863). The weighted mean zircon δ18O values of all samples ranged from 6 ‰ to 10 ‰. The zircon oxygen isotope compositions from the episode 1 granitic rocks (157.9–159.9 Ma) have a large range (from 6.49 to 11.96 ‰), with a mean value of 8.25 ± 0.30 ‰ (Fig. 7a). Zircon oxygen isotope compositions from episode 2 rocks (141 Ma) have largely homogeneous δ18O (7.41–8.59 ‰). Episode 3 (108.1–103.2 Ma) and 4 (97.5–99.7 Ma) rocks have similar zircon oxygen isotope compositions, ranging from 6.28 to 7.78 ‰ and 6.64 to 8.56 ‰, respectively (Fig. 7a).
(a) Zircon δ18O vs age; mantle δ18O value is according to Valley et al. (Reference Valley, Kinny, Schulze and Spicuzza1998, Reference Valley, Lackey, Cavosie, Clechenko, Spicuzza, Basei, Bindeman, Ferreira, Sial, King, Peck, Sinha and Wei2005). (b) ϵ Hf(t) vs age diagram, the ranges for depleted mantle after Griffin et al. (Reference Griffin, Wang, Jackson, Pearson, O’Reilly, Xu and Zhou2002); Hf isotope evolution for Cathaysia crustal basement after Xu et al. (Reference Xu, O’Reilly, Griffin, Wang, Pearson and He2007).

Additionally, five inherited zircon grains from LC-1 and SF-6 aged in the range 211.2–229.2 Ma show higher values of oxygen isotope compositions (δ18O values from 7.26 to 10.73 ‰, with a mean value of 9.68 ‰; and one zircon grain (LC-1@5) aged at 257.2 ± 3.8 Ma shows the lowest δ18O value (δ18O = 5.51 ‰) which was probably formed by hydrothermal alteration (Wei et al., Reference Wei, Zhao and Spicuzza2008).
4.d. Hf isotope composition of zircon grains
The analytical results are listed in Supplementary Table A.3 (available online at https://doi.org/10.1017/S0016756822000863) and shown in Figure 7b. The ϵ Hf(t) values were calculated based on the U–Pb ages. Fifty-six spots for in situ Hf isotope analysis were determined on zircon grains from samples of episode 1 (157.9–159.9 Ma) and selected for in situ Hf isotope analysis, which yielded ϵ Hf(t) values from 0.7 to −37.7 with an average value of −9.5, excluding two zircons which showed ϵ Hf(t) values of −37.7 and −34.7, respectively. Twenty-eight analyses were performed for samples CX-10 and CX-11 in episode 2 (141.0 Ma), with ϵ Hf(t) values varying from −22.6 to −7.3. Zircon grain CX-10@7 showed a more negative ϵ Hf(t) value (−37.4). Twenty-eight analyses for episode 3 (108.1–103.2 Ma) yielded ϵ Hf(t) values from −0.6 to −11.2, with an average value of −4.0. Thirty analyses for episode 4 (97.5–99.7 Ma) yielded ϵ Hf(t) values from −2.8 to −11.4, with an average value of −6.6. Four spots from SF-6 with ages of 211–226 Ma yielded ϵ Hf(t) values from −2.8 to −9.5.
5. Discussion
In the Zijinshan area, magmatic zircon U–Pb ages showed that Mesozoic magmatism mainly occurred in the Jurassic and Cretaceous. Our SIMS U–Pb chronology data for the igneous rocks in this study can be divided into four episodes: episode 1: 157.9–159.9 Ma in the Late Jurassic (including CX-1, SH-3 and LC-1); episode 2: 141 Ma in the earliest Early Cretaceous (including CX-11); episode 3: 108.1–103.2 in the late Early Cretaceous (including CX-8 and LJ-1); and episode 4: 97.5–99.7 Ma in the earliest Late Cretaceous (including SF-6 and WLZ-1). The chronology data were consistent with the reported main age episodes in this area (e.g. Yu et al. Reference Yu, Pei, Qiu, Chen and Liu2013; Jiang et al. Reference Jiang, Bagas and Liang2015; Li et al. Reference Li, Qiu, Zhang, Liu and Yu2016; Duan et al. Reference Duan, Chen, Hollings, Duan, Chen, Hollings, Qi, Xu, Zhang, Xiao, Liu and Liu2017).
5.a. Influence of crust contamination and alteration
Sample LC-1 (granodiorites) of the first magmatic episode includes two Triassic zircons with ages of 229.2 Ma and 257.2 Ma. Sample SF-6 (monzonitic granite) of the fourth episode included four xenocrysts with ages ranging from 220.4 Ma to 226.4 Ma. This suggests that during the upwelling process the primitive magma suffered assimilation and contamination by Indosinian granitoids. Triassic-age magmatic rocks are also well developed around the Zijinshan area (Chen et al. Reference Chen, Hsieh, Lee and Zhou2011; Wang et al. Reference Wang, Fan, Zhang and Zhang2013). Granitoid samples showed similar chondrite-normalized REE (Fig. 6a) and primitive-mantle-normalized incompatible patterns (Fig. 6b). The similarity of granites of different ages may represent similar source characteristics, except for LC-1 and LC-2 whose extremely high SiO2 content indicates intense later alteration. Therefore, these two samples are ruled out in the following geochemical discussion. The freshest samples were selected in the field to ensure the least alteration, which is consistent with the results of the major element analysis that yielded loss-on-ignition values generally lower than 2 wt %. Zircon populations do not show obvious later alteration in light of both CL images and spot U–Pb analyses of zircon grains from Zijinshan granitoids. In summary, the granitoid samples were not makedly influenced by regional alteration and properly represent magmatic source characteristics.
5.b. Crust–mantle interactions for the late Jurassic and early Cretaceous granitoids
Although experimental petrology has shown that partial melting of ultramafic rocks in the mantle is unlikely to directly produce granitic magma (Johannes & Holtz, Reference Johannes and Holtz1996), it is also widely accepted that mantle-derived magma can provide enough heat to melt the overlying crust formation and concurrently contribute to the crust-derived granitic melt in different proportions (Altherr et al. Reference Altherr, Holl, Hegner, Langer and Kreuzer2000). The change in the composition of the granitic melts predominantly depends on the ingredients of the lower crustal melt but is sometimes influenced by mantle-derived basaltic magma. Their chemical and isotopic compositions can be used to trace the nature of the magma sources in the lower crust (Wong et al. Reference Wong, Min, Xing, Li, Zhao, Wong and Wu2011).
Obvious negative Eu anomalies in chondrite-normalized REE (Fig. 6a) suggest that the fractional crystallization of plagioclase occurred in the source region. Zijinshan granitoids are enriched in LREEs and large-ion lithophile elements (LILEs; e.g. Rb, K, Th, U and Sr) and depleted in high-field-strength elements (HFSEs; e.g. Nb, Ta and Ti; Fig. 6b), implying a possible genetic relationship with arc-related magmatism. They are most likely derived from partial melting of the middle and lower crust and mixed mantle material which has been modified by subduction components. The increasing La/Yb value and decreasing content in HREE from episodes 1 to 4 (Fig. 6a) may reflect the deepening of the magmatic source or the involvement of more mantle-derived material with time.
Zircon has very low Lu/Hf ratios (commonly <0.002), resulting in non-radiogenic 176Hf/177Hf ratios. Therefore, the current zircon 176Hf/177Hf ratios can represent the initial ones that were inherited from the magma at the time of zircon crystallization (Wu et al. Reference Wu, Li, Zheng and Gao2007).
Although it is speculated that the enriched Hf isotopic features of the granitoids may show crustal material affinities, the two-stage Hf model ages for most samples (TDM2 = 1.2–1.7 Ga) were markedly younger than those of the basement metamorphic rocks of the Cathaysia Block (>1.85 Ga; Xu et al. Reference Xu, O’Reilly, Griffin, Wang, Pearson and He2007). Most of the studied zircon ϵ Hf(t) data for Zijinshan granitoids fell within the area between the depleted mantle and the Hf isotope evolution for the Cathaysia basement (Fig. 7b). It is thus inferred that the crust is not the single source of the magmas and some juvenile components from a depleted mantle source were also involved in generation of the studied granites; the granitoids in the Zijinshan region come from a mixture of mantle-derived components and crustal melts. Zircon U–Pb age determination indicates that the Late Yanshanian igneous rocks in SE China formed at four episodes of 141–130, 130–127, 123–118 Ma, and 110–86 Ma. These rocks show an oceanward-younging trend. In situ zircon Hf isotope analyses of igneous rocks show an increasing ϵ Hf(t) trend, the entire sequences display typical isotopic features of magma mixing and there was a significant contribution of depleted asthenospheric mantle to the late-stage magmatism (He & Xu, Reference He and Xu2012; Liu et al. Reference Liu, Xu and Xia2014). Zircon Hf(t) values from episodes 1 (157.9–159.9 Ma) and 2 (141 Ma) granitoids were generally lower than those of zircons from episodes 3 (108.1–103.2 Ma) and 4 (97.5–99.7 Ma). Most of them were plotted in the region of Hf isotope evolution of the Cathaysia basement, indicating a higher proportion of reworked older crust. In contrast, the higher ϵ Hf(t) values in episode 3 and 4 zircons imply that more mantle-derived magma contributed to the granitic magma. This suggests an increasing impact from a depleted asthenospheric mantle over time from the Late Jurassic to the Late Cretaceous.
Systematic in situ Hf and O isotope analyses of zircons indicate that mantle-derived materials play an important role in the generation of Zijinshan granites, which have variable Hf isotopic compositions that are different from the signature of magmas derived from a single source, indicating the involvement of mantle-derived magma. The Hf isotopic compositions of zircons from Zijinshan granitoids in episodes1 and 2 were generally highly variable, with the ϵ Hf(t) values of most rocks ranging from 0.7 to −37.7 and TDM2 ages from 1.2 to 2.0 Ga. Large variations in zircon ϵ Hf(t) values could be interpreted as indicating binary mixing between mantle-derived magma and evolved crustal components. The lower ϵ Hf(t) values of zircon represent the isotopic signatures of felsic end-member melts that have undergone little or no mixing with mantle-derived components, whereas the higher ϵ Hf(t) values of zircon indicate higher degrees of mixing (Li et al. Reference Li, Qiu and Yang2014). The zircons in episode 3 (108.1−103.2 Ma) yield Hf TDM2 mainly in the range 1.2 to 1.7 Ga. This finding is consistent with the results of Jiang et al. (Reference Jiang, Liang, Bagas, Wang, Nie and Liu2013, Reference Jiang, Bagas and Liang2015) and Liang et al. (Reference Liang, Jiang, Wang, Li and Bai2013), whose data collectively showed Hf TDM2 model ages of 1.0–1.6 Ga for zircons of Cretaceous granitoids in this area. However, Hf TDM2 ages in episode 4 are relatively older than those in episode 3, ranging from 1.4 to 1.8 Ga.
Oxygen isotopes have been extensively employed to trace magma sources and constrain the history of mantle-derived magma mixing with crustal materials. The mantle is a remarkably homogeneous oxygen isotope reservoir (Eiler, Reference Eiler, Valley and Cole2001), and igneous zircons in equilibrium with pristine mantle-derived melts have a narrow δ18O (5.3 ± 0.3 ‰) (Valley, Reference Valley, Hanchar and Hoskin2003; Cavosie et al. Reference Cavosie, Kita and Valley2009). In contrast, magmas generated directly from or assimilated by crustal sources generally show higher δ18O values (Eiler, Reference Eiler, Valley and Cole2001; Bindeman et al. Reference Bindeman, Eiler, Yogodzinski, Tatsumi, Stern and Grove2005; Li et al. Reference Li, Li, Wang, Li, Liu and Tang2009 a; Bindeman & Serebryakov, Reference Bindeman and Serebryakov2011; Spencer et al. Reference Spencer, Cavosie, Raub, Rollinson and Evans2017). Zircon O isotopic ratios noticeably higher than those of mantle zircon indicate that mantle-derived magma was considerably contaminated by crustal components during evolution, possibly due to the interaction of magma with Metasedimentary rocks that had experienced low-temperature or surface processes (with δ18O > 10 ‰; Valley et al. Reference Valley, Lackey, Cavosie, Clechenko, Spicuzza, Basei, Bindeman, Ferreira, Sial, King, Peck, Sinha and Wei2005). The rough correlation of zircon Hf and O isotopic ratios also suggests a degree of mixing of mantle- and crust-derived magmas in forming the granites.
The Zijinshan granitoids have lower zircon δ18OZrn values (6.3–12 ‰; Fig. 7a) than those of typical crustal magmas (10–30 ‰; Valley et al. Reference Valley, Lackey, Cavosie, Clechenko, Spicuzza, Basei, Bindeman, Ferreira, Sial, King, Peck, Sinha and Wei2005), indicating the addition of mantle-derived materials or a pre-existing source region that was not influenced by surface processes (Cecil et al. Reference Cecil, Gehrels, Rusmore, Woodsworth, Stowell, Yokelson, Homan, Kitajima and Valley2021). The zircon oxygen isotope values (δ18OZrn) of episodes 1 and 2 were mainly in the range 6.5–12.0 ‰, averaging 8.3 ‰ and 8.0 ‰, respectively. The δ18OZrn values of episodes 3 and 4 were mainly in the range 6.3–8.6 ‰, averaging 6.8 ‰ and 7.2 ‰, respectively. As δ18OZrn is insensitive to magmatic fractional crystallization (Valley, Reference Valley, Hanchar and Hoskin2003), the higher-than-mantle δ18OZrn values indicate a substantial crustal contribution. Magmatic rocks from episodes 3 and 4 with lower δ18OZrn values reflect relatively lower crustal contributions compared to those found for episodes 1 and 2. In Fig. 7a, a significant decreasing trend of δ18OZrn with age can be observed from the Late Jurassic to the Late Cretaceous, suggesting that periodically increasing mantle-derived magma contributed to crustal melts.
In the ϵ Hf(t) vs δ18O diagram (Fig. 8), the data exhibit an overall negative correlation. Zircon samples from all magmatic episodes show a gradual increase in ϵ Hf(t) and a decrease in δ18O, consistent with the view of the progressive involvement of mantle-derived components. A lower-crustal source was likely the main magma origin area during the Late Jurassic, and the magmas from episodes 3 and 4 were likely more affected by a mantle-derived source. The higher δ18O values of zircons in episodes 1 and 2, which are plotted in or near the S-type granite area, imply a sedimentary crustal source. The heterogeneous mixing of granitic magma remelted from sedimentary rocks with mantle-derived magma is probably the dominant formation process of these granites (Li et al. Reference Li, Liu, Li, Guo and Chamberlain2009 b). The lower δ18O values of zircons in episodes 3 and 4 indicate a significant mantle contribution to these magmas. This is consistent with new He and Ar isotope determinations from ore fluids from the Zijinshan Cu–Au and nearby Wuziqilong Cu deposits (dated 105 to 91 Ma), which show that volatility, heat and metals (at least part of them, if not all) may come directly from mantle-derived underplating of mafic magma (Wu et al. Reference Wu, Hu, Li, Stuart, Jiang, Qi and Zhu2017). The relatively narrow range and low values of ϵ Hf(t) and δ18O in episode 3 and 4 granitic rocks of the Zijinshan region imply a greater continuous mantle influence (Figs. 7 and 9).
δ18O vs ϵHf(t) diagram. Zircon Hf–O isotope value for the S-type granite calculated from data for the Indosinian cordierite granite from Darongshan, Guangxi (Li et al. Reference Li, Li, Wang, Li, Liu and Tang2009 a).

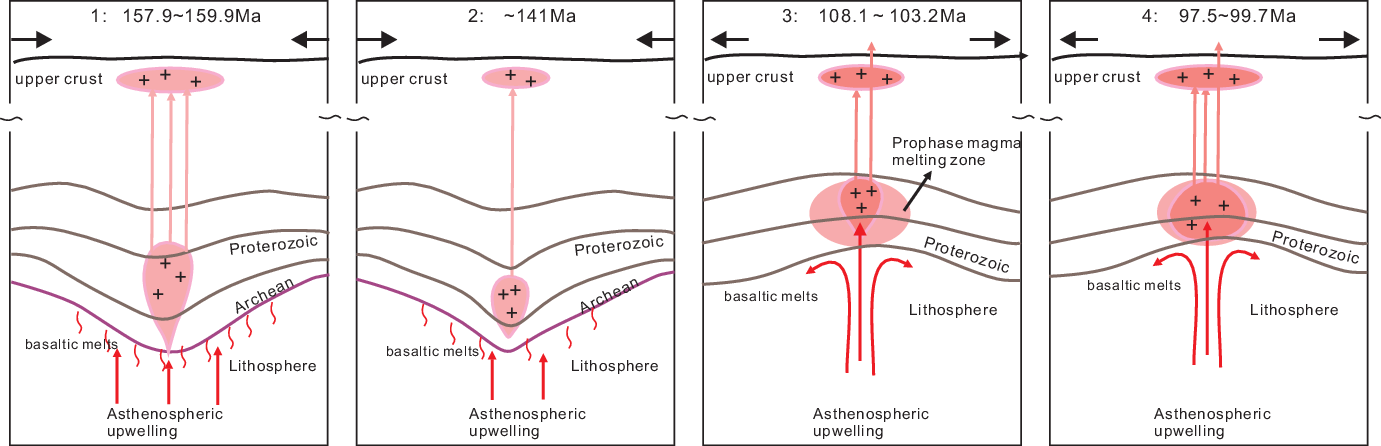
Tectonic and magmatic evolution model for the Zijinshan granitic rocks.

5.c. Geodynamic setting
The Zijinshan area is located to the east of the Nanling orogenic belt, which, in the late Mesozoic, was the transitional region from the collision and compression of the Indian and Eurasian plates to the subduction and expansion of the Palaeo-Pacific Ocean to the east of China (Zhang et al. Reference Zhang, Li, Feng and Dong2001). The tectonic setting of SE China changed from a compressional subduction regime to an extensional regime during the Cretaceous at c. 110 Ma (He & Xu, Reference He and Xu2012). Detailed studies of the Zijnshan igneous rocks suggest that Late Jurassic intrusions were emplaced in a compressional tectonic setting and Early Cretaceous granodiorite and volcanic rocks formed under an extension regime resulting from upwelling of the asthenosphere or a subduction-related tectonic setting (Zhang et al. Reference Zhang, Li, Feng and Dong2001; Jiang et al. Reference Jiang, Liang, Bagas, Wang, Nie and Liu2013). The transition from a compressional to an extensional tectonic environment in the SW Fujian region led to large-scale lithospheric thinning and magmatic activity in the region (Zhou et al. Reference Zhou, Sun, Shen and Shu2006; Qiu et al. Reference Qiu, Xiao, Hu, Xu, Jiang and Li2008; Li et al. Reference Li, Qiu and Yang2014; Wang et al. Reference Wang, Zhang, Wu, Vatuva, Di and Yan2017).
In combination with whole-rock trace element data and zircon ϵ Hf(t) and δ18O features, we established a comprehensive model for the tectonic and magmatic evolution of Zijinshan granitic rocks. The Mesozoic (165–150 Ma) rock series and tectonic environment in SW Fujian indicate a Jurassic intracontinental overthrust environment with crust thickening (Mao et al. Reference Mao, Tao, Xie, Xu and Chen2001). The heat generated by the strong thickening and shortening processes of the continental interior and possible additional heat input from mantle underplating caused crustal materials to begin to partially melt, and this resulted in the Late Jurassic granitic intrusions (Fig. 9). The transformation from regional compression to extension may have occurred at c. 135 Ma (Zhang et al. Reference Zhang, Li, Feng and Dong2001; Mao et al. Reference Mao, Li, Zhang, Wang and Hu2003). Under an extensional tectonic regime, crustal denudation and thinning contributed to the ascent and emplacement of magma (Mao et al. Reference Mao, Tao, Xie, Xu and Chen2001). From the Late Jurassic to the Late Early Cretaceous period, the increasing ϵ Hf(t) values, as well as the decreasing δ18O values and TDM2 ages, suggest that the crust–mantle interaction gradually increased, corresponding to an enhanced extensional tectonic environment.
Subduction of the palaeo-Pacific plate has been widely accepted for interpreting Mesozoic tectono-magmatic activities in SE China. The extension of the lithospheric mantle coupled with upwelling of the asthenosphere resulted in large-scale, arc-affinity Cretaceous magmatism during the late Mesozoic period. Magmatism in the Zijinshan area could be grouped into early magmatic episodes (160–141 Ma) in a compressional environment and a late magmatic episode (108–97 Ma) in an extensional environment, which were related to the forward and rollback subduction of the palaeo-Pacific plate, respectively. The granites in episodes 3 and 4 were emplaced at 108–97 Ma, corresponding to a period of rapid high-angle subduction of the palaeo-Pacific plate beneath SE China. In episodes 3 and 4, regional extension (∼110 Ma) induced underplating of mantle-derived magmas and triggered the partial melting of the ancient basement rocks, producing felsic magmas. These crustal melts were then mixed with a small amount of mantle component to the granitic magma. During the same period, mantle-derived magma intruded between the lower crust and the lithospheric mantle, as manifested by the Mesozoic basic granulites in South China (Yu et al. Reference Yu, Xu and Zhou2002). Crust extension, thinning and mantle upwelling continued until 90 Ma (Mao et al. Reference Mao, Chen, Li, Ye and Zhao2006). Crust–mantle interactions altered the composition of the original magma from the Late Jurassic to Early Cretaceous, which may explain the limited range in ϵ Hf(t) and δ18O values of episode 3 and 4 granitic rocks. The Zijinshan granitoids are the result of subduction-related magmatism due to a Cretaceous slab break-off and rollback of the subducting palaeo-Pacific plate (Mao et al. Reference Mao, Chen, Li, Ye and Zhao2006; Yu et al. Reference Yu, Pei, Qiu, Chen and Liu2013; Li et al. Reference Li, Qiu and Yang2014). During this geodynamic process, strong and rapid upwelling of the asthenospheric mantle occurred, causing regional extension of the overlying continental lithosphere and providing depleted mantle components for large-scale Late Jurassic to Late Cretaceous magmatism in the Zijinshan area.
6. Conclusions
-
(1) Our zircon SIMS U–Pb chronology data for the Zijinshan granitic rocks showed that the Zijinshan intrusive magmatism is divided into four episodes: episode 1: 157.9–159.9 Ma in the Late Jurassic; episode 2: 141 Ma in the earliest Early Cretaceous; episode 3: 108.1–103.2 Ma in the late Early Cretaceous; and episode 4: 97.5–99.7 Ma in the earliest Late Cretaceous.
-
(2) Crust–mantle interactions dictated the composition of the original magma. The increasing ϵ Hf(t) values (−37.7 to −2.8), decreasing δ18O values (12.0 to 6.3 ‰), increasing La/Yb values and decreasing trend in HREE from episodes 1 to 4 may indicate the increasing influence of mantle-derived material from the Late Jurassic to Late Cretaceous. The magma that intruded between 160 and 141 Ma (episodes 1 and 2) may have been derived mainly from melts of the lower crust. In contrast, the magma that intruded between 108 and 97 Ma (episodes 3 and 4) included more mantle-derived material.
-
(3) The tectonic and magmatic evolution of the Zijinshan granitic rocks in the late Mesozoic might have been caused by a structural change from the collision and compression of the Indian and Eurasian plates to the subduction and expansion of the Palaeo-Pacific Ocean to eastern China.
Supplementary material
To view supplementary material for this article, please visit https://doi.org/10.1017/S0016756822000863
Acknowledgements
This work was financially supported by the National Natural Science Foundation of China (No. 41873012, 41903007). The authors would like to thank the reviewers for helping in enhancing the paper.