1. Introduction
Whether natural resources are an asset or the opposite for development is the subject of a large and growing literature. This paper proposes an endogenous growth model in which the significance of resource revenue spending policies can be studied. Especially, we focus on how spending policies impact savings through their influence on the composition of life-cycle income flows, and we explore the hypothesis that the strength of parental altruism matters for this relationship. We also examine the relationship between growth and welfare effects, a relationship that turns out to have potential dichotomous characteristics.
The idea of a ‘resource curse’Footnote 1 is not new. The decline of Spain's prosperity after its colonization of the New World and discovery of large amounts of gold and other precious metals is a classical example. In recent times, the resource curse idea has received support by a large body of empirical (see Auty, Reference Auty1993, Reference Auty2001; Sachs and Warner, Reference Sachs and Warner1995, Reference Sachs and Warner1999, Reference Sachs and Warner2001, among others) as well as theoreticalFootnote 2 literature. Classical theories include the Dutch disease theory (Corden and Neary, Reference Corden and Neary1982; van Wijnbergen, Reference van Wijnbergen1984; Torvik, Reference Torvik2001), rent-seeking problems (Tornell and Lane, Reference Tornell and Lane1999; Torvik, Reference Torvik2002), and political economy explanations (Ross, Reference Ross2004, Reference Ross2006; Robinson and Torvik, Reference Robinson and Torvik2005). Rodriguez and Sachs (Reference Rodriguez and Sachs1999) suggest that natural resource rich countries are overshooting their consumption levels and consequently converge to their steady states from above, which results in slow rates of economic growth.
At the same time, also empirical evidence, which questions an unconditional negative relationship between natural resources and growth, seems to be emerging (Sala-i-Martin et al., Reference Sala-i-Martin, Doppelhofer and Miller2004; Stijns, Reference Stijns2005; Ng, Reference Ng2006; Brunnschweiler and Bulte, Reference Brunnschweiler and Bulte2007; Frederiksen, Reference Frederiksen2007). An often used counterexample to the resource curse is oil-rich Norway. Larsen (Reference Larsen2005) concludes that resources are a blessing for Norway's economy.Footnote 3
Yet only a limited number of papers (e.g., Mehlum et al., Reference Mehlum, Moene and Torvik2006) offer a theory for a diverging resource impact on economic performance. Moreover, while the literature in general has intense focus on analyzing natural resources in positive settings, another important aspect, namely how best to manage the resource revenues, despite potential harmful growth effects, is largely ignored.Footnote 4
We use a two-period overlapping generations growth model in which individuals are altruistic in that parents care about the welfare of their children. Parents have the possibility to leave bequests, which they will do when their altruism is sufficiently high. In this case, the economy is dynastic and behaves like an infinitely lived representative agent model, whereas the economy behaves like an overlapping generations model when altruism is not intense enough and bequests are absent (Barro, Reference Barro1974; Weil, Reference Weil1987). We show that whether an economy is in one or the other growth regime depends partly on the strength of altruism, partly on the natural resource richness, and partly on how the natural resource revenues are used.
The political economy literature frequently argues that abundant natural resources lead to poor spending policies. The idea is that ‘easy’ revenues corrupt, bring about conflicts (Ross, Reference Ross2004, Reference Ross2006), and encourage economically inefficient – but politically important – projects (Robinson and Torvik, Reference Robinson and Torvik2005). To mitigate such problems, Sala-i-Martin and Subramanian (Reference Sala-i-Martin and Subramanian2003) argue, at least for the case of Nigeria, that revenues should be distributed directly to the people.
In our model, resource revenues, which enter the economy in every period, are distributed according to a spending policy as direct transfers to members of society and as expenditures for a public productive service as in Barro (Reference Barro1990). We show that economic responses to changes in revenue flows vary across growth regimes – even under identical spending policies. When parents' strength of altruism is low enough and bequests therefore are absent, a resource curse situation (growth decline) may prevail under spending policies, which give too high a share of resource revenues to the old generation. In this case, increased revenue flows decrease the incentive for the young to save. Welfare of the current generations, however, may still improve despite the growth decline. In contrast, when altruism is high enough, so that parents leave positive bequests to their children, a resource curse situation cannot occur. The reason is that savings in the dynastic growth regime are unaffected by changes in revenue flows as such changes are met by identical opposite changes in bequests. Lastly, we find that the resource curse is absent under social planner policies. These policies ensure that the intergenerational transfer link is maintained operative, i.e. bequests are positive or in the limit just equal to zero.
Our model is related to that of Papyrakis and Gerlagh (Reference Papyrakis and Gerlagh2006) who study a two-generation overlapping generations model (without altruism), in which resource revenues are given entirely to the retired old generation. Higher revenues reduce savings, and therefore the economy is resource cursed in that the steady state income level declines as the revenue increases.Footnote 5 Our study emphasizes that the occurrence of a resource curse situation in an overlapping generations growth regime is tied to the distribution of direct transfers of the revenue across generations. This result, in turn, suggests that the resource curse can be avoided by means of appropriate spending policies.
Our model is also related to the literature that studies effectiveness of economic policy in an altruistic setting. Caballe (Reference Caballe1998) analyzes how taxation of labor and capital influences not only growth performance, but also the growth regime. In his model, the level of altruism that distinguishes the growth regime is determined by the tax policy. Finally, Croix and Michel (Reference Croix and Michel2002: ch. 2) analyze the neutrality of economic policy, when the bequest motive is operative.
The paper proceeds as follows. We present the model in section 2. In section 3, we explain the market equilibrium and characterize the conditions for the altruism factor, which distinguish the growth regime. In section 4, we analyze how spending policies matter for how natural resource revenues impact growth and welfare. In section 5, we discuss the assumptions of the model and in section 6 we study the social planner solution. The final section provides concluding remarks.
2. The model
The economy is closed and described by a one-sided altruistic overlapping generations' framework. Parents care about the welfare of their offspring and have the possibility to make intergenerational transfers to their immediate descendants in the form of bequests. Individuals live for two periods: as young and as old. Only the young generation works, the old generation is retired. There are L individuals in each generation, which remains constant over time.
2.1. Natural resource revenues
In every period t, revenues from what we interpret as the sale of a natural resource enter the economy. Our theoretical model, however, equally applies to inflows of foreign aid and other gifts and transfers from abroad. For convenience, we assume that the resource revenues grow at the same rate as the rest of the economy.Footnote 6 This is equivalent to assuming that the value of the revenue is exogenously given as a fixed fraction, ξ, of the real value of man-made output, Yt, where 0 < ξ < 1. We may think of the level of ξ, which we refer to as the natural resource intensity, as a country-specific characteristic.Footnote 7
Let Et denote the real value of the revenue; then

With this specification, we focus purely on spending policies in relation to intergenerational transfers and economic growth.Footnote 8 Similar ways of modeling of the revenue (or foreign aid) are found in Lesink and White (Reference Lesink and White2001), Torvik (Reference Torvik2001), Chatterjee et al. (Reference Chatterjee, Sakoulis and Turnovsky2003), and Papyrakis and Gerlagh (Reference Papyrakis and Gerlagh2006).
2.2. Spending policies
Based on a spending policy, a government spends all resource revenues in every period on one or two purposes.
First, the government may allocate a share, the transfer share τ, where 0 ≤ τ < 1, directly to members of society in a lump-sum fashion. From this share, the young share parameter, π, is given to the young generation and the rest, (τ − π), to the old; i.e., 0 ≤ π ≤ τ.
Second, the government invests the remaining resource revenue in a public service flow, Gt, that works as input into production. We think of the public service as a broad range of services that could be infrastructure, administration, legal, and environmental services. There are no externalities associated with the use of public services.
In every period, the government runs a balanced budget. It cannot issue debts nor run surpluses by accumulating assets. Hence

Therefore, the resource constraint, which is the public budget, satisfies

2.3. Firms
A representative firm produces man-made output, Yt, and uses three factors in production: labor, L, the average public service flow per worker, gt ≡ Gt/L, and capital, Kt. Output per worker, yt, is produced according to the following production technology

where 0 < α < 1 is the share of labor and of public services in production, A is a positive constant productivity term, and kt is capital per worker. Labor productivity increases as the public service flow per worker, gt, increases.Footnote 9
The representative firm maximizes profits, taking gt, as well as the price of output, which is the numeraire, and of inputs, as given. Capital fully depreciates in each period,Footnote 10 and each factor is paid its private marginal product.


where rt is the rental rate of capital, and wt is the wage rate.
2.4. Altruistic individuals
Newborn individuals are identical within as well as across generations. A parent is altruistic with respect to the welfare of her offspring in the Barro (Reference Barro1974) sense and weights her offspring's utility in her utility function, Vt. Let Ut denote utility derived from life-cycle consumption; thus, total utility of an individual at time t can be presented as

where 0 < β < 1 is the intergenerational discount factor, which we refer to as the altruism factor. When generations are altruistic, parents care about the welfare of their children, who in turn care about the welfare of their children, and so forth. In this way, welfare of all future generations is linked.Footnote 11
Utility from own consumption is the sum of utility from consumption as young, c 1t, and the discounted utility of consumption as old, c 2t +1. Specifically

where 0 < ρ < 1 is the intertemporal discount factor. By recursively eliminating Vt +i, i = 0, . . . , ∞, in (7) we haveFootnote 12

saying that utility of a young individual born at time t equals own life-cycle utility plus the discounted sum of life-cycle utilities of her descendants.
In any period t, the young individual inelastically supplies one unit of labor for which she receives the market wage rate, wt. When the young share parameter, π, is positive, she also receives a direct transfer as a share of the natural resource revenue, and, finally, she may inherit bequests, bt, from her parents. She consumes c 1t and saves st for her retirement. Hence

where πe t ≡ π E t/L denotes the lump-sum resource revenue income of a young individual at time t. When old, she receives the proceeds of her saving, (1+r t+1)st, where rt +1 is the rate of interest. In addition, if π < τ, she receives income from the natural resource, which she consumes and possibly bequeaths to her offspring. Accordingly, her period two budget constraint can be written as

where (τ − π)et +1 is the resource revenue lump-sum given to an old person at time t + 1. Bequests cannot be negative, i.e. bt +1 ≥ 0. This restriction prevents parents from leaving debts to their children.
The dynamics of bequests are found by eliminating st in (10) and (11)

An individual of generation t maximizes life-time utility given in (9) subject to the two budget constraints, (10) and (11), and the non-negativity constraint on bequests by optimally choosing consumption, savings, and bequests, taking bt, wt, rt +1, et, and et +1 as given.
The Lagrangian of period t is equal to life-cycle utility, Ut, with the change bp t+1b t+1−ptbt in the shadow value of bequests, pt, over a period (Croix and Michel, Reference Croix and Michel2002: 244)

Note that bt +1 ≥ 0 implies (1 + r t+1)(b t + w t + πe t) + (τ − π)e t+1 ≥ (1 + r t+1)c 1t + c 2t+1. Incorporating this restriction into the maximization problem, the optimality conditions, which are both necessary and sufficient, are given by

and

The transversality condition is

Equation (14) describes the trade-off between a person's consumption as young and as old. In the optimum, the individual is indifferent between consuming as young and saving for old consumption. In equation (15), when  , then bt +1 > 0, and when
 , then bt +1 = 0. When bequests are positive, a parent's marginal utility of own consumption equals her marginal utility of the offspring's consumption. If a parent's marginal utility from her offspring's consumption is less than the marginal utility of her own consumption, then bequests are zero, and the solution is given by a corner solution.
3. Market equilibrium
For simplicity, we normalize the number of working people, L, to unity, so we can write Et = et, Yt = yt, Kt = kt, and Gt = gt. We obtain the following expression by rewriting (4) using (2)

where  . The larger the share of the natural resource revenues spent on direct transfers, the smaller the public service flow. This implies a smaller public service flow capital ratio,
 . Due to the AK structure of the model, it also leads to a drop in the output–capital ratio. Therefore, all things equal,
 ; higher revenue intensity increases public services.
Using (5), (6), and (17), factor market clearing implies


where w(τ, ξ) denotes the wage rate–capital ratio. Both the rate of return and the wage rate are positively associated with the public service flow–capital ratio,  and, thus,
 and
 .
The capital market equilibrium requires savings of the young to equal capital installed in the productive sector

Lastly, the goods market equilibrium is given by the aggregate resource constraint. Using the budget constraints (10) and (11), and the equilibrium conditions (2), (18), (19), and (20), the aggregate resource constraint can be expressed as

Total income in period t is the sum of man-made output plus the natural resource revenue.
3.1. Dynamics
In the following, we distinguish two growth regimes of the economy based on the presence of intergenerational transfers. When parents' marginal utility of own consumption is larger than the marginal utility they derive from the offspring's consumption, the non-negativity constraint on bequests is binding, and there are no bequests.
Overlapping generations growth regime
When bequests are absent in (10) and (11), we can, by also using (14), derive the expression for the savings st

Savings are increasing in wages and resource revenues received as young, and decreasing in resource revenues received as old. This is intuitive; consumption smoothing requires higher savings when the income as old is smaller relative to income as young.
Using (20) in (22), we get the law of motion of capital. Dividing both sides by kt, we find

where γt+1O = (k t+1/k t) − 1 is the growth rate of capital (and also capital per worker due to a constant labor force) when bequests are absent. Note that e t = ξy t = ξf(τ, ξ)k t. Rearrange, and γt+1O can be expressed as

We define a balanced growth path as a path along which c 1t, c 2t, kt, yt, gt, and et grow at constant relative rate in all periods t > 0. From (17) it follows that capital grows at the same rate as output. Since resource revenues are given as a fixed fraction of output (in (1)), it follows immediately that also revenues grow at the same rate as output. Moreover, as public services are given as a fixed fraction of total resource revenues (in (2)), public services grow at the same rate as output. From the goods market equilibrium, (21), it follows that aggregate consumption (c 1t plus c 2t) grows at the same rate of output. By (14), (18), and rt = r(τ, ξ), it then follows that period one and period two consumption grow at the rate of output. Hence, the bequest constrained economy has no transitional economics; c 1t, c 2t, kt, yt, gt, and et grow at the same rate along a balanced growth path at all periods t.
We denote values taken by the variables on the balanced growth path without bequests with the superscript ‘O’. Using (18), (19), and taking kO 0 > 0 as given, equilibrium is given by


On this growth path, parents behave as if they are selfish as they do not leave intergenerational transfers. Essentially, the economy behaves like an overlapping generations model.
Growth is positive when income received in period one is sufficiently large to ensure that savings exceed the capital depreciation. Accordingly, ρ(1 − α)f(τ, ξ)(α + πξ) > (1 + ρ)(1 − α) + (τ − π)ξ implies that γO(π, τ, ξ) > 0.
Dynastic growth regime
When bequests are positive, by (15)  , and the economy is dynastic. In this regime, the growth rate of period one consumption (which, as discussed below, is also the growth rate of capital), γt+1D, is found by dividing the first-order solutions given in (14) and (15)

Again, we define a balanced growth path as a path along which c 1t, c 2t, kt, yt, gt, bt, and et grow at a constant relative rate in all periods t > 0. From (17) it follows that capital grows at the same rate as output. Since resource revenues are given as a fixed fraction of output (in (1)), it follows immediately that natural resource revenues grow at the same rate as output. Moreover, as public services are given as a fixed fraction of resource revenues (in (2)), also public services grow at the rate of output.
By the goods market equilibrium, (21), and rt = r(τ, ξ), it must be that if capital and output grow as the same rate, then this rate equals that of growth of consumption. From (14), we know that consumption as old and as young is a constant ratio, so old consumption grows at the same rate as young consumption. From either of the budget constraints (10) or (11), it follows that also bequests grow at the same rate as consumption. Thus, also the bequest constrained economy has no transitional economics; c 1t, c 2t, kt, yt, gt, bt, and et grow at the same rate along a balanced growth path at all periods t.
From the first-order conditions to (13), it can be shown that pt equals  , when bequests are positive.Footnote 13 Hence, pt decreases at the rate γD(τ, ξ). We can thus conclude, that when bt > 0, then ptbt is a constant, and the transversality condition in (16) simplifies to β < 1. When (15) holds with equality, parents leave bequests and the economy behaves like a dynasty of infinitely lived generations.
We denote values taken by the variables on the balanced growth path with positive bequests with the superscript ‘D’. Equilibrium is given by
}}{{\beta + \rho }} - \pi \xi } \right\}k_t^D \equiv b_t^D (\beta ,\tau ,\xi ),
\end{equation}](https://static.cambridge.org/binary/version/id/urn:cambridge.org:id:binary:20160920233610680-0331:S1355770X08004683:S1355770X08004683_eqn28.gif?pub-status=live)


with kD 0 > 0.
Along this growth path, the growth rate is positive when  This condition says, for a young individual to have positive savings and bequests, marginal utility of consuming one unit extra as young is less than marginal utility derived from letting the offspring consume 1 + r(τ, ξ) units.
In general, the growth paths described by (23) and (27) differ, as does the way they respond to changes in revenues and in spending policies.
3.2. Identifying the growth regime
Though the altruism factor, β, is exogenously given, whether bequests are positive or zero, is determined endogenously by the first-order condition given in (15). From (15) we know that when parents' marginal utility of own consumption is greater than their marginal utility from the offspring's consumption, the economy is without bequests. A decline in the consumption of the offspring relative to consumption of the parent triggers intergenerational transfers, if the decline is large enough.
We define the threshold value of the altruism factor, β*, such that under a given spending policy, (τ, π), when β = β*, then γO(π, τ, ξ) = γD (β, τ, ξ). In the special case, where β = β*, b tD (β, τ, ξ) = 0 and parents leave zero bequests. Inverting (27), substituting in (23), using (18) and (19) yields

Using this definition of β*, we obtain the standard result (Weil, Reference Weil1987; Caballe, Reference Caballe1998; Cardia and Michel, Reference Cardia and Michel2004) that when the altruism factor is less than the threshold value, β < β*(π, τ, ξ), the economy is without bequest, and the growth path is described by (23). On the other hand, when the altruism factor is higher than the threshold value, β > β*(π, τ, ξ), bequests are positive, and growth evolves according to (27). We can now compare growth rates in the two regimes:
Lemma 1. Given β ≠ β*(·) and all else equal, then, if β > β* (·), the economy grows faster than if β < β*(·).
Proof. By (32), (23) can be rewritten as γO (·) = β*(·)(1 − a)f(·) − 1. The economy follows this growth path as long as β < β*(·), but shifts to γD (·) = β(1 − a)f(·) − 1 when β > β*(·). Hence, it follows that γO(·) < γD(·). □
We observe in particular that β*(π, τ, ξ) is a function of the spending policy as well as the level of the natural resource intensity: the larger the direct transfers given to the young, πξ, the more altruistic the parents must be in order to leave bequests. Moreover, as the direct transfers given to the old become larger, less altruistic parents also leave bequests.
Only when  do changes in ξ have no effect on β*(π, τ, ξ). When
 ,
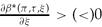 . In general, therefore, changes in ξ may ‘push’ economies from one growth regime to another.
4. Predictions of the model
In the following, we examine growth and welfare effects of an increase in the level of natural resource intensity. In order to do so, we must characterize the resource impact both when the economy remains within its original growth regime and when the economy shifts growth regime.
4.1. Resource impact when the growth regime endures
Lemma 2. Consider an economy which remains in its original growth regime after an increase in the natural resource intensity, ξ. Then, there exist exogenous spending policies (τ, π) where 0 ≤ π ≤ τ < 1, which imply a resource curse when bequests are absent (whether this is due to the policy or a low altruism factor). When bequests are present, however, increased resource intensity leads to increased growth.
Proof. When bequests are absent, along γO(ξ, ·)

A policy where π = 0 and  implies
 . In a dynastic growth regime

which shows that a resource curse situation cannot arise when bequests are positive. □
An operative bequest motive eliminates the resource curse threat as the growth rate in this regime is increasing in the rate of return to capital, which, in turn, is increasing in resource intensity, i.e.  . Savings are unaffected by the allocation of direct transfers as any change in revenues given to a young individual is offset by an identical opposite change in bequests.Footnote 14 Hence, γD(ξ, ·) is independent of the young share parameter, π.
When bequests are absent, accumulation of capital depends on the distribution of resource revenues across generations. For example, a policy that distributes all direct transfers solely to the old generation may lead to a resource curse outcome, in which higher resource intensity results in less savings. The resource curse prevails when, due to increased resource intensity, a young individual derives a higher marginal utility of consuming as young than as old, i.e. what generates the resource curse is a ‘disproportional’ large direct transfer to the old generation in the situation where bequests are absent.
4.2. Resource impact when the growth regime changes
In the following, we examine what happens to the growth rate when increases in ξ cause the economy to shift regime:
Lemma 3. There exist exogenous spending policies (τ, π) where 0 ≤ π ≤ τ < 1 for which a change in growth regime invoked by increased natural resource intensity implies a resource curse. When the economy shifts from an overlapping generations regime to a dynastic regime due to increased natural resource intensity, then growth can be lower in the new regime than in the old. When the economy shifts from a dynastic regime to an overlapping generations regime, however, there is no resource curse.
Proof. See appendix.
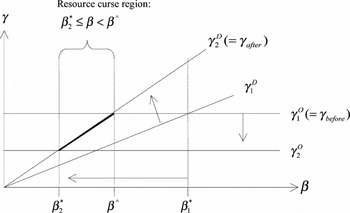
The situation where a resource curse can occur as a result of a change in growth regime induced by enhanced natural resource intensity is illustrated in figure 1, where subscript ‘1’ refers to the situation before and subscript ‘2’ refers to the situation after, an increase in the level of natural resource intensity (i.e. in ξ). The horizontal lines illustrate the growth rate in the overlapping generations regime, γO, which is independent of the altruism factor (cf. (25)) and the growth rate in the dynastic regime, γD, which increases in β (cf. (29)).
Impact on growth from changes in growth regime, prompted by an increase in natural resource abundance

Consider a situation in which before the change in natural resource intensity β < β1* and hence the economy evolves along γ1O. Now suppose that the natural resource intensity increases; that the spending policy is such that both the threshold altruism factor and the growth rate in the overlapping generations regime declines (to β2* and γ2O respectively); and moreover that β2* ≤ β so that the economy shifts to the dynastic regime, where the growth rate is given by γ2D. Then, as illustrated by the thicker part of γ2D, if β < β^, the growth rate declines. Interestingly, however, we also notice that growth declines less than it would have done otherwise without the regime shift, in which case the growth rate would be γ2O. Indeed, if β ≥ β^, a potential resource curse situation (as described in lemma 2) is prevented by the regime shift as in this case γ2D > γ1O.
Proposition 1. Given an exogenous policy (τ, π) where 0 ≤ π ≤ τ < 1, then when direct transfers from the government are absent, or when they, if present, are allocated only to the young generation, there is no resource curse.
Proof. Within growth regimes, by lemma 2, we only analyze an economy without bequests. If π = τ = 0, then

and, if π = τ, then

Moreover, when π = τ = 0, then  in which case the growth regime remains unchanged. When π = τ,
 , which means that the growth regime may change from the dynastic growth regime to the overlapping generations regime. When the growth regime changes, however, by lemma 3, only a shift from an overlapping generations regime to a dynastic regime may cause a resource curse. □
While escaping the resource curse by letting π = τ, the overlapping generations economy may, however, suffer from another potential problem: dynamic inefficiency. When bequests are absent, the only way for the young to provide for themselves when old is to save, which they may do even if the interest rate is very low. In this case, transferring resources from the young generation to the old generation is Pareto efficient.
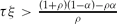
Dynamic inefficiency in endogenous growth models occurs when the competitive rate of interest falls short of the growth rate (King and Ferguson, Reference King and Ferguson1993). This condition corresponds to β*(·) > 1.Footnote 15 In the case where π = τ, then  ; therefore, in this case, this spending policy triggers dynamic inefficiency when
 and bequests are absent.
Turning to the issue of how natural resources impact welfare levels, we make another interesting observation:
Proposition 2. Given an exogenous policy (τ, π) where 0 ≤ π ≤ τ < 1, increased natural resource intensity may improve welfare of the two current generations, despite causing a resource curse (growth decline).
Proof. See appendix.
This result suggests that, when the economy is bequest constrained, policies exist for which the direction of the growth impact is opposite of the welfare impact: overall utility levels increase when benefits from consumption caused by higher direct transfers outweigh losses from a decline in growth.
The policies considered in this section are arbitrary policies. In the following, we shall examine the social planner solution, but first we discuss our model in more detail.
5. Discussion
In this section, we discuss the key assumptions of our model. One assumption is that decentralized revenues affect the flow of bequests from the old to the young. First, real examples of direct transfers of resource revenues are found for instance in Alaska. One purpose of the so-called Alaska Permanent Fund is to distribute the returns of the fund, which come from minerals and oil, to all inhabitants of the state in the form of a check (Hannesson, Reference Hannesson2001). Other oil funds have different objectives. For example, the purpose of the oil funds in Chad is to invest in public health, social services, education, and infrastructure among others (World Bank, 1999). Second, some empirical support for the assumption that public transfers interact with private transfers can be found in Cox et al. (Reference Cox, Galasso and Jimenez2006). In a cross-section study (of developing countries) the authors find an inverse relationship between the two. In general, however, the link is still debated.Footnote 16
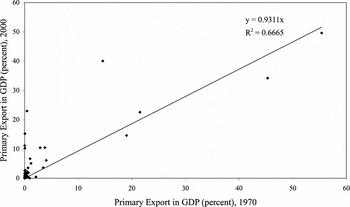
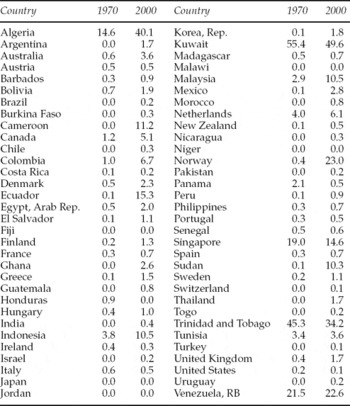
Another assumption which deserves further discussion is presented in equation (1), namely that resource revenues are set proportional to man-made output. Using data from World Bank (2005), we find that over a period of 30 years (1970–2000), the share of primary exports (combined mineral and agricultural products) in GDP has remained fairly stable in a cross-section of countries as presented in figure 2 and further illustrated by table 1 in appendix B.Footnote 17
Development of primary exports in GDP over a generation (30 years) Source: Data from world Bank (2005).

Modeling exactly how revenues develop over time relative to the rest of the economy, however, is a complicated task and beyond the scope of this paper. Factors such as productivity spillovers from the traditional sector to the resource sector, the price developmentFootnote 18 of the resource(s), and the rate of extraction or harvest of the resource are all likely to play an important role.
Moreover, the assumption is convenient as it allows us to make a real economic analysis of how natural resource revenues impact long-run growth performance. We could also think of the natural resource revenue as being constant. In this case, without other financial instruments, the model is no longer capable of endogenous growth since, for fixed G (the resource revenue would be the maximum value that G could take), the economy faces diminishing returns to capital accumulation. Yet, introducing other financial instruments, such as lump-sum taxes, would allow endogenous growth to be maintained. In this case, if resource revenues are constant, however, the role of the natural resource revenues and the issue of how they are spent become irrelevant as the rest of the economy grows. Therefore, natural resource revenues must grow in proportion to the rest of the economy in order to make an analysis of their long-run growth impact relevant.
Finally, our model abstracts from issues of corruption and rent-seeking, while these issues also play an important role in much of the resource curse literature. One way to think about corruption within the current model is to assume that the amount of natural resource revenue allocated for public productive spending and decentralized revenues is equal to Et = κXt, where 0 < κ ≤ 1 is a leakage parameter that measures how much of the gross natural resource revenue, Xt, ‘disappears’ from the economy. If κ equals one, there is no leakage, and all revenues are being used within the economy. The intuitive interpretation of this extension to the model is that if natural resources are positive for growth, leakage, i.e. corruption, is bad for growth, and vice versa.Footnote 19 Hence, in this framework situations may exist where leakage diminishes the resource curse effect induced by poor spending policies. Overall, however, the fundamental dynamics of the model remain unaffected by introduction of such leakage.
6. The social planner
This section introduces a social planner, whose objective is to maximize welfare, Wt, of current and all future generations. The role for a social planner is threefold as the model has three sources of inequality between the social planner equilibrium and the market equilibrium. First, we noted that when bequests are absent, the market equilibrium may be dynamically inefficient. Second, due to absence of taxes in the market equilibrium the public service investments cannot exceed the resource revenue. There may be situations, however, for which the social planner level of public service flow exceeds the resource revenue. Lastly, the positive effect on GDP from man-made production, in the form of increased resource revenue, is external to the producers leading to under-saving and under-accumulation of capital.
6.1. The social planner solution
Welfare at time t = 0, W 0, is given as a weighted sum of current and future utilities of the members of society by a social welfare function that can be presented as

where β is the planner's intergenerational discount factor.Footnote 20
The social planner runs a balanced budget, which is given by the aggregate resource constraint (identical to the aggregate resource constraint in the market economy given in (21))Footnote 21

with initial capital k 0 > 0. The variable gt denotes the level of public service chosen by the social planner. Using this constraint, and substituting c 1t, (33) can be rewritten as

The necessary transversality condition is given by

where qt is the shadow price of the capital stock. Equation (36) ensures that the discounted value of wealth tends to zero and that (33) converges (Croix and Michel, Reference Croix and Michel2002: 252).
The solution to the social planner's problem is found by differentiating (35) with respect to c 2t, kt +1, and gt. We obtain the following conditions satisfied for all periods, t

and

Equation (37) says that the ratio between the utility of consumption of the young and the old generation must equal the ratio between the intertemporal and intergenerational discount factor. Unlike the solution to the altruistic generations' problem, this equation must hold, since otherwise the social planner could increase welfare by shifting consumption across generations. Equation (38) says that the ratio between utility of young consumption in two consecutive periods must equal the intergenerational discount rate multiplied by the gross return on capital, since this is the return to savings. As capital fully depreciates, the social return to capital, rspt, is

so (38) can be rewritten as

The social planner chooses an optimal public service flow that satisfies

In optimum, the marginal benefit of increasing the public service, the rise in man-made output plus resource revenues, is exactly equal to the cost of doing so. By use of (4), (41) can be expressed as

As gt is a constant fraction of yt, in optimum the public spending output ratio is constant. Applying this expression of gt, we can rewrite (4) as

Using (43), we can express rspt from (39)

By (40), the growth rate in the consumption of the young generation, γt +1, is

We define an optimal balanced growth path as a path along which c 1t, c 2t, kt, yt, gt, and et grow at a constant relative rate, γ(ξ), at all periods t > 0. From (43) it follows that capital grows at the same rate as output. Since resource revenues are given as a fixed fraction of output (in (1)), it follows immediately that the inflow of natural resource revenues grows at the same rate as output. Moreover, as public services are given as a fixed fraction of total resource revenues (in (42)), also public services grow at the rate of output.
By the resource constraint (in (34)) and (44) it must be that if capital and output grow at the same rate, then this rate equals that of consumption. From (37), we know that the ratio of young and old consumption is constant; thus, old consumption grows at the same rate as young consumption.
It can be shown that qt equals  (Croix and Michel, Reference Croix and Michel2002: 103) and therefore decreases at the rate γ(ξ), and the transversality condition in (16) simplifies to β < 1. To ensure non-negative growth, we assume that
 . The economy has no transitional economics; c 1t, c 2t, kt, yt, gt, and et are an optimal solution to the social planner's problem and grow at the same rate along a balanced growth path at all periods, where (45) characterizes the balanced growth path. Along such a path, equilibrium is given by


with k 0 > 0 given.
Proposition 3. Under the social planner solution, growth and welfare increase when inflows of natural resource revenues increase.
Proof. By (33)

As  we can conclude that the resource curse does not exist, and, further by
 and
 , that
 . □
This result is related to the ‘neutrality property’ of economic policy discussed in, e.g. Barro (Reference Barro1974). The key insight is that (40), which is the social planner counterpart to (15) in the market economy, holds with equality; just as it does in the market economy when bequests are positive, i.e. along γD(ξ).
In the following, we suggest how the social planner may decentralize this solution to the market economy.
6.2. Decentralization
Decentralization requires several policy instruments. First, to internalize the spillover effect from man-made production on to resource revenues, the social planner subsidizes the firms with a transfer that equals that of the resource revenue. The representative firm solves

taking gt, rt, and wt as given. Hence, from the standpoint of the firm

and the private marginal return to capital coincides with the social marginal return.
Instead of financing the transfer to the firms through a lump-sum tax, we assume that the social planner finances the transfer with the resource revenue itself. In this case, as resource revenues are allocated to the firms, the social planner collects lump-sum taxes to invest in the public service. The issue then becomes how to collect taxes, rather than how to distribute revenues, across generations. It is convenient to let the tax be a share of GDP, so that tax payments

where the lump-sum tax rate,  is a constant. It follows from the balanced budget that 0 < < 1. The social planner collects a share,
 , of the tax payments from the young generation and the rest, (1 − ), from the old generation. An altruistic individual is now faced with the following budget constraint

when young, and

when old, where the real wage rate, wt, can be derived from (49), and where bt ≥ 0.
Lemma 4. Let and be a policy that decentralizes the resource allocation chosen by the social planner. Then = α and  .
Proof. The size of the public service is optimal when (42) equals (51). Hence, = α.
The transfer which ensures the market economy consumption path equals that of the social planner satisfies for old consumption, by (53) and (47), that

Substituting r sp(ξ), kt, and gt, and solving for , we find  . When , bequests are just equal to zero

This ensures that (37) just holds, and it can be shown that also the growth rate and the consumption path of the young also equals that of the social planner path. □
Moreover, when bequests are positive

As

and

we have that

Hence, consumption is invariant to changes in as long as 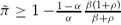 . The share, , thus provides a lower bound on how little the young may be taxed and still leave the parent at least indifferent between leaving bequests or not. When 1 > > 0, both the old and the young contribute to the public service. When = 0 only the old pay, and when < 0 only the old pay and the young generation receives a transfer. The share, , cannot be higher than one, since then the young would have negative consumption.
As we expect, an optimal balanced growth path is dynamically efficient. When  , parents are indifferent about leaving bequests and β = β*. Since β < 1, the rate of return is higher than the rate of growth.
7. Concluding remarks
Using an endogenous growth model with altruistic overlapping generations, we propose a theory that can explain manifold economic adjustment patterns to changes in natural resource richness. Nations may be in different growth regimes that vary in how savings are affected by an otherwise identical allocation of natural resource revenues, or otherwise identical nations may pursue slightly different spending policies, which can result in dramatic differences in growth effects.
As first pointed out by Weil (Reference Weil1987), there is a threshold level of altruism that separates the two growth regimes. In our model, this threshold level of altruism, which is determined endogenously, is influenced by the allocation and the intensity of the resources. When the parents' altruism level is higher than the threshold altruism level, the bequest motive is operative, and increasing resource intensity is positively related to growth rates as well as to welfare levels of either generation. Bequests interrupt the connection between direct transfers from the government and savings by allowing for offsetting intergenerational transfers from the old to the young. Therefore, savings are unaffected by how resource revenues are allocated across generations. In contrast, a resource curse may exist when the bequest motive is not strong enough that parents leave positive bequests. In this case, policies that allocate revenues to the old generation may harm savings of the young and subsequently growth. Yet the effect on the current generation's welfare is ambiguous; resource intensity may increase consumption levels which then (possibly more than) compensates for reduced growth. Nevertheless, by solving the social planner's problem, we show that under optimal polices there can never be a resource curse as defined here. The reason is that the social planner can ensure that the intergenerational transfer link is operative.
Further theoretical work may seek to endogenize the policy decision which is modeled exogenously in this model. Such models will add to the literature on political economy explanations for the resource curse. In addition, further examination of what factors, for instance, life-expectancy or fertility, influence the strength of the bequest motive may be helpful in identifying how nations are affiliated with growth regimes.
Appendix
A.1. Proof of lemma 3
Combining (23) and (32) gives γO(ξ, ·) = β*(ξ, ·)(1 − a)f(τ, ξ) − 1. Then

where  and
 By (27), we derive

where  .
There are three situations:  ,
 , and
 .
First, when , the growth regime remains unaltered by higher resource revenues (and  and
 .
Second, when , if an economy changes regime, it changes from a dynastic to an overlapping generations regime. When β = β*(ξ, ·), by definition γO(ξ, ·) = γD(ξ, ·) and thus, when β < β*(ξ, ·), the initial growth rate γD(ξ, ·) is less than γO(ξ, ·). Hence, when the economy shifts from γD(ξ, ·) to γO(ξ, ·), and since in this situation, the economy grows faster on the new growth path than on the old growth path.
Third, when , if the economy changes regime, it changes from an overlapping generations regime to a dynastic regime. Again, when β = β*(ξ, ·), by definition γO(ξ, ·) = γD(ξ, ·).
Consider first the situation where , but  . Using the subscript ‘1’ as a reference to the situation before and subscript ‘2’ as a reference to the situation after an increase in natural resource intensity, then γ2O(ξ, ·) ≥ γ1O(ξ, ·). Since, for the regime shift to occur, β > β2*(ξ, ·), and since, when β = β2*(ξ, ·), by definition γ2O(ξ, ·) = γ2D(ξ, ·)(= βf(τ, ξ2)(1 − α)), we have that a regime shift implies γ2D(ξ, ·) > γ1O(ξ, ·), i.e. the economy grows faster on the new growth path (γ2D(ξ, ·)) than on the old growth path (γ1O(ξ, ·)).
Now, consider the situation where and . Again, using the subscript ‘1’ as a reference to the situation before and subscript ‘2’ as a reference to the situation after an increase in natural resource intensity, then γ2O(ξ, ·) < γ1O(ξ, ·). For the regime shift to occur, β > β2*(ξ, ·), and since, when β = β2*(ξ, ·), by definition γ2O(ξ, ·) = γ2D(ξ, ·)(= βf(τ, ξ)(1 −α)), we have that growth is higher along the new growth path than along the old growth path, i.e. γ2D(ξ, ·) ≥ γ1O(ξ, ·), only if β ≥ β^, where β^ is defined as the value of the altruism factor for which γ1O (ξ, ·) = γ2D(ξ, ·). If β < β^, the economy grows slower along the new grow path than along the old growth path. □
A.2. Proof of proposition 2
We prove proposition 2 by presenting parameter combinations for which  and, for both the young and the old generation,
 .
Utility of a representative young individual at time t in the overlapping generations' regime, V tO, is given as

where

Utility of a representative old individual at time t in the overlapping generations' regime, V tO, is given as

where

When π = 0, then

and

and

Substituting (56), (57), and (58) in (54) and (55) gives

and

We proceed by use of a numerical example in which α = 0.2, ρ = 0.5, and β = 0.1.
By the proof of lemma 2, when π = 0, then  . Hence,
 implies for the numerical example that ξτ > 0.4.
Moreover,  implies

and  implies

Since 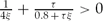 , then implies . Hence, we can focus on welfare of the young generation. We complete the proof by providing an example where ξτ > 0.4 and
 . For example, ξτ = 0.5 > 0.4 satisfies the first condition, and
 satisfies the second condition. Hence, ξτ = 0.5 satisfies , and . □

 implies that
 , and
 implies that p t = βp t+1[1 + r(τ, ξ)], so it follows that
 .
 , where
 . Now, write
 . Calculating
 using
 gives

 .