Introduction
Schizophrenia (SZ) is thought to be a clinically heterogeneous disease. Classifying patients into deficit form of SZ (D-SZ), which is defined by severe primary negative symptoms, and non-deficit form of SZ (ND-SZ) is one method to study the heterogeneity of SZ and seek for the underpinnings in the sub-populations of SZ patients who exhibit different clinical features. Previous studies have demonstrated that there are several differences between D-SZ and ND-SZ such as genetic liability (Messias et al., Reference Messias2004), neurocognitive performance (Cascella et al., Reference Cascella2008), response to the treatment (Kirkpatrick et al., Reference Kirkpatrick2001) and clinical outcome (Tek et al., Reference Tek, Kirkpatrick and Buchanan2001). The D-SZ syndrome endures as trait-like features even during periods of clinical stability (Carpenter et al., Reference Carpenter, Heinrichs and Wagman1988).
The neurodevelopmental model of SZ has widely been accepted (Weinberger, Reference Weinberger1987; Insel, Reference Insel2010). Brain gyrification is a candidate for a potential marker of early neurodevelopment, as cortical folding is mainly formed in the late second-to-third trimesters (Armstrong et al., Reference Armstrong1995; Zilles et al., Reference Zilles, Palomero-Gallagher and Amunts2013). Past studies have suggested frontal gyrification to be correlated with cognitive function in SZ patients (Nakamura et al., Reference Nakamura2007) as well as in healthy subjects (Gautam et al., Reference Gautam2015). Recently, an automated method to measure the local gyrification index (LGI) has widely been used to examine the degree of gyrification in several populations, including individuals with SZ (Palaniyappan et al., Reference Palaniyappan2011; Haukvik et al., Reference Haukvik2012; Nanda et al., Reference Nanda2014; Nesvag et al., Reference Nesvag2014; Sasabayashi et al., Reference Sasabayashi2017).
Previous structural magnetic resonance imaging (MRI) studies yielded different findings in individuals with D-SZ as compared with healthy controls (HCs) or ND-SZ patients. Although some studies demonstrated regional gray matter reductions (Cascella et al., Reference Cascella2010; Fischer et al., Reference Fischer2012; Takayanagi et al., Reference Takayanagi2013) or cortical thinning (Takayanagi et al., Reference Takayanagi2013), others reported gray matter reduction in ND-SZ patients (Quarantelli et al., Reference Quarantelli2002; Galderisi et al., Reference Galderisi2008) or no difference between D-SZ and ND-SZ in terms of cortical thickness and subcortical gray matter volume (Voineskos et al., Reference Voineskos2013). To our knowledge, however, there is no study that has examined brain gyrification in subgroups of schizophrenia defined based on the clinical profiles (e.g. D-SZ and ND-SZ). Therefore, it remains unknown whether the degree of gyrification is altered in D-SZ as compared with ND-DZ or HCs. Investigating changes in the gyrification pattern in individuals with D-SZ and ND-SZ may be useful to clarify whether the difference in the magnitude of neurodevelopmental anomaly is related with the different clinical manifestations in SZ.
In this study, we classified SZ patients into D-SZ and ND-SZ. Then, we used an automated procedure to measure LGI of the entire cortex and compare across the groups (i.e. D-SZ, ND-SZ and HCs). LGI has methodological advantages over other methods for the evaluation of gyral patterns [e.g. two-dimensional (2D) measurement of GI or manual evaluation of sulcogyral patterns] considering the inherent 3D nature of the cortical surface (Schaer et al., Reference Schaer2008). As we mainly included SZ patients with a relatively short illness duration, we hypothesized that SZ patients may exhibit hyper-gyrification based on the findings of recent studies using first-episode patients (FEP) (Narr et al., Reference Narr2004; Schultz et al., Reference Schultz2010; Tepest et al., Reference Tepest2013; Sasabayashi et al., Reference Sasabayashi2017). We also expected the chronicity of illness to correlate with gyrification based on past findings (Schultz et al., Reference Schultz2010; Palaniyappan et al., Reference Palaniyappan2013; Nesvag et al., Reference Nesvag2014; Sasabayashi et al., Reference Sasabayashi2017). Finally, we predicted that D-SZ and ND-SZ would show distinct gyrification alterations.
Methods
Participants
One-hundred and thirty-five patients with SZ were recruited from inpatient and outpatient clinics of the Department of Neuropsychiatry of Toyama University Hospital. Each patient met the ICD-10 research criteria (World Health Organization, 1993) of SZ. The diagnosis of each patient was based on a structured clinical interview by psychiatrists using the Comprehensive Assessment of Symptoms and History (Andreasen and Olsen, Reference Andreasen and Olsen1982; Andreasen et al., Reference Andreasen, Flaum and Arndt1992). The Brief Psychiatric Rating Scale (BPRS) (Rhoades and Overall, Reference Rhoades and Overall1988), the Scale for the Assessment of Negative Symptoms (SANS) and the Scale for the Assessment of Positive Symptoms (SAPS) (Andreasen and Olsen, Reference Andreasen and Olsen1982) were used for the evaluation of clinical symptoms by trained psychiatrists at the time of MRI scanning.
Fifty healthy subjects who were matched to the SZ group in terms of age and gender were selected from our previous studies (Nishikawa et al., Reference Nishikawa2016; Sasabayashi et al., Reference Sasabayashi2017). HCs consisted of the local community residents, university students, and hospital staff. They completed a questionnaire that evaluated their personal (e.g. obstetric complications, head injury, seizures, neurological, or psychiatric disease) and family histories of illness. Subjects were excluded if they had any personal or family history of psychiatric illness in their first-degree relatives.
All subjects were physically sound when they participated in this study and none had a history of severe head trauma, neurological illness, serious medical illness or substance abuse disorders. In this study, gross brain abnormalities were monitored by neuroradiologists for all subjects.
Classification of D-SZ and ND-SZ
We used the score of Proxy for Deficit Syndrome (PDS) for the classification of D-SZ and ND-SZ (Kirkpatrick et al., Reference Kirkpatrick1993). The validity and stability of the differentiation of D-SZ from ND-SZ using the PDS score have previously been demonstrated (Kirkpatrick et al., Reference Kirkpatrick1993; Goetz et al., Reference Goetz2007). The PDS score is defined as the sum of the scores of the anxiety, guilt feelings, depressive mood and hostility items subtracted from the score for blunted affect using the BPRS (Kirkpatrick et al., Reference Kirkpatrick1993). This calculation reflects primary and persistent negative symptoms in deficit syndrome (Carpenter et al., Reference Carpenter, Heinrichs and Wagman1988). To reduce potential false positives (Subotnik et al., Reference Subotnik1998), patients with top and bottom quartile PDS scores were defined as having D-SZ and ND-SZ, respectively. This type of relatively conservative categorization method has already been employed in recent MRI studies (Wheeler et al., Reference Wheeler2015).
Image acquisition
Each participant underwent MRI scanning using a 1.5-T Magnetom Vision (Siemens Medical System, Inc., Erlangen, Germany) with a 3D gradient-echo sequence FLASH (fast low-angle shots) yielding 160–180 contiguous T1-weighted slices of 1.0-mm thickness in the sagittal plane. The imaging parameters were as follows: repetition time = 24 ms; echo time = 5 ms; flip angle = 40°; field of view = 256 mm; and matrix size = 256 × 256 pixels. The voxel size was 1.0 × 1.0 × 1.0 mm3.
Image processing
We used FreeSurfer software suit version 5.3 (http://surfer.nmr.mgh.harvard.edu/) for the measurement of LGI. First, the cortical surface was reconstructed by the FreeSurfer's standard auto-reconstruction algorithm involving tissue intensity inhomogeneity normalization, non-brain tissue removal, transformation to Talairach-like space and segmentation of gray/white matter tissue (Fischl, Reference Fischl2012). Each image was carefully inspected and any segmentation errors were manually corrected by either of the two trained investigators (DS or YT) who were blind to the subjects’ diagnosis. Then, gyrification of the entire cortex was evaluated by the method of Schaer et al. (Reference Schaer2008), which is a vertex-wise extension of the classical two-dimensional gyrification index measurement (Zilles et al., Reference Zilles1988). Following the generation of approximately 800 regions of interest (ROIs) (radius = 25 mm), which partly mutually overlapped and covered the entire cortex, the vertex-wise LGI values were measured by computing the ratio of the outer surface area and the corresponding pial surface in each ROI.
We evaluated the inter-rater reliability for manual correction of segmentation errors by calculating intraclass correlation coefficients (ICC) for the mean LGI values of 68 automatically-segmented ROIs (Desikan et al., Reference Desikan2006) in randomly selected 12 subjects. The ICC was calculated for evaluating the absolute agreement. The inter-rater (DS and YT) ICC for the mean LGI values of ROIs ranged from 0.75 to 0.99.
Statistical analysis
The differences in demographic characteristics among diagnostic groups were compared using the independent two-sample t test, analysis of variance (ANOVA) or χ2 test.
Each LGI value was mapped on a common spherical coordinate system (fsaverage), then a 5-mm Gaussian kernel was used to smooth each map. A general linear model adjusted for age and gender was used to estimate the group differences (i.e. all SZ patients v. HC, D-SZ v. HC, ND-SZ v. HC and D-SZ v. ND-SZ) in LGI in each vertex. Among D-SZ and ND-SZ patients, vertex-wise LGI correlation analyses with clinical measures (i.e. duration of illness, age at onset, daily antipsychotic dosage, duration of antipsychotic medication and SAPS/SANS subdomain scores) were also estimated using a general linear model controlled for age and gender. We did not enter years of education in the statistical models as a covariate because lower educational attainment or cognitive impairment are associated with schizophrenia diagnosis; therefore, adjusting for an educational level may have resulted in overadjustment (Kremen et al., Reference Kremen1995; Keefe et al., Reference Keefe, Eesley and Poe2005). Monte-Carlo simulation implemented in the Analysis of Functional NeuroImages (AFNI)’s AlphaSim program was used to correct for multiple comparisons (Hagler et al., Reference Hagler, Saygin and Sereno2006). The procedure includes Monte-Carlo simulation of the process of image generation, spatial correlation of voxels, voxel intensity thresholding, masking, and cluster identification. To define significant clusters, a total of 10 000 simulations were performed for each comparison. As the Monte-Carlo simulation was not available for some of the correlation analyses with 5-mm or greater Gaussian kernels, a 0-mm Gaussian kernel was used for those analyses. The significance level was set at p < 0.01 (two-tailed and corrected for multiple testing). We used this statistical threshold of p < 0.01 for both uncorrected-cluster formation and Monte-Carlo simulation, given that we conducted four group comparisons (0.01 < 0.05/4). We also employed this p < 0.01 threshold for the correlational analyses (13 tests for two groups) since we concerned type II errors for these analyses.
Results
Demographic and clinical measurements
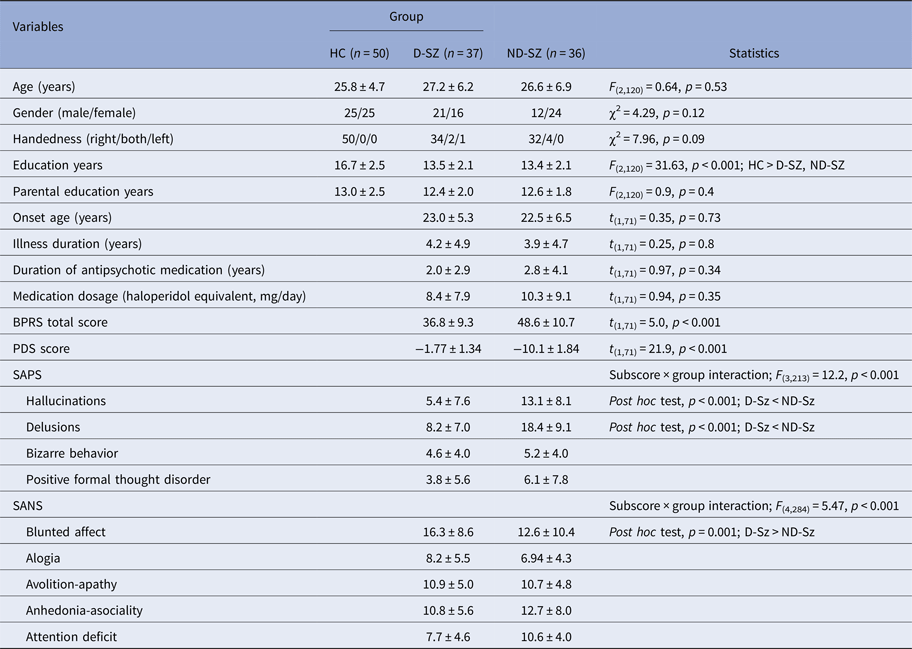
Demographic and clinical characteristics of the subjects are summarized in Table 1. Thirty-eight and 37 SZ patients were classified as having D-SZ and ND-SZ, respectively. For one D-SZ patient and one ND-SZ patient, there were unresolvable segmentation errors, thus these participants were excluded from the analyses. Thirty-four (47%) SZ patients had been included in our previous study (Sasabayashi et al., Reference Sasabayashi2017). Among three groups (i.e. HCs, D-SZ, and ND-SZ), there were no significant differences in terms of age, gender, handedness distribution and parental educational attainment, but HCs had higher educational attainment than D-SZ and ND-SZ patients. D-SZ and ND-SZ groups did not differ regarding age at onset, illness duration, daily antipsychotic dosage or duration of antipsychotic medication. ANOVAs revealed significant subscore × diagnosis (i.e. D-SZ and ND-SZ) interactions for SAPS/SANS. Post hoc tests indicated that although D-SZ patients exhibited more severe blunted affects, they had milder hallucinations and delusions.
Demographics and clinical characteristics

BPRS, Brief Psychiatric Rating Scale; D-SZ, deficit schizophrenia; HC, healthy controls; ND-SZ, non-deficit schizophrenia; PDS, Proxy for Deficit Syndrome; SANS, Scale for the Assessment of Negative Symptoms; SAPS, Scale for the Assessment of Positive Symptoms.
Values represent means ± s.d. unless otherwise stated.
LGI differences between groups
SZ v. HC
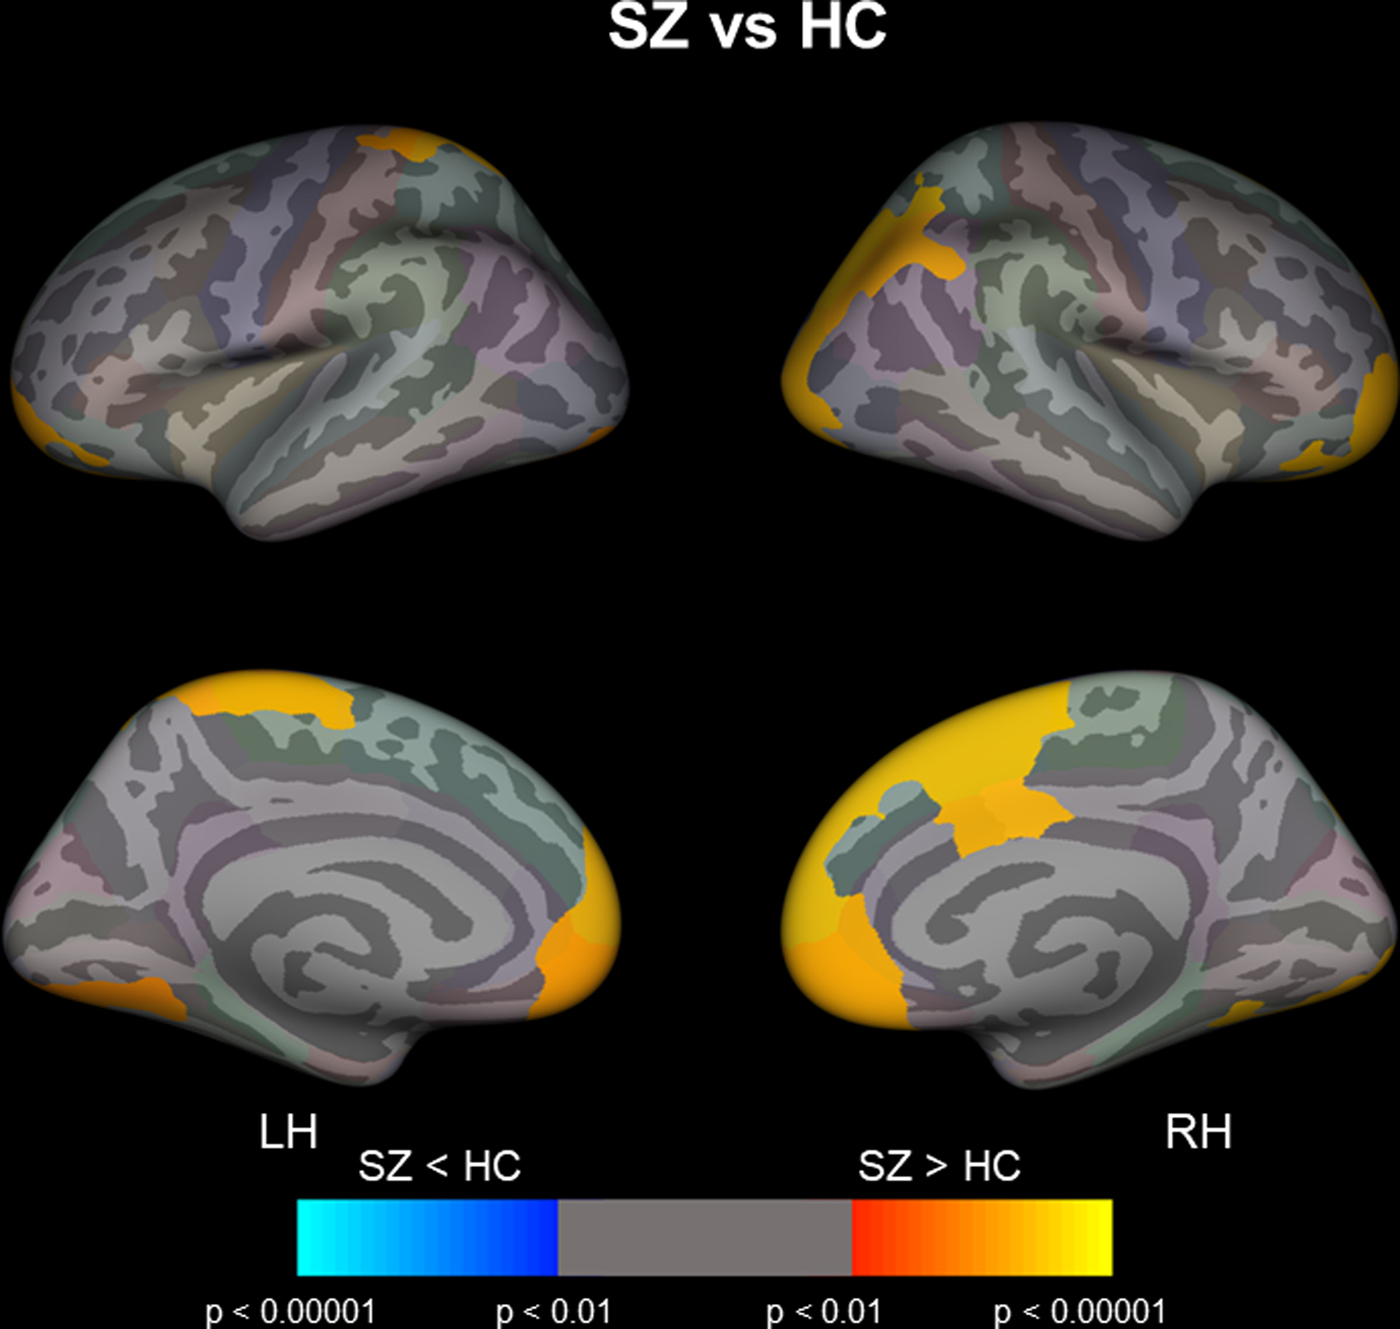
Compared with the controls, SZ patients had a significantly higher LGI in the bilateral superior frontal gyri, bilateral medial and lateral orbitofrontal gyri, bilateral rostral anterior cingulate gyri, left postcentral gyrus, left lingual gyrus, right posterior cingulate gyrus, right inferior parietal lobule and right lateral occipital cortex (Fig. 1, online Supplementary Table S1a).
Cortical statistical maps showing the comparisons of LGI between schizophrenia (SZ) patients and HC. The maps are shown for the right and left hemispheres in lateral (upper) and medial (bottom) views. Horizontal bar shows p values (<0.01, corrected). LH, left hemisphere; RH right hemisphere.

D-SZ v. HC
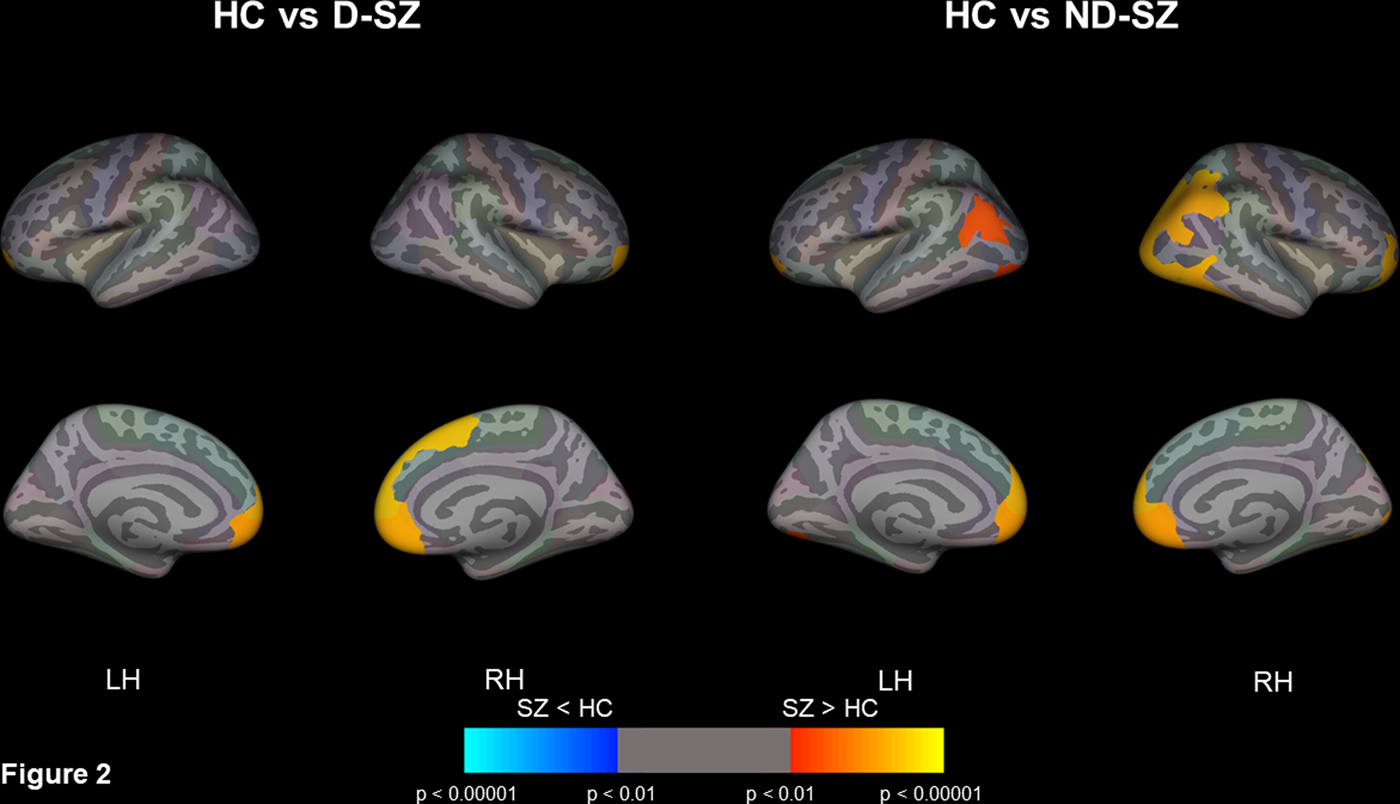
D-SZ had a significantly higher LGI in the bilateral superior frontal gyri, bilateral medial orbitofrontal gyri and right rostral anterior cingulate gyrus than HCs (Fig. 2, online Supplementary Table S2b).
Cortical statistical maps showing the comparisons of LGI between deficit schizophrenia (D-SZ) patients and healthy controls (HC) (left), and non-deficit schizophrenia (ND-SZ) patients and HC (right). The maps are shown for the right and left hemispheres in lateral (upper) and medial (bottom) views. Horizontal bar shows p values (<0.01, corrected). LH, left hemisphere; RH, right hemisphere.

ND-SZ v. HC
ND-SZ patients had a significantly higher LGI in the bilateral superior frontal gyri, bilateral medial orbitofrontal gyri, bilateral inferior parietal lobules, bilateral lateral occipital cortices, right rostral anterior cingulate gyrus, and right lateral orbitofrontal gyrus as compared with HCs (Fig. 2, online Supplementary Table S1c).
D-SZ v. ND-SZ
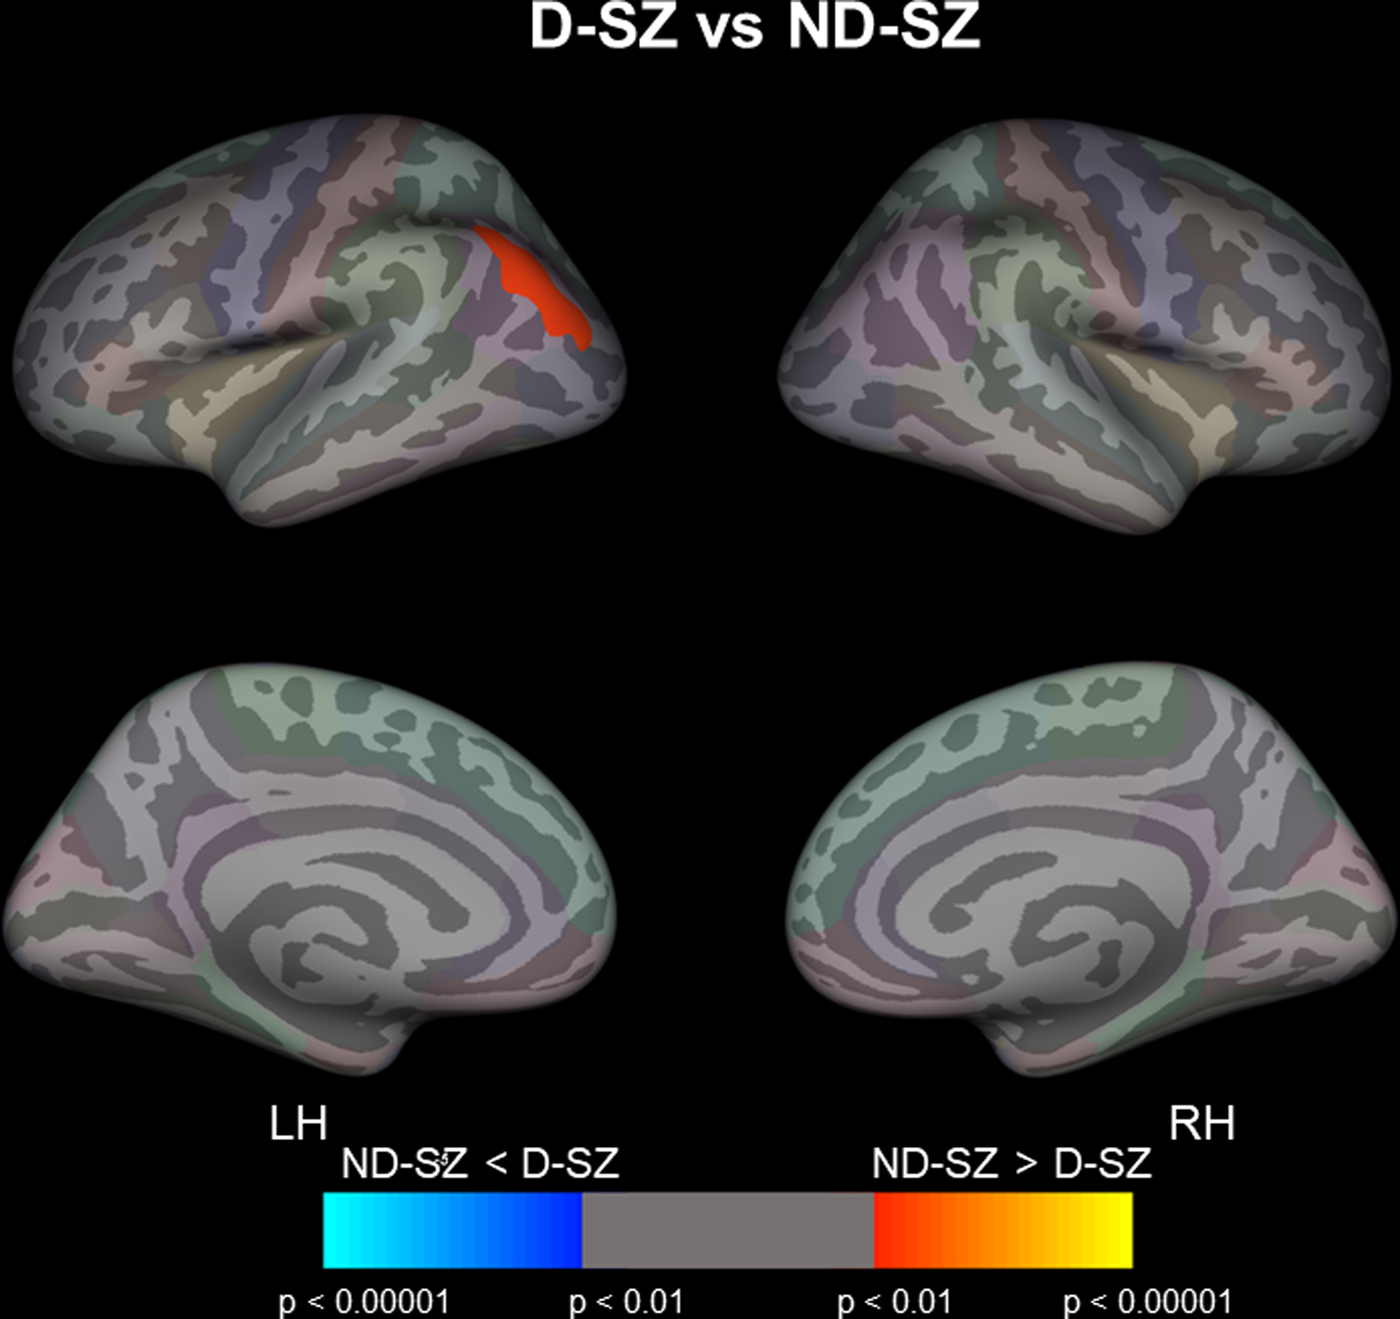
ND-SZ patients exhibited a hyper-gyrification pattern in the left inferior parietal lobule (IPL) as compared with D-SZ (Figs 2 and 3, online Supplementary Table S1d).
Cortical statistical maps displaying the comparison of LGI between deficit schizophrenia (D-SZ) and non-deficit schizophrenia (ND-SZ) patients. The maps are shown for the right and left hemispheres in lateral (upper) and medial (bottom) views. Horizontal bar shows p values (<0.01, corrected). LH, left hemisphere; RH, right hemisphere.

Correlations of LGI with clinical measurements in patients
Duration of illness
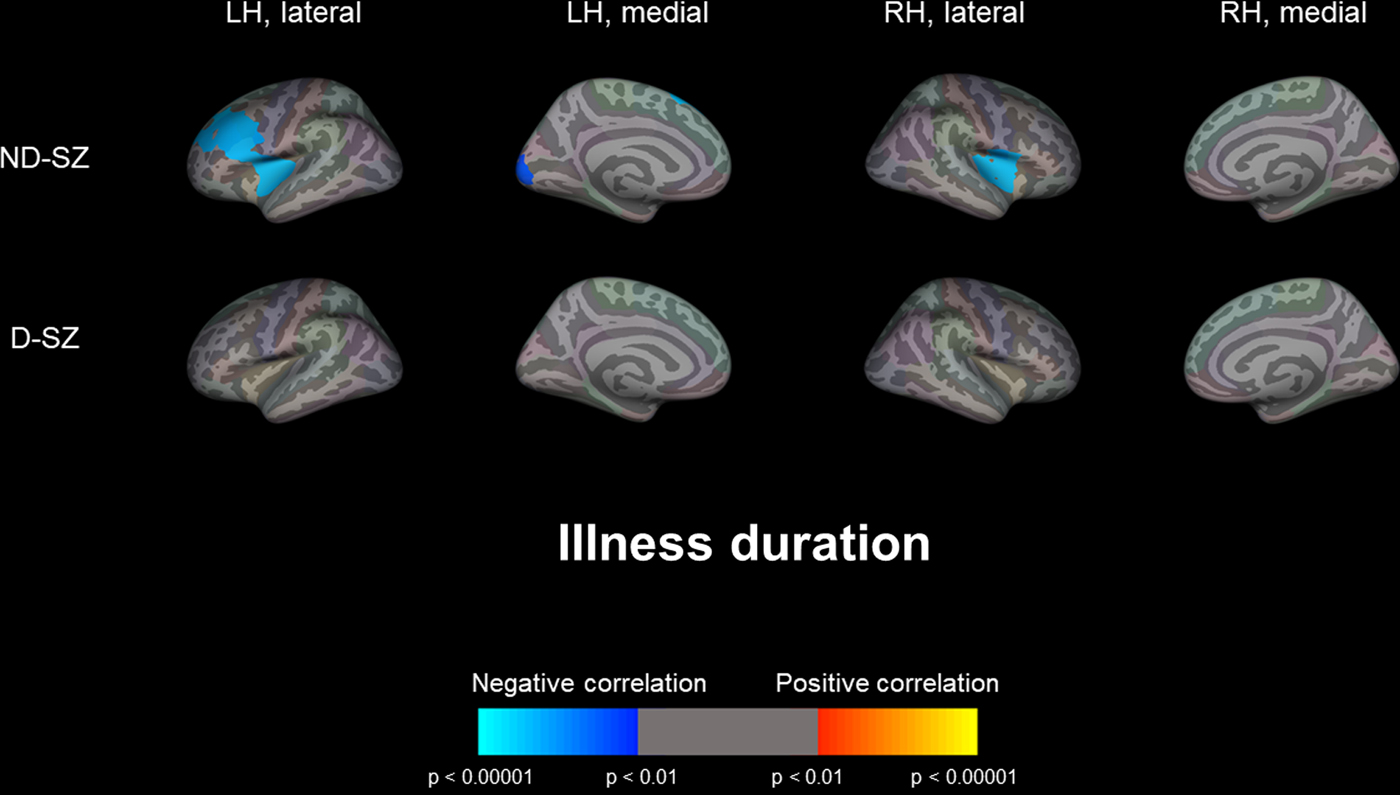
Among ND-SZ subjects, a significant negative correlation between duration of illness and LGI (i.e. longer duration illness is associated with lower LGI) was found in broad cortical regions, including the bilateral insular cortices, left superior frontal gyrus, left middle frontal gyrus, left inferior frontal gyrus and left pericalcarine region (Fig. 4, online Supplementary Table S2b). However, such a negative correlation between the chronicity of illness and LGI was not observed in patients with D-SZ.
Cortical statistical maps displaying the significant correlation of LGI with illness duration in deficit schizophrenia (D-SZ) and non-deficit schizophrenia (ND-SZ) patients. Horizontal bar shows p values (<0.01, corrected). LH, left hemisphere; RH, right hemisphere.

Duration of antipsychotic medication and onset age
In ND-SZ subjects, LGI significantly negatively or positively correlated with duration of antipsychotic medication or onset age, respectively, in the same regions as above (online Supplementary Figs S1, S2 and Table S2b).
Clinical symptoms
SAPS bizarre behavior scores positively correlated with LGI in the left parietal lobule, right lateral and medial orbitofrontal cortices, and in ND-SZ patients (online Supplementary Fig. 3 and Table S2b). Among D-SZ patients, subscales of negative symptoms (i.e. SANS avolition-apathy and anhedonia-asociality) positively correlated with LGI in the right posterior and isthmus cingulate gyri, and right precuneus (online Supplementary Figs 4, 5 and Table S2a).
Discussion
To the best of our knowledge, this is the first study to examine whole-brain gyrification patterns with an automated method, namely LGI, in D-SZ and ND-SZ. Our results demonstrated that patients with SZ exhibit hyper-gyral patterns predominantly in the bilateral dorsal medial prefrontal cortices, bilateral ventromedial prefrontal cortices, bilateral anterior cingulate gyri and right lateral parietal/occipital cortices as compared with HCs. Although patients with D-SZ or ND-SZ had a higher LGI in similar regions compared with HC, the hyper-gyral patters were broader in ND-SZ. Furthermore, the ND-SZ group exhibited a significantly higher LGI in the left IPL as compared with the D-SZ group. Our data suggest that D-SZ and ND-SZ share common and distinct neurodevelopmental anomalies.
In this study, we found a marked difference in the correlation of LGI and chronicity of the illness between D-SZ and ND-SZ (i.e. longer duration of illness was associated with lower LGI only in ND-SZ). The negative association between LGI and duration of illness in SZ patients has already been reported (Schultz et al., Reference Schultz2010; Nesvag et al., Reference Nesvag2014; Sasabayashi et al., Reference Sasabayashi2017), suggestive of the progressive reduction in LGI in SZ. Indeed, one longitudinal study reported a reduction in LGI over time in SZ (Palaniyappan et al., Reference Palaniyappan2013). Our data suggest that although the degree of gyrification progressively changes in ND-SZ patients, such dynamic change is lacking in individuals with D-SZ. The negative correlation of LGI with duration of antipsychotic medication and the positive correlation between LGI and onset age in ND-SZ patients also suggest that LGI is inversely associated with the chronicity of illness in ND-SZ.
The gyrification patterns may reflect the underlying connective characteristics of cortical regions (Toro and Burnod Reference Toro and Burnod2005; Tallinen et al., Reference Tallinen2014). As results from diffusion tensor imaging studies (Kanaan et al., Reference Kanaan2005) and functional MRI studies (Lawrie et al., Reference Lawrie2002; Honey et al., Reference Honey2005) support the functional disconnectivity in SZ, our findings (i.e. hyper-gyria in SZ) suggest that the neurodevelopmental processes associated with cortical connections are involved in the pathophysiology of SZ. In addition, the different gyrification patterns observed between D-SZ and ND-SZ may have some relation to a recent network-based analysis of cortical thickness that found enhanced fronto-parietal coupling in deficit schizophrenia because this likely reflects reduced network formation during early neurodevelopment (Wheeler et al., Reference Wheeler2015).
As lower LGI was correlated with illness duration in ND-SZ, it is possible that the LGI difference between D-SZ and ND-SZ was due to the difference in the distribution of FEP in each group. However, the distributions of FEP among D-SZ and ND-SZ were similar (49% and 44%, respectively). We also compared LGI between D-SZ and ND-SZ adjusting for age, gender and FEP. This comparison adjusting for FEP replicated the primary analysis (data not shown). Therefore, the LGI difference between D-SZ and ND-SZ is not merely due to a group effect of FEP.
To clarify the relationships between LGI and surface area/cortical thickness, we calculated Pearson's r within 68 automatically-segmented ROIs (Desikan et al., Reference Desikan2006). As expected, LGI consistently positively correlated with surface area. On the other hand, cortical thickness was inversely correlated with LGI in many ROIs (online Supplementary Table S3). Therefore, increased LGI may partly be explained by increased surface area and decreased cortical thickness.
Although the gross cortical folding pattern is formed mainly during gestation and is relatively stable (Armstrong et al., Reference Armstrong1995; Zilles et al., Reference Zilles, Palomero-Gallagher and Amunts2013), our findings support past studies that demonstrated that the degree of gyrification can be altered by factors such as aging or chronicity of illness. For example, cortical thinning (e.g. due to aging) results in changes in sulcal width and depth, which can alter the degree of gyrification (Kochunov et al., Reference Kochunov2005). Indeed, we found inverse associations between cortical thickness and LGI in many cortical regions. Therefore, although cortical folding patterns remain stable, the degree of gyrification can be altered by environmental factors.
Our findings are consistent with previous MRI (Narr et al., Reference Narr2004; Falkai et al., Reference Falkai2007; Harris et al., Reference Harris2007; Tepest et al., Reference Tepest2013) and postmortem (Vogeley et al., Reference Vogeley2000) studies, which demonstrated frontal hyper-gyria in SZ patients. We also replicated the findings of our earlier study that only included FEP in terms of hyper-gyrification pattern predominantly in the prefrontal cortex in patients with SZ (Sasabayashi et al., Reference Sasabayashi2017). However, the results of several MRI studies which demonstrated hypo-gyria in chronic schizophrenia patients (Palaniyappan et al., Reference Palaniyappan2011; Nesvag et al., Reference Nesvag2014) conflict with our study. It has been reported that LGI positively correlates with gray matter volume in healthy subjects (Gautam et al., Reference Gautam2015). In addition, chronicity affects LGI in prefrontal (Palaniyappan et al., Reference Palaniyappan2013), temporal (Schultz et al., Reference Schultz2010) and parietal/pericentral regions (Nesvag et al., Reference Nesvag2014) (i.e. longer duration of illness correlates with a reduction in LGI). Past studies that included only FEP reported hyper-gyrification patterns in SZ (Narr et al., Reference Narr2004; Schultz et al., Reference Schultz2010; Tepest et al., Reference Tepest2013; Sasabayashi et al., Reference Sasabayashi2017). Approximately 50% of patients included in these studies were those with first-episode SZ, and both D-SZ and ND-SZ patients were relatively young and had a shorter illness duration. Our current and previous studies (Sasabayashi et al., Reference Sasabayashi2017) also suggest that the usage of antipsychotics may be associated with decreased LGI. Thus, several factors, including the difference in illness chronicity or usage of antipsychotic medication, may be related to conflicting findings among studies examining the gyrification index in SZ patients.
In this study, the gyrification pattern in the left inferior parietal lobule (IPL) differentiated D-SZ from ND-SZ. As reviewed by Torrey (Reference Torrey2007), several IPL functions may be impaired in patients with SZ, including sensory integration, body image, concept of self, and executive function. Among patients with SZ, impairments in these functions may be related to perceptual dysfunction/thought blocking/loosening of association, right-left disorientation, ‘first-rank symptoms (FRS)’ originally described by Schneider (Reference Schneider1959) and executive dysfunction, respectively (Torrey, Reference Torrey2007). Indeed, we found a positive correlation between positive symptoms (i.e. bizarre behavior) and LGI in the left parietal lobule in ND-SZ. Thus, aberrant gyrification in the IPL may be related with more prominent positive symptoms in ND-SZ.
Among D-SZ subjects, we found positive correlations between SANS subdomain scores (i.e. avolition-apathy and anhedonia-asociality) and LGI in several regions, including the right posterior cingulate gyrus and right precuneus cortex, which are thought to be involved in the ‘default mode network (DMN)’ (Andrews-Hanna et al., Reference Andrews-Hanna, Smallwood and Spreng2014). Functional imaging studies suggest that DMN function may be associated with anhedonia in patients with SZ (Reviewed by Lee et al. Reference Lee2015). In addition, a recent functional MRI study revealed a negative correlation of the severity of avolition/apathy with brain functional activity in the regions involved in DMN (Shaffer et al., Reference Shaffer2015). Hence, structural and functional alterations of DMN may be related with some components of negative symptoms in D-SZ.
Although not statistically significant (p = 0.06), the proportion of males was higher in D-SZ (57%) than in ND-SZ (33%). A highly significant association between male gender and deficit schizophrenia has been well reported (Roy et al., Reference Roy2001).
Other than dividing SZ patients into D-SZ and ND-SZ, the subgrouping of Kraepelinian and non-Kraepelinian SZ has also been well established (Keefe et al., Reference Keefe1996). However, many of our SZ subjects had relatively short illness durations, which made it difficult to evaluate if the patient met the criteria for Kraepelinian SZ.
Although we used PDS (Kirkpatrick et al., Reference Kirkpatrick1993), which is a reliable method that several researchers have employed PDS to identify D-SZ and ND-SZ patients (Cohen and Docherty, Reference Cohen and Docherty2004; Messias et al., Reference Messias2004; Strauss et al., Reference Strauss2010; Voineskos et al., Reference Voineskos2013; Wheeler et al., Reference Wheeler2015; Fervaha et al., Reference Fervaha2016), the gold standard for the identification of deficit syndrome is the Schedule for the Deficit Syndrome (Kirkpatrick et al., Reference Kirkpatrick1989) based on a semi-structured interview. In addition, we were unable to test the stability of categorization based on PDS as we did not have the follow-up data including BPRS.
In conclusion, our results suggest that D-SZ and ND-SZ have both common and distinct neurodevelopmental abnormalities. The difference in the degree of gyrification found in the left parietal lobule and the distinct correlation of the chronicity of illness with LGI may be related to the different clinical manifestations among D-SZ and ND-SZ.
Supplementary material
The supplementary material for this article can be found at https://doi.org/10.1017/S0033291718001228
Acknowledgements
This work was supported by grants to Y.T. (Kiban C No. 26461738), T.T. (Kiban C No. 26461739), and M.S. (Kiban B No. 24390281) from the Japanese Society for the Promotion of Science, and Health and Labour Sciences, and Research Grants for Comprehensive Research on Persons with Disabilities from the Japan Agency for Medical Research and Development (AMED) to M.S. Y.T. was also supported by grants from SENSHIN Medical Research Foundation.