1 Introduction
Laminar–turbulent transition of boundary-layer flows can have a strong impact on the performance of hypersonic vehicles because of its influence on the surface skin friction and aerodynamic heating. Therefore, the prediction and control of transition onset and the associated variation in aerothermodynamic parameters in high-speed flows is a key issue for optimizing the performance of the next-generation aerospace vehicles.
Under low levels of background disturbances, transition is initiated by the exponential amplification of linearly unstable eigenmodes, i.e. modal instabilities of the laminar boundary layer. In two-dimensional boundary layers, different instability mechanisms dominate the exponential growth phase depending on the flight speed. Planar, i.e. two-dimensional, Tollmien–Schlichting (TS) waves are the most unstable in the incompressible regime, whereas oblique first-mode instabilities correspond to the most amplified disturbances in supersonic boundary layers. The hypersonic regime is again dominated by the growth of planar acoustic waves of the second mode, i.e. Mack-mode type (Mack Reference Mack1984). In the presence of sufficiently strong external disturbances in the form of either free-stream turbulence (FST) or three-dimensional wall roughness, streamwise streaks involving alternately low and high streamwise velocity have been observed to appear in incompressible boundary layers (Klebanoff Reference Klebanoff1971; Vermeersch & Arnal Reference Vermeersch and Arnal2010). Further research in the incompressible regime has shown that high-amplitude streaks can become unstable to shear layer instabilities that lead to a form of ‘bypass transition’ (Andersson et al. Reference Andersson, Brandt, Bottaro and Henningson2001). When the streak amplitudes are low enough to avoid these instabilities, i.e. when the background disturbance level is moderate, the streaks can actually reduce the growth of the TS waves as documented in both theoretical and experimental studies (Boiko et al. Reference Boiko, Westin, Klingmann, Kozlov and Alfredsson1994; Cossu & Brandt Reference Cossu and Brandt2002; Bagheri & Hanifi Reference Bagheri and Hanifi2007). The stabilizing effect of stationary streaks in low-speed boundary layers have been used in passive flow control strategies to demonstrate delayed onset of transition by using micro vortex generators (MVGs) along the body surface (Fransson et al. Reference Fransson, Talamelli, Brandt and Cossu2006; Shahinfar et al. Reference Shahinfar, Sattarzadeh, Fransson and Talamelli2012).
Despite the numerous research efforts focused on tripping hypersonic boundary-layer flows by using roughness elements, there have been a few experimental and numerical studies reporting a delay in transition under certain circumstances. Most of these studies used two-dimensional roughness elements. James (Reference James1959) used fin-stabilized hollow tube models in free flight with a screw-thread type of distributed two-dimensional roughness. He found that for a given free-stream Mach number in the range of 2.8–7, there exists an optimum roughness height for transition delay. Fujii (Reference Fujii2006) studied the effects of two-dimensional roughness by using a
 $5^{\circ }$
half-angle sharp cone at a free-stream Mach number of
 $7.1$
. He also observed transition delay for certain conditions when the wavelength of the wavy wall roughness was comparable to that of the Mack-mode instabilities. More recently, Fong, Wang & Zhong (Reference Fong, Wang and Zhong2014), Fong et al. (Reference Fong, Wang, Huang, Zhong, McKiernan, Fisher and Schneider2015) performed numerical and experimental studies, respectively, that were focused on the effect of two-dimensional surface roughness on the stability of a hypersonic boundary layer at a free-stream Mach number of
 $6$
. The experiments (Fong et al.
Reference Fong, Wang, Huang, Zhong, McKiernan, Fisher and Schneider2015) used a flared cone with strips of roughness in the Boeing/AFOSR Mach 6 Quiet Tunnel and supported the numerical predictions indicating a stabilizing influence on the amplification of Mack-mode disturbances (Fong et al.
Reference Fong, Wang and Zhong2014). In particular, these studies showed that the most dominant Mack-mode instability could be suppressed via judicious placement of the roughness elements along the surface of the cone. Among the limited experimental evidence of delayed transition in a hypersonic boundary layer and in the presence of three-dimensional roughness elements is the study by Holloway & Sterrett (Reference Holloway and Sterrett1964), who used a single row of spherical roughness elements partially recessed within a flat plate model in the NASA Langley 20-in. Mach 6 tunnel. Data for multiple boundary-layer-edge Mach numbers were obtained by varying the plate mounting angle. They found that, for cases with the smallest roughness diameters, transition was delayed for edge Mach numbers larger than
 $3.7$
, which approximately corresponds to the lower bound for second-mode dominance over first-mode instabilities in a flat plate boundary layer at typical wind tunnel conditions. Therefore, their results are suggestive of a stabilizing influence of roughness-induced streaks on Mack-mode waves. When the roughness height becomes sufficiently large, the streaks can develop high-frequency instabilities that can lead to earlier transition (Choudhari, Li & Edwards Reference Choudhari, Li and Edwards2009; Paredes et al.
Reference Paredes, De Tullio, Sandham, Theofilis, Theofilis and Soria2015a
) as found by Holloway & Sterrett (Reference Holloway and Sterrett1964).
Theoretical studies of the interaction between stationary disturbances and Mack-mode instabilities in hypersonic boundary layers have been recently initiated. Li et al. (Reference Li, Choudhari, Chang, Greene and Wu2010) studied the interaction of Görtler vortices with Mack-mode instabilities on a flared cone, demonstrating a possible route to transition via this interaction. Li et al. (Reference Li, Choudhari, Paredes and Duan2015b
) studied the secondary instability of cross-flow vortices in a hypersonic cone at angle of attack and found that nonlinearly saturated cross-flow vortices destabilize the Mack modes, which dominate the transition onset over the intrinsic secondary instabilities of the cross-flow vortices (Choudhari et al.
Reference Choudhari, Li, Paredes and Duan2017, Reference Choudhari, Li, Paredes and Duan2018). Ren, Fu & Hanifi (Reference Ren, Fu and Hanifi2016) studied the stabilizing effect of weakly nonlinear suboptimal streaks and Görtler vortices on the planar first-mode and Mack-mode instabilities. They documented a slight reduction in the logarithmic amplification factor of approximately
 $\unicode[STIX]{x0394}N=0.2$
relative to the baseline, zero-streaks flat plate boundary layer. Furthermore, Paredes, Choudhari & Li (Reference Paredes, Choudhari and Li2016b
, Reference Paredes, Choudhari and Li2017b
) have demonstrated that finite-amplitude optimal streaks can substantially damp planar Mack-mode instabilities in the hypersonic flow over a circular cone at zero angle of attack and ground test conditions, although oblique first-mode instabilities are destabilized.
The development of roughness-induced streaks is strongly dependent on the details of roughness element shape, height and spanwise or azimuthal spacing. A conceptually simple model that can characterize as well as provide an upper bound on the transient algebraic growth and subsequent slow decay of boundary-layer streaks due to arbitrary initial disturbances is the optimal growth theory; see Schmid (Reference Schmid2007) for a review. The transient growth arises as a result of the non-normality of disturbance equations, and the optimal growth theory seeks to maximize the disturbance growth between a selected pair of streamwise locations. Regardless of the flow Mach number, the disturbances experiencing the highest magnitude of transient growth have been found to be stationary streaks that arise from initial perturbations that correspond to streamwise vortices. The instabilities of optimal streaks with finite initial amplitudes in supersonic and hypersonic boundary layers has been recently addressed by Paredes, Choudhari & Li (Reference Paredes, Choudhari and Li2016a
,Reference Paredes, Choudhari and Li
c
, Reference Paredes, Choudhari and Li2017c
). Furthermore, Paredes, Choudhari & Li (Reference Paredes, Choudhari and Li2017a
) investigated the interaction of nonlinear stationary optimal growth perturbations with modally unstable instability waves in a Mach
 $3$
adiabatic flat-plate boundary-layer flow. At the selected conditions, the most-amplified linear waves correspond to the oblique, first-mode waves. The analysis showed that optimally growing stationary streaks can destabilize the first-mode waves, but only when the spanwise wavelength of the instability waves is equal to or smaller than twice the streak spacing. Thus, as long as the amplification factors for the destabilized, short wavelength instability waves remain below the threshold level for transition, a significant net stabilization is achieved. On the other hand, the effect of nonlinear stationary streaks on the growth of Mack-mode instabilities has not been studied as yet. The present work seeks to bridge this gap with the goal of developing a more thorough knowledge base for transition prediction in the presence of stationary streaks and potentially expand the range of available techniques for transition control at hypersonic flight Mach number conditions.
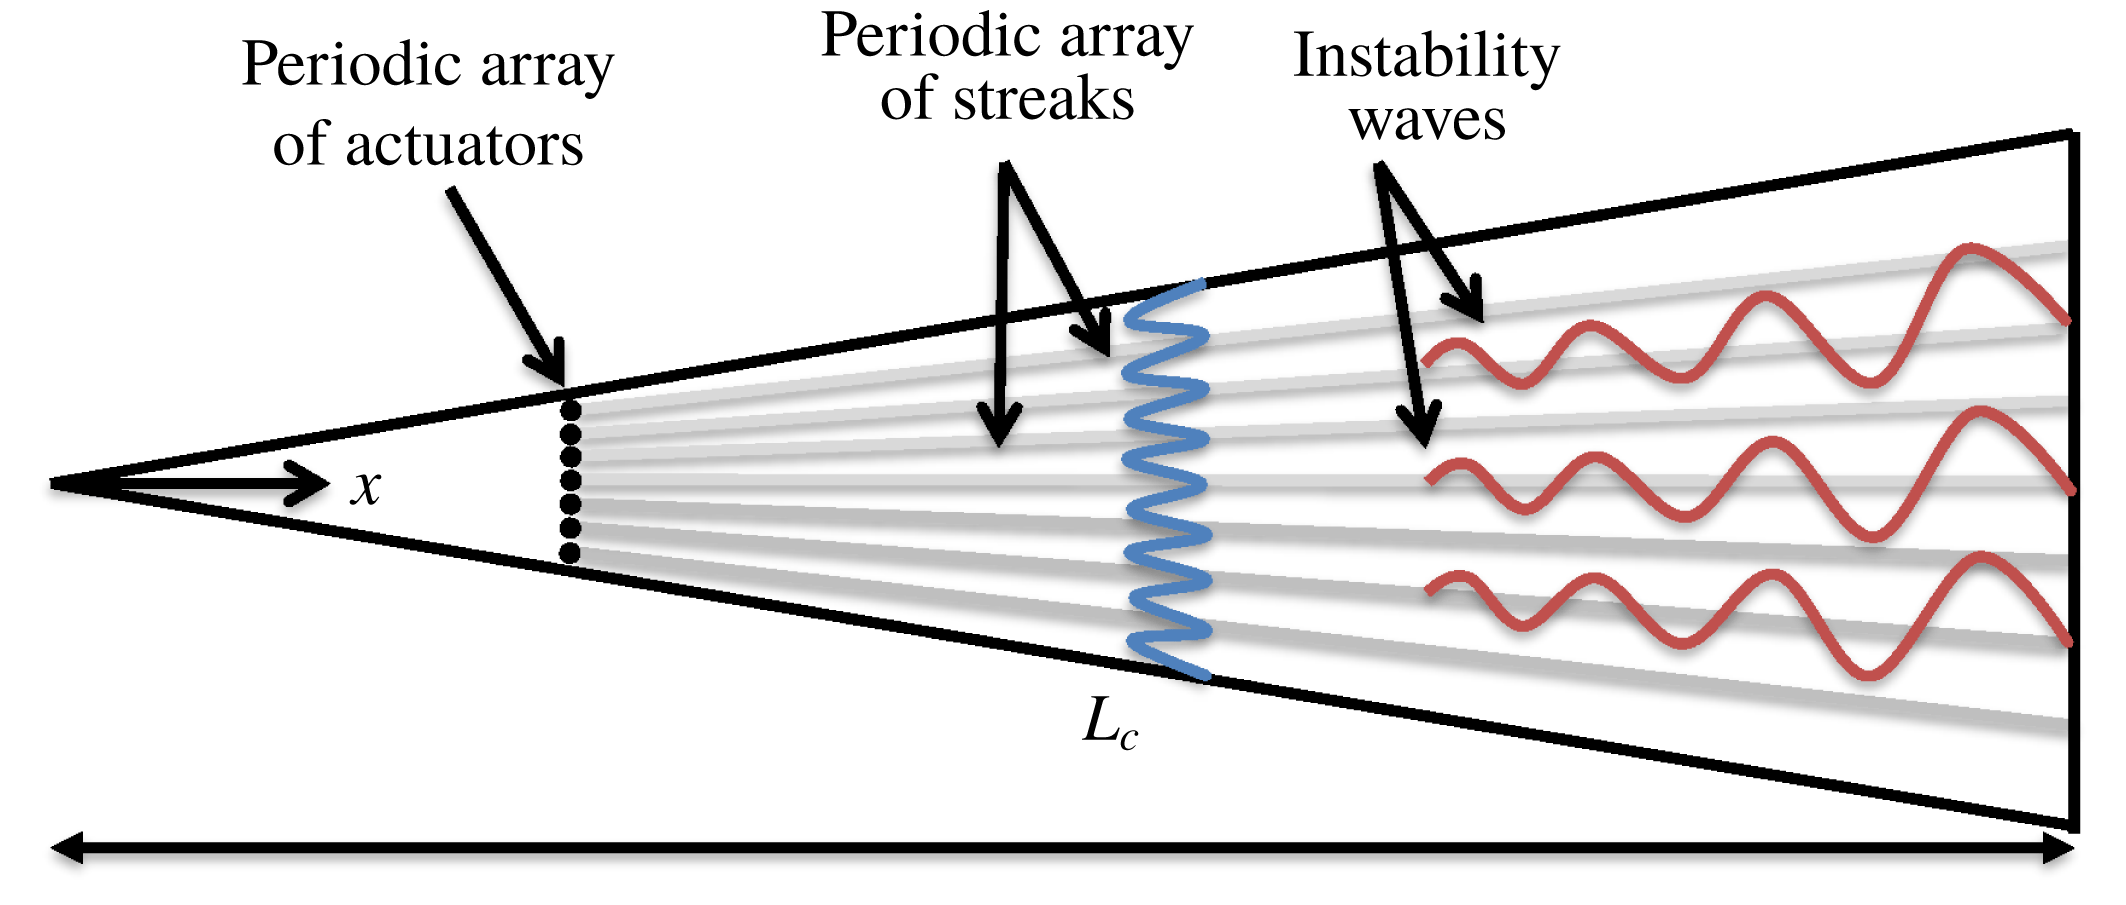
To that end, we study the effect of a periodic array of finite-amplitude streaks on the dominant instability waves in axisymmetric or two-dimensional boundary layers at hypersonic Mach numbers, i.e. the Mack-mode instabilities. Figure 1 shows a schematic of the flow configuration considered in this work. The geometry is a
 $7^{\circ }$
half-angle circular cone with
 $r_{n}=2.5$
mm nose radius and
 $L_{c}=2.0$
m length. The free-stream parameters, i.e. Mach
 $5.30$
flow with a unit Reynolds number of
 $Re^{\prime }=13.42\times 10^{6}~\text{m}^{-1}$
and free-stream temperature of
 $T_{\infty }=201.4~\text{K}$
, are selected to match the flow conditions of the HIFiRE-1 flight experiment during the ascent phase at time equal to
 $21.5$
s (Kimmel et al.
Reference Kimmel, Adamczak, Paull, Paull, Shannon, Pietsch, Frost and Alesi2015). Even though this Mach number may be somewhat lower than the typical Mach number range associated with the hypersonic regime, the underlying flow exhibits the same instability characteristics as the higher Mach number boundary layers. The laminar boundary-layer flow over the cone is computed by solving the full Navier–Stokes equations. The good correlation between experimental measurements and theoretical predictions based on the parabolized stability equations (PSE) has confirmed that laminar–turbulent transition in this flow is driven by the modal growth of planar Mack-mode instabilities (Li et al.
Reference Li, Choudhari, Chang, Kimmel, Adamczak and Smith2015a
). The analysis presented herein is based on boundary-layer streaks resulting from the transient growth of an optimal initial perturbation. The perturbed three-dimensional boundary layer is used as a basic state for the subsequent modal instability analysis by means of the plane-marching PSE.
Sketch (side view) of the cone illustrating the present conceptual configuration. The wake of the periodic array of actuators generates the periodic array of streaks that modulate the instability waves.
The paper is organized as follows. Section 2 provides a summary of the transient growth framework and the plane-marching PSE. The results are presented in § 3. First, the perturbed three-dimensional boundary layer composed of the two-dimensional boundary layer plus a finite-amplitude optimal growth perturbation is analysed by using the stationary from of the plane-marching PSE. Subsequently, the plane-marching PSE are used to examine the instability characteristics of the Mack-mode waves as well as the streak instabilities of the modified basic states. The effect of the streak azimuthal wavelength on the net stabilization of the Mack-mode waves is also studied in § 3. Finally, summary and concluding remarks are presented in § 4.
2 Theory
This section introduces the methodologies used in this paper. The procedure closely follows the study of Paredes et al. (Reference Paredes, Choudhari and Li2017a ) that analysed the interactions of the oblique first-mode waves and finite-amplitude optimal streaks in a supersonic boundary layer. In brief, the analysis begins with the identification of the linearly optimal perturbation that results in maximum energy gain. The latter is then used as inflow disturbance for the parabolic integration of the stationary, nonlinear, plane-marching PSE to obtain a three-dimensional, azimuthally periodic, perturbed boundary-layer flow. Subsequently, the modal instability characteristics of this perturbed three-dimensional boundary-layer flow are studied by using the linear form of time harmonic, plane-marching PSE.
2.1 Linear optimal growth
Linear transient growth analysis is performed using the linear PSE as explained by Pralits et al. (Reference Pralits, Airiau, Hanifi and Henningson2000) and Paredes et al. (Reference Paredes, Choudhari, Li and Chang2016d ). In the PSE context, the perturbations have the form
 $$\begin{eqnarray}\tilde{\boldsymbol{q}}(\unicode[STIX]{x1D709},\unicode[STIX]{x1D702},\unicode[STIX]{x1D701},t)=\hat{\boldsymbol{q}}(\unicode[STIX]{x1D709},\unicode[STIX]{x1D702})\exp \left[\text{i}\left(\int _{\unicode[STIX]{x1D709}_{0}}^{\unicode[STIX]{x1D709}}\unicode[STIX]{x1D6FC}(\unicode[STIX]{x1D709}^{\prime })\,\text{d}\unicode[STIX]{x1D709}^{\prime }+m\unicode[STIX]{x1D701}-\unicode[STIX]{x1D714}t\right)\right]\!.\end{eqnarray}$$
The suitably non-dimensionalized, orthogonal, curvilinear coordinate system
 $(\unicode[STIX]{x1D709},\unicode[STIX]{x1D702},\unicode[STIX]{x1D701})$
denotes streamwise, wall-normal and azimuthal coordinates and
 $(u,v,w)$
represent the corresponding velocity components. Density and temperature are denoted by
 $\unicode[STIX]{x1D70C}$
and
 $T$
. The Cartesian coordinates are represented by
 $(x,y,z)$
. The vector of perturbation fluid variables is
 $\tilde{\boldsymbol{q}}(\unicode[STIX]{x1D709},\unicode[STIX]{x1D702},\unicode[STIX]{x1D701},t)=(\tilde{\unicode[STIX]{x1D70C}},\tilde{u} ,\tilde{v},\tilde{w},\tilde{T})^{\text{T}}$
, the vector of amplitude functions is
 $\hat{\boldsymbol{q}}(\unicode[STIX]{x1D709},\unicode[STIX]{x1D702})=(\hat{\unicode[STIX]{x1D70C}},\hat{u} ,\hat{v},{\hat{w}},\hat{T})^{\text{T}}$
and the vector of basic state fluid variables is
 $\bar{\boldsymbol{q}}(\unicode[STIX]{x1D709},\unicode[STIX]{x1D702})=(\bar{\unicode[STIX]{x1D70C}},\bar{u},\bar{v},\bar{w},\bar{T})^{\text{T}}$
. The streamwise and azimuthal wavenumbers are
 $\unicode[STIX]{x1D6FC}$
and
 $m$
, respectively; and
 $\unicode[STIX]{x1D714}$
is the angular frequency of the perturbation. The azimuthal wavelength is defined as
 $\unicode[STIX]{x1D706}=2\unicode[STIX]{x03C0}/m$
.
The optimal initial disturbance,
 $\tilde{\boldsymbol{q}}_{0}$
, is defined as the initial (i.e. inflow) condition at
 $\unicode[STIX]{x1D709}_{0}$
that yields a maximum objective function,
 $J(\tilde{\boldsymbol{q}})$
. The objective function is defined as the energy gain of the perturbation up to a specified position,
 $\unicode[STIX]{x1D709}_{1}$
. Herein, we use the mean energy gain,
 $$\begin{eqnarray}G=\frac{1}{\unicode[STIX]{x1D709}_{1}-\unicode[STIX]{x1D709}_{0}}\frac{\displaystyle \int _{\unicode[STIX]{x1D709}_{0}}^{\unicode[STIX]{x1D709}_{1}}E(\unicode[STIX]{x1D709}^{\prime })\,\text{d}\unicode[STIX]{x1D709}^{\prime }}{E(\unicode[STIX]{x1D709}_{0})},\end{eqnarray}$$
where
 $E$
denotes the energy norm of
 $\tilde{\boldsymbol{q}}$
. The energy norm is defined as
 $$\begin{eqnarray}E(\unicode[STIX]{x1D709})=\frac{1}{\unicode[STIX]{x1D706}}\int _{\unicode[STIX]{x1D701}}\int _{\unicode[STIX]{x1D702}}\tilde{\boldsymbol{q}}(\unicode[STIX]{x1D709},\unicode[STIX]{x1D702},\unicode[STIX]{x1D701})^{H}\unicode[STIX]{x1D648}\tilde{\boldsymbol{q}}(\unicode[STIX]{x1D709},\unicode[STIX]{x1D702},\unicode[STIX]{x1D701})\,h_{\unicode[STIX]{x1D709}}\,h_{\unicode[STIX]{x1D701}}\,\text{d}\unicode[STIX]{x1D702}\,\text{d}\unicode[STIX]{x1D701},\end{eqnarray}$$
where
 $h_{\unicode[STIX]{x1D709}}$
and
 $h_{\unicode[STIX]{x1D701}}$
are the metric factors associated with the streamwise and azimuthal curvatures, respectively,
 $\unicode[STIX]{x1D648}$
is the energy weight matrix and the superscript
 $H$
denotes conjugate transpose. The positive–definite energy norm used here was derived by Chu (Reference Chu1956) and used by Mack (Reference Mack1969) and Hanifi, Schmid & Henningson (Reference Hanifi, Schmid and Henningson1996) for linear stability theory. This energy norm is defined as
 $$\begin{eqnarray}\unicode[STIX]{x1D648}=\text{diag}\left[\frac{\bar{T}(\unicode[STIX]{x1D709},\unicode[STIX]{x1D702})}{\unicode[STIX]{x1D6FE}\bar{\unicode[STIX]{x1D70C}}(\unicode[STIX]{x1D709},\unicode[STIX]{x1D702})M^{2}},\bar{\unicode[STIX]{x1D70C}}(\unicode[STIX]{x1D709},\unicode[STIX]{x1D702}),\bar{\unicode[STIX]{x1D70C}}(\unicode[STIX]{x1D709},\unicode[STIX]{x1D702}),\bar{\unicode[STIX]{x1D70C}}(\unicode[STIX]{x1D709},\unicode[STIX]{x1D702}),\frac{\bar{\unicode[STIX]{x1D70C}}(\unicode[STIX]{x1D709},\unicode[STIX]{x1D702})}{\unicode[STIX]{x1D6FE}(\unicode[STIX]{x1D6FE}-1)\bar{T}(\unicode[STIX]{x1D709},\unicode[STIX]{x1D702})M^{2}}\right]\!.\end{eqnarray}$$
The variational formulation of the problem to determine the maximum of the objective functional
 $J=G$
leads to an optimality system (Pralits et al.
Reference Pralits, Airiau, Hanifi and Henningson2000; Tumin & Reshotko Reference Tumin and Reshotko2003; Zuccher, Tumin & Reshotko Reference Zuccher, Tumin and Reshotko2006), which is solved in an iterative manner starting from a random solution at
 $\unicode[STIX]{x1D709}_{0}$
that must satisfy the boundary conditions. Summarizing, the linear PSE,
 $\unicode[STIX]{x1D647}\tilde{\boldsymbol{q}}=0$
, are used to integrate
 $\tilde{\boldsymbol{q}}$
up to
 $\unicode[STIX]{x1D709}_{1}$
, where the final optimality condition is used to obtain the initial condition for the backward adjoint PSE integration. At
 $\unicode[STIX]{x1D709}_{0}$
, the adjoint solution is used to calculate the new initial condition for the forward PSE integration with the initial optimality condition. The iterative procedure finishes when the value of
 $J$
has converged up to a certain tolerance, which was set to a relative error of
 $10^{-6}$
in the present computations.
2.2 Plane-marching PSE
The nonlinear evolution of the stationary, finite-amplitude streaks is solved using an implicit formulation of the nonlinear plane-marching PSE (Paredes et al. Reference Paredes, Hanifi, Theofilis and Henningson2015b , Reference Paredes, Choudhari and Li2016c , Reference Paredes, Choudhari and Li2017a ). Subsequently, the linear form of the plane-marching PSE is used to study the linear, non-parallel stability characteristics of the modified basic state corresponding to the sum of the circular cone boundary layer and the finite-amplitude optimal disturbance. The initial disturbance profiles for the plane-marching PSE are obtained using a partial-differential-equation (PDE) based two-dimensional eigenvalue problem (EVP). In the plane-marching PSE context, the perturbations to the streak have the form
 $$\begin{eqnarray}\tilde{\boldsymbol{q}}(\unicode[STIX]{x1D709},\unicode[STIX]{x1D702},\unicode[STIX]{x1D701},t)=\hat{\boldsymbol{q}}(\unicode[STIX]{x1D709},\unicode[STIX]{x1D702},\unicode[STIX]{x1D701})\exp \left[\text{i}\left(\int _{\unicode[STIX]{x1D709}_{0}}^{\unicode[STIX]{x1D709}}\unicode[STIX]{x1D6FC}(\unicode[STIX]{x1D709}^{\prime })\,\text{d}\unicode[STIX]{x1D709}^{\prime }-\unicode[STIX]{x1D714}t\right)\right]\!.\end{eqnarray}$$
Substituting (2.5) into the Navier–Stokes (NS) equations, and neglecting the viscous streamwise derivatives of the slowly varying amplitude function
 $\hat{\boldsymbol{q}}$
, the plane-marching PSE can be written in a compact form as
 $$\begin{eqnarray}\left(\unicode[STIX]{x1D647}_{n}+\unicode[STIX]{x1D648}_{n}\frac{\unicode[STIX]{x2202}}{\unicode[STIX]{x2202}x}\right)\hat{\boldsymbol{q}}_{n}(x,y,z)=\boldsymbol{F}_{n}(x,y,z)\exp \left(-\text{i}\int _{x_{0}}^{x}\unicode[STIX]{x1D6FC}_{n}(x^{\prime })\,\text{d}x^{\prime }\right)\!,\end{eqnarray}$$
where
 $\boldsymbol{F}_{n}$
is the Fourier component of the total forcing
 $\boldsymbol{F}$
that contains the nonlinear terms. The entries of the coefficient matrices for
 $\unicode[STIX]{x1D647}_{n}$
and
 $\unicode[STIX]{x1D648}_{n}$
and vector
 $\boldsymbol{F}$
are found in Paredes (Reference Paredes2014) and Paredes et al. (Reference Paredes, Choudhari and Li2017a
).
The PSE system of equations is not fully parabolic due to the streamwise pressure gradient term in the streamwise momentum equation (Li & Malik Reference Li and Malik1996, Reference Li and Malik1997). However, the minimum step size requirement is met for all the results presented herein and no special treatment to the equations was required to achieve results that are insensitive to the size of the marching step.
To follow the development of finite-amplitude optimal disturbances (i.e. streaks), the nonlinear formulation of the plane-marching PSE is used (Paredes et al.
Reference Paredes, Hanifi, Theofilis and Henningson2015b
). For the stationary disturbances of interest in this paper,
 $N=0$
and
 $\unicode[STIX]{x1D6FC}_{0}=0$
. Because of this, a single mode is integrated by using an implicit formulation to facilitate the convergence of the solution for moderate streak amplitudes (Paredes et al.
Reference Paredes, Choudhari and Li2016a
,Reference Paredes, Choudhari and Li
c
). Subsequently, the linear form of the plane-marching PSE, which latter are recovered from (2.6) by setting
 $\boldsymbol{F}=0$
, is used herein to study the linear, non-parallel stability characteristics of the modified basic state corresponding to the sum of the flat-plate boundary layer and the finite-amplitude optimal disturbance. A more detailed description of the plane-marching PSE methodology is given by Paredes (Reference Paredes2014), Paredes et al. (Reference Paredes, Hanifi, Theofilis and Henningson2015b
) and Paredes et al. (Reference Paredes, Choudhari and Li2017a
).
The onset of laminar–turbulent transition is estimated using the logarithmic amplification ratio, the so-called
 $N$
-factor, based on Mack’s energy norm
 $E$
defined in (2.3) and relative to the lower bound location
 $\unicode[STIX]{x1D709}_{lb}$
where the disturbance first becomes unstable,
 $$\begin{eqnarray}N=-\int _{\unicode[STIX]{x1D709}_{lb}}^{\unicode[STIX]{x1D709}}\unicode[STIX]{x1D6FC}_{i}(\unicode[STIX]{x1D709}^{\prime })\,\text{d}\unicode[STIX]{x1D709}^{\prime }+1/2\ln [\hat{E}(\unicode[STIX]{x1D709})/\hat{E}(\unicode[STIX]{x1D709}_{lb})].\end{eqnarray}$$
Accordingly, we assume that transition onset is likely to occur when the peak
 $N$
-factor reaches a specified value. Similarly, the non-parallel growth rate based on the Mack’s energy norm
 $E$
is defined as
 $$\begin{eqnarray}\unicode[STIX]{x1D70E}=\frac{\text{d}N}{\text{d}\unicode[STIX]{x1D709}}.\end{eqnarray}$$
2.3 Spatial discretization and boundary conditions
The PSE are integrated along the streamwise coordinate by using second-order backward differentiation. A constant step of
 $\unicode[STIX]{x0394}R=2.5$
, where
 $R=\sqrt{Re_{x}}$
, along the streamwise direction is used. Finite differences (Hermanns & Hernández Reference Hermanns and Hernández2008; Paredes et al.
Reference Paredes, Hermanns, Le Clainche and Theofilis2013) (FD-q) of sixth order are used for discretization of the wall-normal coordinate. In the transient growth computations with PSE, the wall-normal direction is discretized using
 $N_{\unicode[STIX]{x1D702}}=201$
. The nodes are clustered towards the wall (Paredes et al.
Reference Paredes, Hermanns, Le Clainche and Theofilis2013). The clustering of points is dependent on the boundary-layer thickness, with half of the grid points located below
 $10\times \unicode[STIX]{x1D6FF}$
, where
 $\unicode[STIX]{x1D6FF}$
is the similarity scale. No-slip, isothermal boundary conditions are used at the wall, i.e.
 $\hat{u} =\hat{v}={\hat{w}}=\hat{T}=0$
. The amplitude functions are forced to decay at the far-field boundary by imposing the Dirichlet conditions
 $\hat{\unicode[STIX]{x1D70C}}=\hat{u} ={\hat{w}}=\hat{T}=0$
. The far-field boundary coordinate is set just below the shock layer.
The plane-marching PSE are used to predict the nonlinear evolution of finite-amplitude transient growth disturbances as well as the linear amplification characteristics of modulated Mack-mode waves and streak instability waves sustained by the nonlinear streak disturbances. The plane-marching PSE are integrated using the same streamwise and wall-normal discretizations as that of the linear optimal growth analysis by using classic PSE, although depending on the initial amplitude, the number of wall-normal nodes is increased up to
 $N_{\unicode[STIX]{x1D702}}=241$
. In addition to the streamwise and wall-normal directions, the azimuthal direction is discretized with Fourier collocation points. Note that the PSE amplitude function of (2.1),
 $\hat{\boldsymbol{q}}(\unicode[STIX]{x1D709},\unicode[STIX]{x1D702})$
, depends only on the streamwise and wall-normal coordinates, while that corresponding to plane marching of (2.5),
 $\hat{\boldsymbol{q}}(\unicode[STIX]{x1D709},\unicode[STIX]{x1D702},\unicode[STIX]{x1D701})$
depends on all three spatial directions. Depending on the amplitude of the optimal growth perturbation, the number of azimuthal points is varied from
 $N_{\unicode[STIX]{x1D701}}=16$
to
 $N_{\unicode[STIX]{x1D701}}=64$
. Similar to the streamwise and wall-normal grids, the same azimuthal grids are used to compute the evolution of both finite-amplitude streaks and their modal instabilities. However, a non-periodic finite-difference discretization (FD-q) of sixth order is also used in the azimuthal direction during a subset of the calculations for improved computational efficiency. With the non-periodic scheme, only one half of the streak azimuthal wavelength,
 $\unicode[STIX]{x1D706}_{ST}=2\unicode[STIX]{x03C0}/m_{ST}$
, where
 $m_{ST}$
denotes the streak wavenumber, needs to be discretized and the boundary conditions in
 $\unicode[STIX]{x1D701}=0$
and
 $\unicode[STIX]{x1D701}=\unicode[STIX]{x1D706}_{ST}/2$
determine the instability mode to be studied, i.e. sinuous (S) or varicose (V) mode types with a fundamental (
 $m=m_{ST}$
), subharmonic (
 $m=1/2\,m_{ST}$
) and
 $m=3/2\,m_{ST}$
wavenumbers. Table 1 shows the boundary conditions used in each case.
Azimuthal boundary conditions used in the plane-marching PSE analysis. The mode types S and V refer to sinuous and varicose mode shapes, respectively, with respect to the half-symmetry plane of the streak,
 $\unicode[STIX]{x1D701}=\unicode[STIX]{x1D706}_{ST}/2$
. Also, note that
 $q_{\unicode[STIX]{x1D701}}\equiv \unicode[STIX]{x2202}q/\unicode[STIX]{x2202}\unicode[STIX]{x1D701}$
.

The number of discretization points in all three directions and the wall-normal domain size were varied to ensure that the relevant flow quantities were insensitive to further improvement in grid resolution and enlargement of the domain size. Verification of the present linear optimal growth module against available transient growth results from the literature is shown in Paredes et al. (Reference Paredes, Choudhari, Li and Chang2016d ). Verification of the present plane-marching PSE module against line-marching PSE and direct numerical simulation (DNS) results for various flows and disturbance types is shown in De Tullio et al. (Reference De Tullio, Paredes, Sandham and Theofilis2013) and Paredes et al. (Reference Paredes, Hanifi, Theofilis and Henningson2015b ).
3 Results
Next, we study the axisymmetric boundary layer over a nearly sharp,
 $7^{\circ }$
half-angle circular cone at zero angle of attack in a hypersonic free-stream flow. The details of the basic state and its modal instability characteristics are introduced first. Then, the linear transient growth analysis and the evolution of finite-amplitude optimal perturbations are presented. Finally, the instability characteristics of the perturbed boundary-layer flows and the overall effects of the streaks on the estimated transition onset location are analysed.
3.1 Basic state solution
The present analysis is performed for a
 $7^{\circ }$
half-angle circular cone at zero angle of attack in a hypersonic free-stream flow. The length of the nearly sharp cone is
 $L_{c}^{\ast }=2.0$
m, and the nose radius is
 $r_{n}^{\ast }=2.5$
mm so that the front half of the cone matches the HIFiRE-1 geometry. The extended cone length is used in the present investigation to assess the extent of potential delay in laminar–turbulent transition due to the streaks. The basic state, laminar boundary-layer flow over the cone surface is computed by using a second-order accurate algorithm as implemented in the finite-volume compressible Navier–Stokes flow solver VULCAN-CFD (Litton, Edwards & White Reference Litton, Edwards and White2003). (Visit http://vulcan-cfd.larc.nasa.gov for further information about the VULCAN-CFD solver.) The VULCAN-CFD solution is based on the full Navier–Stokes equations and uses the solver’s built-in capability to iteratively adapt the computational grid to the shock. The basic state solution is computed by using the steady state module of the solver. Sutherland’s law is assumed for the viscosity, with Sutherland’s constant set equal to
 $110.4$
K. The Prandtl number is set to
 $0.72$
for air, and
 $\unicode[STIX]{x1D6FE}$
is equal to
 $1.4$
, as the perfect gas model is considered.
The free-stream conditions are selected to replicate those of the HIFiRE-1 flight experiment at time equal to
 $21.5$
s during the ascent phase (Kimmel et al.
Reference Kimmel, Adamczak, Paull, Paull, Shannon, Pietsch, Frost and Alesi2015), i.e. Mach
 $5.30$
flow with a unit Reynolds number of
 $13.42\times 10^{6}$
m
 $^{-1}$
, free-stream temperature of
 $T_{\infty }^{\ast }=201.4$
K and a prescribed surface temperature distribution that corresponds to a wall-to-adiabatic temperature ratio of approximately
 $0.35$
over most of the vehicle (Li et al.
Reference Li, Choudhari, Chang, Kimmel, Adamczak and Smith2015a
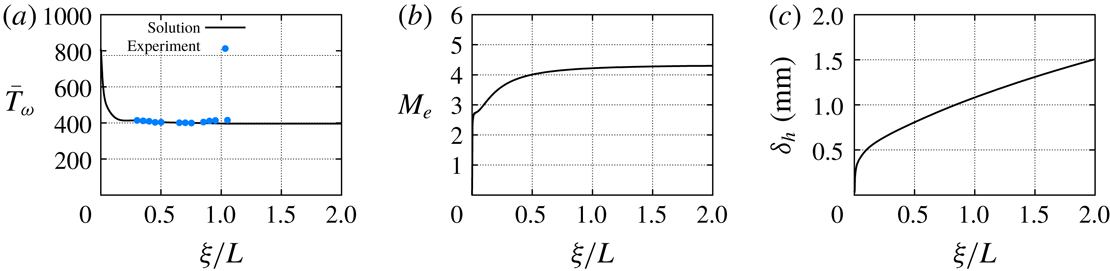
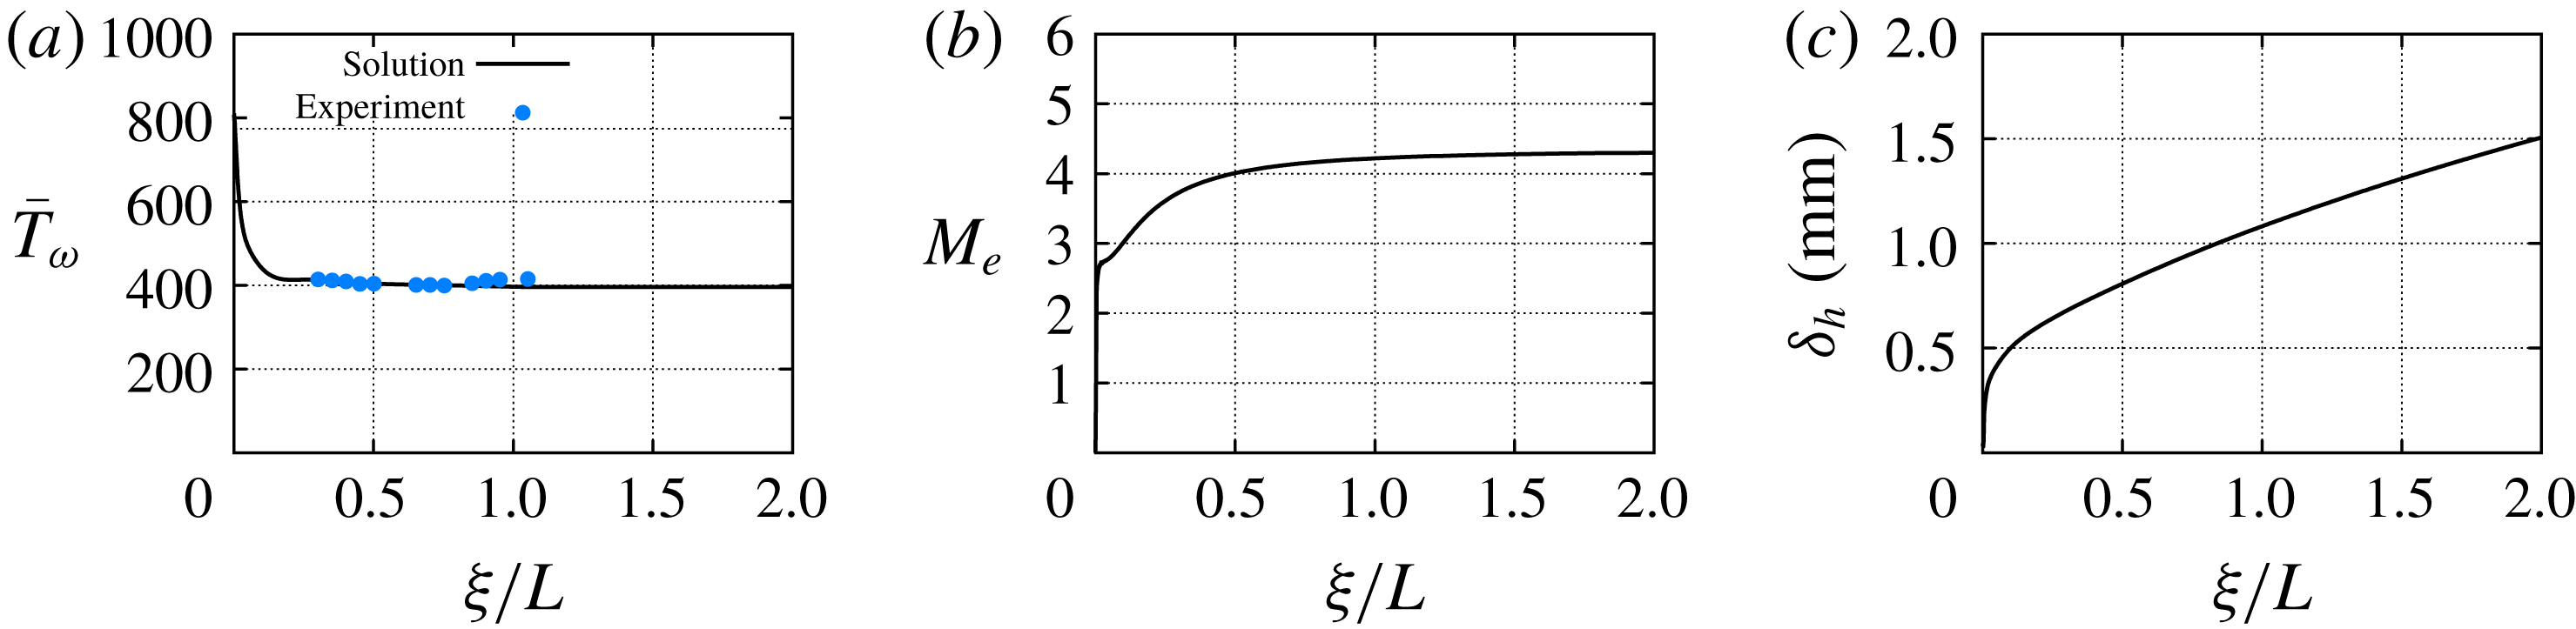
). Figure 2(a) shows the prescribed wall temperature along the surface of the cone. As explained by Li et al. (Reference Li, Choudhari, Chang, Kimmel, Adamczak and Smith2015a
), the surface temperature distribution was obtained by combining the results of thermal analysis based on axisymmetric, finite-element calculations using the US Air Force Research Laboratory (AFRL) TOPAZ code (Kimmel et al.
Reference Kimmel, Adamczak, Gaitonde, Rougeux and Haynes2007) and the experimental data based on thermocouple measurements (Kimmel et al.
Reference Kimmel, Adamczak, Paull, Paull, Shannon, Pietsch, Frost and Alesi2015). The edge Mach number
 $M_{e}$
and boundary-layer thickness
 $\unicode[STIX]{x1D6FF}_{h}$
, which is defined as the wall-normal position where
 $h_{t}/h_{t,\infty }=0.995$
, where
 $h_{t}$
is the total enthalpy, are plotted in figures 2(b) and 2(c), respectively.
The computational grid has 865 points in the streamwise direction and 513 points in the wall-normal direction. A minimum of 120 points is clustered next to the cone surface to resolve the thickness of the boundary layer. This grid resolution is based on the work of Li et al. (Reference Li, Choudhari, Chang, Kimmel, Adamczak and Smith2015a ), who computed the laminar flow over the HIFiRE-1 geometry at selected flight experiment conditions with the VULCAN-CFD solver and performed a grid-convergence test by doubling the number of points in each directions and a verification of the results by comparing the solution with that computed with a different Navier–Stokes solver, i.e. the CFL3D code (Rumsey, Biedron & Thomas Reference Rumsey, Biedron and Thomas1997).
Streamwise evolution of (a) wall temperature, (b) edge Mach number and (c) boundary-layer thickness. The wall temperature values measured in the flight experiments are included.
In what follows, free-stream values are used as reference values for non-dimensionalization. The reference length scale is defined as
 $\unicode[STIX]{x1D6FF}=\sqrt{L\unicode[STIX]{x1D708}/u_{\infty }}$
, where
 $L^{\ast }=1.0$
m. For this problem, the computational coordinates,
 $(\unicode[STIX]{x1D709},\unicode[STIX]{x1D702},\unicode[STIX]{x1D701})$
, are defined as an orthogonal body-fitted coordinate system. The metric factors are defined as
 $$\begin{eqnarray}\displaystyle & \displaystyle h_{\unicode[STIX]{x1D709}}=1+\unicode[STIX]{x1D705}\unicode[STIX]{x1D702}, & \displaystyle\end{eqnarray}$$
 $$\begin{eqnarray}\displaystyle & \displaystyle h_{\unicode[STIX]{x1D701}}=r_{b}+\unicode[STIX]{x1D702}\cos (\unicode[STIX]{x1D703}), & \displaystyle\end{eqnarray}$$
where
 $\unicode[STIX]{x1D705}$
denotes the streamwise curvature,
 $r_{b}$
is the local radius and
 $\unicode[STIX]{x1D703}$
is the local half-angle along the axisymmetric surface, i.e.
 $\sin (\unicode[STIX]{x1D703})=\text{d}r_{b}/\text{d}\unicode[STIX]{x1D709}$
. For the present straight circular cone (with exception of the nose region that is not included in this analysis),
 $\unicode[STIX]{x1D705}\equiv 0$
and
 $\unicode[STIX]{x1D703}$
is the cone half-angle equal to
 $7^{\circ }$
.
3.2 Modal instability characteristics of the unperturbed flow
Experimental measurements and theoretical predictions based on PSE have confirmed that laminar–turbulent transition in this flow is driven by the modal growth of planar Mack-mode instabilities (Li et al.
Reference Li, Choudhari, Chang, Kimmel, Adamczak and Smith2015a
). The instability of the unperturbed flow was examined by PSE to establish the transition behaviour in the absence of stationary streak perturbations. The onset of laminar–turbulent transition in the unperturbed boundary-layer flow is estimated using
 $N$
-factor evolution of the planar Mack modes computed with the PSE. For the conditions of the experiment (Kimmel et al.
Reference Kimmel, Adamczak, Paull, Paull, Shannon, Pietsch, Frost and Alesi2015), transition onset in the unperturbed cone boundary layer was measured to occur near
 $\unicode[STIX]{x1D709}_{tr}/L=0.85$
m. Figure 3(a) shows that the peak
 $N$
-factor at the measured transition location corresponds to
 $N_{tr}=14.7$
, which is reached by a planar Mack-mode disturbance with frequency
 $\unicode[STIX]{x1D714}=0.603$
. Figure 3(b) shows the growth-rate isolines of planar Mack-mode instabilities. The neutral stability curve corresponds to the black line with
 $\unicode[STIX]{x1D70E}=0.0$
. Neither planar nor oblique first-mode instabilities were found in the present boundary-layer flow because of the low surface temperature relative to the adiabatic temperature.
(a)
 $N$
-factors and (b) growth-rate isolines of planar Mack-mode disturbances in the unperturbed boundary layer. The thick blue line in (a) denotes the mode that reaches largest
 $N$
-factor value (
 $N_{tr}$
) at the experimentally measured transition location (
 $x_{tr}$
) and corresponds to a disturbance frequency of
 $\unicode[STIX]{x1D714}=0.603$
.

3.3 Stationary transient growth and streak development
Herein, transient growth calculations are performed with the initial and final disturbance locations set to
 $\unicode[STIX]{x1D709}_{0}/L=0.5$
and
 $\unicode[STIX]{x1D709}_{1}/L=1.1$
, respectively. The initial location
 $\unicode[STIX]{x1D709}_{0}$
has been selected near the first neutral branch of the planar Mack mode that first reaches
 $N_{tr}$
(see figure 3
a). The range
 $[\unicode[STIX]{x1D709}_{0},\unicode[STIX]{x1D709}_{1}]$
has been chosen to obtain appreciable streak amplitudes over a majority of the cone length, as will be shown in what follows.
Linear transient growth predictions are presented first. Figure 4(a) shows the mean energy gain as a function of the azimuthal wavenumber. The optimal azimuthal wavenumber corresponding to maximum energy gain is found to be equal to
 $m_{op}=180$
. The components of the initial optimal perturbation with azimuthal wavenumbers of
 $m=90$
,
 $180$
and
 $360$
are plotted in figures 4(b), 4(c) and 4(d), respectively. Larger azimuthal wavenumbers lead to optimum initial profiles with a slightly shorter wall-normal extension than the initial profiles for lower wavenumbers. Furthermore, the peaks of the initial profiles with larger azimuthal wavenumbers are located slightly closer to the wall.
(a) Linear optimal mean energy gain,
 $G$
, for initial and final disturbance locations at
 $\unicode[STIX]{x1D709}_{0}/L=0.5$
and
 $\unicode[STIX]{x1D709}_{1}/L=1.1$
, respectively. Also, initial optimal amplitude vectors for (b)
 $m=90$
, (c)
 $m=180$
and (d)
 $m=360$
. The horizontal, dash-double dot line in panels (b)–(d) indicates the edge of the boundary layer based on total enthalpy (
 $h_{t}/h_{t,\infty }=0.995$
).

The nonlinear form of the plane-marching PSE is used to monitor the nonlinear development of optimal initial disturbances with specified amplitudes. These disturbances evolve into streamwise elongated streaks; and figure 5(a) shows the evolution of the streak amplitude based on
 $\tilde{u}$
,
 $$\begin{eqnarray}As_{u}(\unicode[STIX]{x1D709})={\textstyle \frac{1}{2}}[\text{max}_{\unicode[STIX]{x1D702},\unicode[STIX]{x1D701}}(\tilde{u} (\unicode[STIX]{x1D709},\unicode[STIX]{x1D702},\unicode[STIX]{x1D701}))-\min _{\unicode[STIX]{x1D702},\unicode[STIX]{x1D701}}(\tilde{u} (\unicode[STIX]{x1D709},\unicode[STIX]{x1D702},\unicode[STIX]{x1D701}))],\end{eqnarray}$$
for selected initial amplitudes of the
 $m=180$
disturbance from figure 4(c). Unlike the energy norm in (2.3), the velocity amplitude
 $As_{u}$
is expected to be more closely related to the growth of streak instabilities. The streak amplitude parameter
 $A$
corresponds to the maximum streak amplitude
 $As_{u}$
achieved by a linear perturbation with the same initial amplitude, which is given by
 $$\begin{eqnarray}A_{0}=A\times \sqrt{E_{lin,A=1}}.\end{eqnarray}$$
As indicated by (3.4), the amplitude parameter
 $A$
provides a convenient measure of the initial disturbance amplitude. As seen in figure 5(a), nonlinear effects reduce the streak amplitude relative to the linear prediction; hence, for any given case,
 $\text{max}(As_{u})<A$
. The streamwise location of this maximum moves progressively upstream as the amplitude parameter
 $A$
is increased. Figure 5(b), shows the evolution of the disturbance amplitude defined as the square root of the energy norm defined in (2.3) normalized by the initial energy. The deviation from the linear trend starts to become noticeable for
 $A\geqslant 0.20$
.
(a) Evolution of streak amplitudes based on
 $u$
,
 $As_{u}$
, and (b) evolution of disturbance amplitude,
 $\sqrt{E/E_{0}}$
, of finite-amplitude, linear optimal perturbations initialized at
 $\unicode[STIX]{x1D709}_{0}/L=0.5$
with
 $\unicode[STIX]{x1D709}_{1}/L=1.1$
and
 $m=180$
.

Figures 6(a–d), 6(e–h), and 6(i–l) show the isocontours of the total streamwise velocity component in the cross-planes at selected streamwise locations for
 $A=0.10$
,
 $A=0.20$
and
 $A=0.40$
, respectively. At the symmetry plane,
 $\unicode[STIX]{x1D701}=\unicode[STIX]{x1D706}_{ST}/2$
, the near-wall, low-momentum fluid is lifted upward by the counter-rotating vortices, resulting in a localized region of increased boundary-layer thickness and lower wall shear. At the lateral symmetry plane,
 $\unicode[STIX]{x1D701}=0$
(or equivalently,
 $\unicode[STIX]{x1D701}=\unicode[STIX]{x1D706}_{ST}$
), the effect of the initial streamwise vortices is exactly the opposite, yielding a localized region of reduced boundary-layer thickness and increased wall shear. As the streak amplitude becomes larger, the associated azimuthal gradients in the form of a detached three-dimensional shear layer can support the growth of streak instabilities, as studied by Paredes et al. (Reference Paredes, Choudhari and Li2016a
,Reference Paredes, Choudhari and Li
c
, Reference Paredes, Choudhari and Li2017c
), in the context of bypass transition in supersonic and hypersonic boundary layers.
Isocontours of streamwise velocity with isolines at
 $\bar{u}=0:0.1:0.9$
for streak amplitude parameters equal to (a,b,c,d)
 $A=0.10$
, (e,f,g,h)
 $A=0.20$
and (i,j,k,l)
 $A=0.40$
, and streamwise locations equal to (a,e,i)
 $\unicode[STIX]{x1D709}/L=0.75$
, (b,f,j)
 $\unicode[STIX]{x1D709}/L=1.00$
, (c,g,k)
 $\unicode[STIX]{x1D709}/L=1.50$
and (d,h,l)
 $\unicode[STIX]{x1D709}/L=2.00$
.

Finally, the effect of streaks on the skin friction coefficient is studied in figure 7. Figure 7(a) shows the ratio of the spanwise-averaged local skin friction coefficient with respect to that in the unperturbed case (
 $A=0.00$
). A peak skin friction increment of
 $6.1\,\%$
is observed for the
 $A=0.20$
case and of
 $22.5\,\%$
for the
 $A=0.40$
case. The skin friction coefficient is calculated with the wall-normal gradient of the mean flow distortion (MFD) of the streamwise velocity perturbation,
 $\tilde{u} _{MFD}$
, which is defined as
 $$\begin{eqnarray}\tilde{u} _{MFD}(\unicode[STIX]{x1D709},\unicode[STIX]{x1D702})=\frac{1}{\unicode[STIX]{x1D706}_{ST}}\int _{0}^{\unicode[STIX]{x1D706}_{ST}}\tilde{u} (\unicode[STIX]{x1D709},\unicode[STIX]{x1D702},\unicode[STIX]{x1D701})\,\text{d}\unicode[STIX]{x1D701}.\end{eqnarray}$$
Figures 7(b), 7(c) and 7(d) show the MFD streamwise velocity perturbation profiles at streamwise locations
 $\unicode[STIX]{x1D709}/L=0.75$
,
 $1.0$
and
 $1.5$
, respectively. The profiles exhibit a positive peak close to the wall and a negative peak in the vicinity of the boundary-layer edge. The negative peak grows from
 $\unicode[STIX]{x1D709}/L=0.75$
to
 $\unicode[STIX]{x1D709}/L=2.0$
, although the positive peak of
 $\tilde{u} _{MFD}$
decreases as the skin friction coefficient decreases from
 $\unicode[STIX]{x1D709}/L\approx 0.85$
.
(a) Evolution of spanwise-averaged local skin friction coefficient ratio between those corresponding to perturbed flows and unperturbed flow,
 $c_{f}/c_{f,A=0.00}$
. Also, mean-flow-distortion streamwise velocity profiles (
 $\tilde{u} _{MFD}$
) at streamwise positions (b)
 $\unicode[STIX]{x1D709}/L=0.75$
, (c)
 $1.0$
and (d)
 $1.5$
. The horizontal, solid black line in panels (b)–(d) indicates the edge of the unperturbed boundary layer based on total enthalpy (
 $h_{t}/h_{t,\infty }=0.995$
).

3.4 Modal instability characteristics of the perturbed flow with optimal disturbances
The instability characteristics of the modified, streaky boundary-layer flow are examined next. First, the streaks plotted in figure 5 corresponding to finite-amplitude linearly optimal disturbances initiated at
 $\unicode[STIX]{x1D709}_{0}/L=0.5$
with
 $\unicode[STIX]{x1D709}_{1}/L=1.1$
and
 $m_{ST}=180$
are studied. After that, the effect of the streak azimuthal wavenumber
 $m_{ST}$
on the net stabilization of Mack-mode waves is analysed.
3.4.1 Effect of streaks on Mack-mode waves
Herein, we consider both nominally planar and oblique Mack-mode waves that are analysed to unravel what disturbances are more amplified in the presence of the azimuthally periodic streaks. By nominally planar, we refer to disturbances that are originally two-dimensional in the unperturbed boundary layers and are modulated by the presence of the streaks. For any oblique modes with a given, non-zero azimuthal wavenumber, there exists a pair of oblique modes with equal but opposite wave angles. For oblique Mack modes with wavenumbers equal to
 $m=m_{ST}$
(fundamental),
 $m=1/2\,m_{ST}$
(subharmonic) and
 $m=3/2\,m_{ST}$
, the spanwise structure of the mode shape is phase locked to the streaks. As a result, there exist both varicose (symmetric) and sinuous (antisymmetric) modes with different amplification rates. For all other wavenumbers, there is no such phase locking, and hence, both oblique modes with the same value of
 $m$
have the same amplification rate and their mode shapes satisfy the condition
 $\hat{\boldsymbol{q}}^{-}(\unicode[STIX]{x1D709},\unicode[STIX]{x1D702},\unicode[STIX]{x1D701})=\hat{\boldsymbol{q}}^{+}(\unicode[STIX]{x1D709},\unicode[STIX]{x1D702},-\unicode[STIX]{x1D701})$
, where the superscripts
 $+$
and
 $-$
denote the signs of the spanwise components of phase velocities associated with the two modes constituting the pair.
Spatial growth rates (
 $-\unicode[STIX]{x1D6FC}_{i}$
) of (a) planar Mack modes (
 $\text{MM}_{0}$
), (b) oblique Mack modes with subharmonic (
 $m=1/2\,m_{ST}$
) sinuous (
 $\text{MM}_{1/2,S}$
) and varicose (
 $\text{MM}_{1/2,V}$
) mode shapes, (c) oblique Mack modes with fundamental (
 $m=m_{ST}$
) sinuous (
 $\text{MM}_{1,S}$
) and varicose (
 $\text{MM}_{1,V}$
) mode shapes and (d) oblique Mack modes with
 $m=3/2\,m_{ST}$
sinuous (
 $\text{MM}_{3/2,S}$
) and varicose (
 $\text{MM}_{3/2,S}$
) mode shapes, for selected streak amplitudes at
 $\unicode[STIX]{x1D709}/L=1.0$
.

Isocontours of the real and imaginary parts and magnitude of streamwise velocity perturbations for
 $A=0.10$
at
 $\unicode[STIX]{x1D709}/L=1.0$
and frequencies (a)
 $\unicode[STIX]{x1D714}=0.455$
for
 $\text{MM}_{0}$
, (b)
 $\unicode[STIX]{x1D714}=0.501$
for
 $\text{MM}_{1/2,S}$
, (c)
 $\unicode[STIX]{x1D714}=0.455$
for
 $\text{MM}_{1/2,V}$
, (d)
 $\unicode[STIX]{x1D714}=0.506$
for
 $\text{MM}_{1,S}$
, (e)
 $\unicode[STIX]{x1D714}=0.546$
for
 $\text{MM}_{1,V}$
, (f)
 $\unicode[STIX]{x1D714}=0.580$
for
 $\text{MM}_{3/2,S}$
, (g)
 $\unicode[STIX]{x1D714}=0.552$
for
 $\text{MM}_{3/2,V}$
. The isolines of basic state streamwise velocity,
 $\bar{u}=0:0.1:0.9$
, are added for reference.

Figure 8 shows the frequency dependence of spatial growth rates computed with quasiparallel PDE-based eigenvalue problem (EVP) at a fixed streamwise location of
 $\unicode[STIX]{x1D709}/L=1.0$
. Results are plotted for five different families of modes that can presumably be relevant in the presence of the streaks:
 $\text{MM}_{0}$
,
 $\text{MM}_{1/2,S}$
,
 $\text{MM}_{1/2,V}$
,
 $\text{MM}_{1,S}$
,
 $\text{MM}_{1,V}$
,
 $\text{MM}_{3/2,S}$
and
 $\text{MM}_{3/2,V}$
. The mode
 $\text{MM}_{0}$
reduces to a planar Mack-mode disturbance in the limit of
 $A\rightarrow 0$
. Modes
 $\text{MM}_{1/2,V}$
and
 $\text{MM}_{1/2,S}$
correspond to oblique Mack-mode disturbances (with azimuthal wavenumber equal to one half of the streak spacing) of varicose and sinuous type, respectively. The fundamental varicose and sinuous modes,
 $\text{MM}_{1,V}$
and
 $\text{MM}_{1,S}$
, respectively, correspond to oblique Mack-mode disturbances with azimuthal wavenumber equal to the streak spacing. Similarly, the modes
 $\text{MM}_{3/2,V}$
and
 $\text{MM}_{3/2,S}$
correspond to oblique Mack-mode disturbances with azimuthal wavenumber equal to
 $3/2$
times the fundamental wavenumber, i.e. three Mack-mode wavelengths within two streak wavelengths, with the second suffix denoting the mode types as varicose and sinuous, respectively. Mode shapes for each family at frequencies corresponding to respective peak local growth rate are shown in figure 9(a)–(g) for a streak amplitude of
 $A=0.10$
. The varicose and sinuous characterizations of the modes correspond to the symmetry and antisymmetry mode shapes, respectively, with respect to the half-symmetry plane of the streak
 $(\unicode[STIX]{x1D701}=\unicode[STIX]{x1D706}_{ST}/2)$
. Figure 8(a) shows a progressive reduction in the peak growth rate of
 $\text{MM}_{0}$
modes with increasing streak amplitude. Simultaneously, the growth-rate curves are displaced toward lower frequencies because the
 $\text{MM}_{0}$
mode shape is concentrated on the crests of the modified flow (i.e. regions of increased boundary-layer thickness) as shown by figure 9(a). Similar to the
 $\text{MM}_{0}$
mode, both of the subharmonic modes (
 $\text{MM}_{1/2,V}$
and
 $\text{MM}_{1/2,S}$
) have mode shape distributions that peak in the neighbourhood of the crests (figures 9(b,c). Accordingly, their peak growth frequencies decrease as the streak amplitude is increased. While the peak amplification rates of both subharmonic modes also decrease with an increasing streak amplitude, the stabilizing influence is substantially stronger for the sinuous mode
 $\text{MM}_{1/2,S}$
. Figure 8(c) indicates that the effect of the streaks is somewhat different in the case of the
 $\text{MM}_{1,V}$
modes, which are strongest within the valley regions of the streaks. The growth rates of these
 $\text{MM}_{1,V}$
modes initially increase with the streak amplitude parameter up to
 $A=0.05$
, and then decrease at higher
 $A$
. Furthermore, the peak growth frequencies of the
 $\text{MM}_{1,V}$
modes increase with
 $A$
. In contrast, the streaks have a stabilizing influence on the
 $\text{MM}_{1,S}$
modes (figure 9
d) for all
 $A$
. Finally, both the
 $\text{MM}_{3/2,S}$
and
 $\text{MM}_{3/2,V}$
modes are destabilized with streak amplitude parameter up to
 $A=0.10$
, although the varicose mode
 $\text{MM}_{3/2,V}$
does not reach the neutral stability threshold, i.e. zero growth rate. The mode shapes of the modes
 $\text{MM}_{3/2,S}$
and
 $\text{MM}_{3/2,V}$
are shown in figures 9(f) and 9(g), respectively.
As explained before, the instability waves with wavenumbers different from those studied in figures 8 and 9 (namely,
 $m=1/2\,m_{ST}$
,
 $m_{ST}$
and
 $3/2\,m_{ST}$
) are not phase locked by the presence of the streaks, and hence, both oblique modes with the same value of
 $m$
have the same amplification rate and their mode shapes satisfy
 $\hat{\boldsymbol{q}}^{-}(\unicode[STIX]{x1D709},\unicode[STIX]{x1D702},\unicode[STIX]{x1D701})=\hat{\boldsymbol{q}}^{+}(\unicode[STIX]{x1D709},\unicode[STIX]{x1D702},-\unicode[STIX]{x1D701})$
. Figure 10 shows the mode shape of the Mack mode wave with
 $m=3/5\,m_{ST}$
. These waves have an azimuthal wavelength of
 $5/3$
times the azimuthal wavelength of the streaks. The three perturbation wavelengths within five streak wavelengths are visible in the mode shapes corresponding to the real and imaginary parts of the perturbation. The streamwise velocity magnitude is rather similar to that corresponding to the
 $\text{MM}_{1/2,S}$
plotted in figure 9(b), but differences in phase are observed in the real and imaginary parts of the mode shape components.
Isocontours of the real and imaginary parts and magnitude of streamwise velocity perturbation for
 $A=0.10$
at
 $\unicode[STIX]{x1D709}/L=1.0$
and frequency
 $\unicode[STIX]{x1D714}=0.501$
for
 $\text{MM}_{3/5}$
. The isolines of basic state streamwise velocity,
 $\bar{u}=0:0.1:0.9$
, are added for reference.

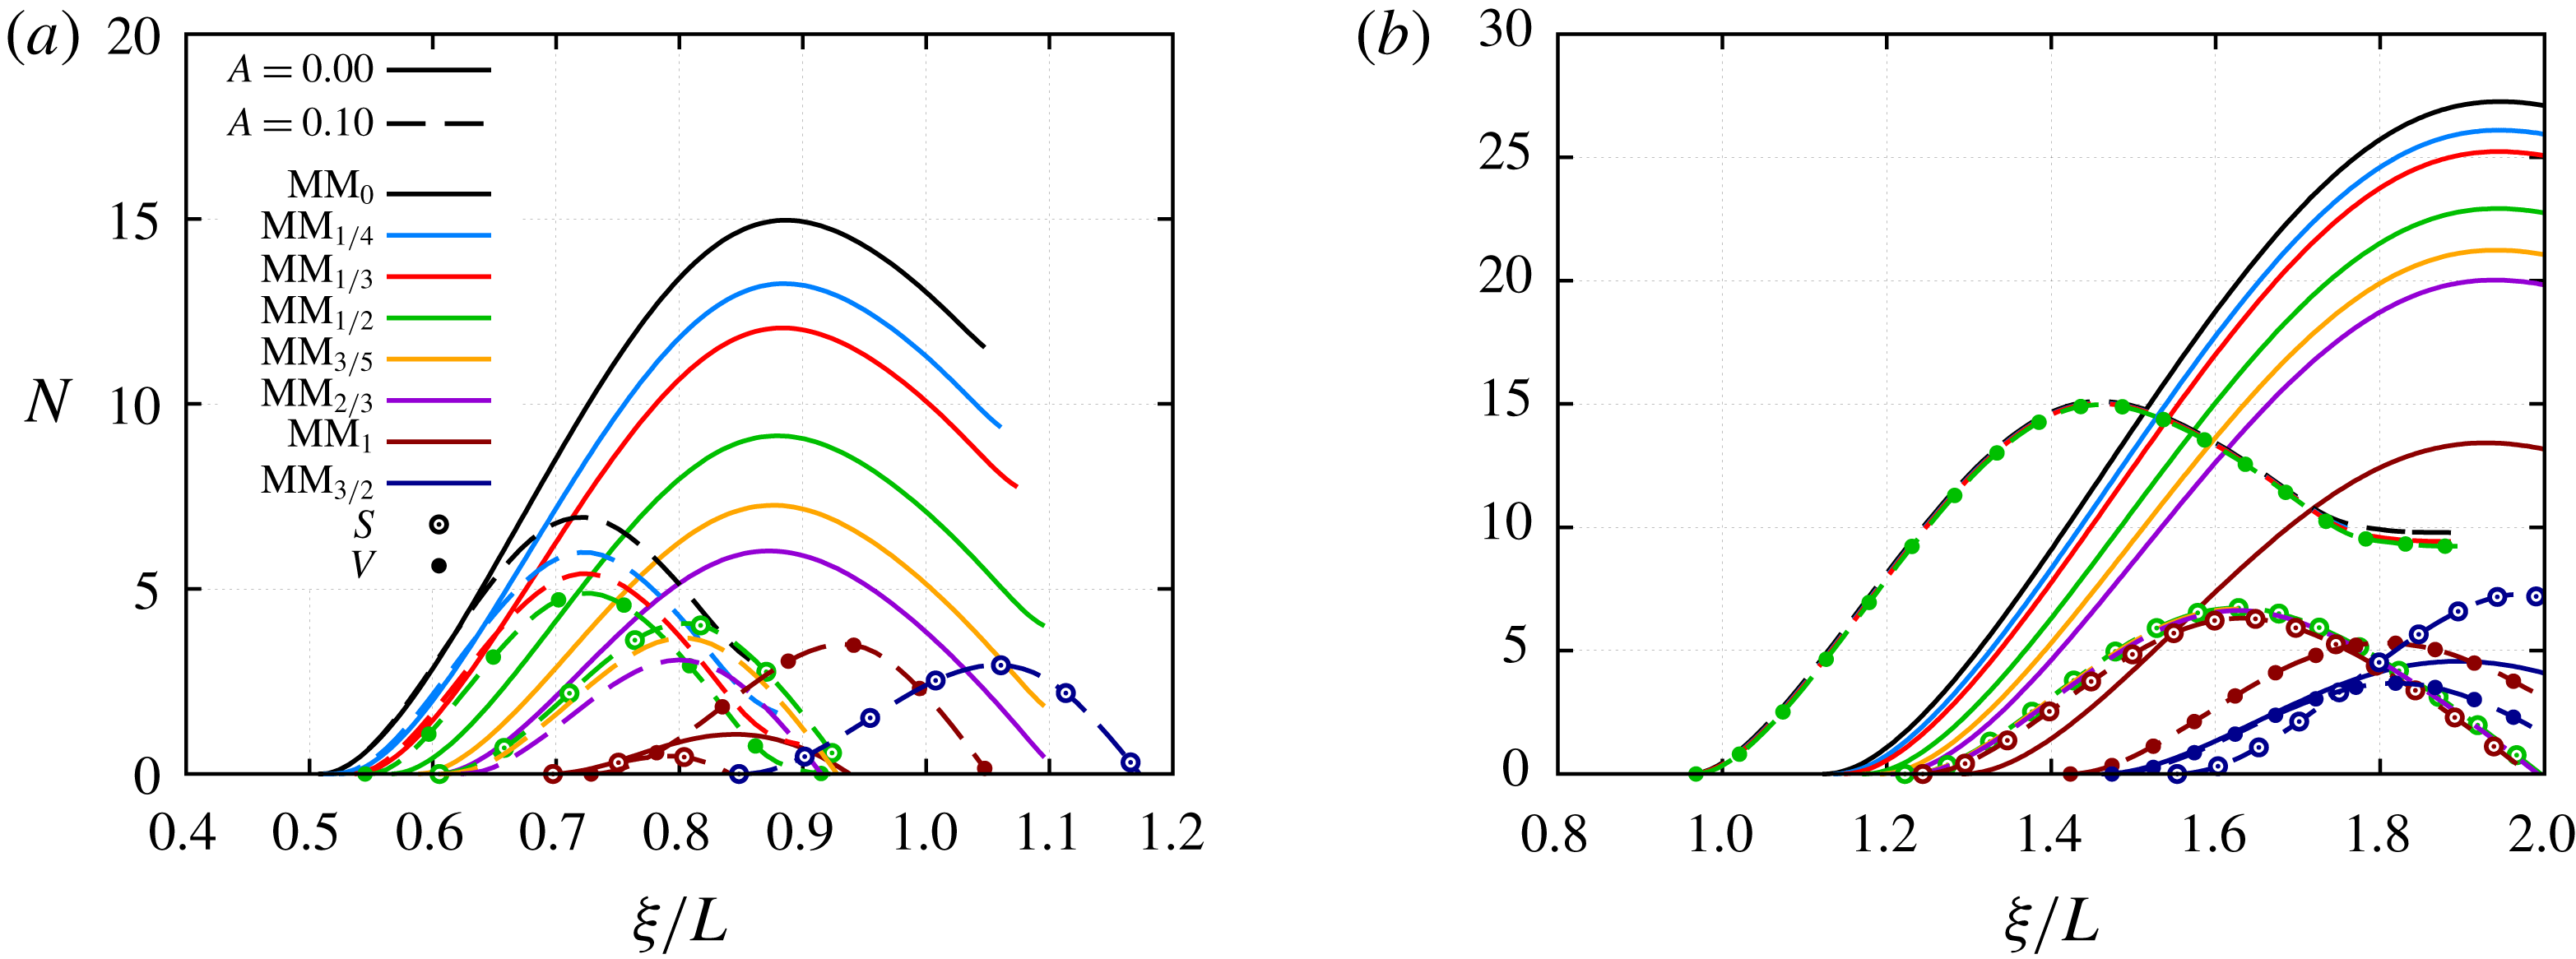
To characterize the overall effect of streaks on the amplification of the Mack-mode disturbances, we now examine the spatial evolution of fixed-frequency planar and oblique Mack modes with the plane-marching PSE. The
 $N$
-factor defined in (2.7) is used as a measure of the disturbance amplification. Figures 11(a) and 11(b) illustrate the
 $N$
-factor evolution of the Mack modes with frequencies
 $\unicode[STIX]{x1D714}=0.603$
and
 $\unicode[STIX]{x1D714}=0.421$
, respectively, for the unperturbed basic state (
 $A=0.00$
) and the perturbed flow with
 $A=0.10$
. Results for the unperturbed and perturbed flows include the planar Mack mode (
 $\text{MM}_{0}$
) and oblique Mack modes with several values of
 $m$
, i.e.
 $m=1/4\,m_{ST}$
(
 $\text{MM}_{1/4}$
),
 $m=1/3\,m_{ST}$
(
 $\text{MM}_{1/3}$
),
 $m=1/2\,m_{ST}$
(
 $\text{MM}_{1/2}$
),
 $m=3/5\,m_{ST}$
(
 $\text{MM}_{3/5}$
),
 $m=2/3\,m_{ST}$
(
 $\text{MM}_{2/3}$
) and
 $m=m_{ST}$
(
 $\text{MM}_{1}$
), as well as the sinuous (S) and varicose (V) mode types for the locked modes. As shown in figure 3, the disturbance frequency used in figure 11(a),
 $\unicode[STIX]{x1D714}=0.603$
, corresponds to the frequency of the planar Mack mode that reaches the largest
 $N$
-factor,
 $N_{tr}=14.7$
, at the experimentally observed transition location,
 $\unicode[STIX]{x1D709}_{tr}/L=0.85$
m. For the perturbed case with
 $A=0.10$
, the
 $\text{MM}_{0}$
disturbance frequency
 $\unicode[STIX]{x1D714}=0.421$
that is used in figure 11(b), reaches the transition
 $N$
-factor
 $N_{tr}=14.7$
at the most upstream location,
 $\unicode[STIX]{x1D709}_{tr}/L=1.39$
. Figure 11(a) shows that for the unperturbed case, the maximum value of the
 $N$
-factor is reached by the
 $\text{MM}_{0}$
mode and is
 $N=14.97$
. For the perturbed case, the peak
 $N$
-factor is also reached by the
 $\text{MM}_{0}$
mode, but is drastically reduced to
 $N=6.94$
. For the perturbed flow case, the unlocked oblique modes
 $\text{MM}_{1/4}$
,
 $\text{MM}_{1/3}$
,
 $\text{MM}_{3/5}$
and
 $\text{MM}_{2/3}$
experience a similarly stabilizing effect of the streaks as that found for the
 $\text{MM}_{0}$
mode and their
 $N$
-factor curves remain below the
 $N$
-factor curve of the
 $\text{MM}_{0}$
mode. The phase locked modes
 $\text{MM}_{1,V}$
and
 $\text{MM}_{3/2,S}$
are destabilized, although their peak
 $N$
-factor values are approximately one half of the peak value corresponding to the
 $N$
-factor of the
 $\text{MM}_{0}$
mode. Figure 11(b) shows that the peak
 $N$
-factor values for the disturbance frequency
 $\unicode[STIX]{x1D714}=0.421$
are reduced from
 $N=25.26$
to
 $N=15.11$
by the introduction of the streak. The
 $N$
-factor curves of the
 $\text{MM}_{1/4}$
,
 $\text{MM}_{1/3}$
,
 $\text{MM}_{1/2,V}$
modes become nearly coincident but remain below the curve corresponding to the
 $\text{MM}_{0}$
mode. The rest of oblique Mack modes plotted in figure 11(b), i.e.
 $\text{MM}_{1/2,V}$
,
 $\text{MM}_{3/5}$
,
 $\text{MM}_{2/3}$
,
 $\text{MM}_{1,S}$
,
 $\text{MM}_{1,V}$
,
 $\text{MM}_{3/2,S}$
and
 $\text{MM}_{3/2,V}$
, are also less amplified than the
 $\text{MM}_{0}$
. Therefore, we can conclude that the planar Mack mode,
 $\text{MM}_{0}$
, dominates the instability characteristics of both the unperturbed and perturbed boundary-layer flows.
Evolution of
 $N$
-factors with frequencies (a)
 $\unicode[STIX]{x1D714}=0.603$
and (b)
 $\unicode[STIX]{x1D714}=0.421$
of planar and selected oblique Mack-mode waves for the unperturbed boundary-layer flow (
 $A=0.00$
) and the perturbed boundary-layer flow with
 $A=0.10$
.
Herein, the primary mechanism for the effect of the streak on the reduced amplification of the planar Mack mode is investigated. Figures 12(a) and 12(b) illustrate the
 $N$
-factor evolution of the
 $\text{MM}_{0}$
mode with frequencies
 $\unicode[STIX]{x1D714}=0.603$
and
 $\unicode[STIX]{x1D714}=0.421$
, respectively, for the unperturbed basic state (
 $A=0.00$
) and the perturbed flow with
 $A=0.10$
. The extra three curves plotted in figures 12(a) and 12(b) indicate the
 $N$
-factor evolution for the same frequencies using three ‘artificial’ basic states: a two-dimensional basic state corresponding to the azimuthal average of the
 $A=0.10$
flow, which corresponds to the unperturbed flow (
 $A=0.00$
) plus the mean-flow distortion (MFD) due to the streak,
 $A=0.00+\text{MFD}$
, the perturbed flow with
 $A=0.10$
minus the MFD of the perturbation,
 $A=0.10-\text{MFD}$
and the two-dimensional profile at the half-symmetry plane (
 $\unicode[STIX]{x1D701}=\unicode[STIX]{x1D706}_{ST}/2$
) of the perturbed flow,
 $A=0.10:\unicode[STIX]{x1D701}=\unicode[STIX]{x1D706}/2$
. These extra cases are introduced to understand the primary mechanism for the effect of the streak on the reduced amplification of the planar Mack mode. By comparing the
 $N$
-factor of the first extra case (
 $A=0.00+\text{MFD}$
) with that for the unperturbed flow (
 $A=0.00$
), we can see that the MFD has a modestly stabilizing influence on the planar Mack mode, which is in qualitative agreement with the findings reported by Ren et al. (Reference Ren, Fu and Hanifi2016) for weak streaks (
 $As_{u}<0.05$
) and by Paredes et al. (Reference Paredes, Choudhari and Li2016b
) for a broader range of streak amplitudes for a boundary-layer flow representative of wind tunnel conditions (
 $T_{w}/T_{w,ad}=0.68$
). However, the
 $N$
-factor evolution for the second ‘artificial’ case (
 $A=0.10-\text{MFD}$
) indicates a stronger stabilizing influence on the planar Mack mode by the three-dimensional modulation of the boundary layer, or, equally, the spanwise varying component of the stationary streak. The
 $N$
-factor curve for the
 $A=0.10-\text{MFD}$
case closely approximates the result for the total perturbed flow (
 $A=0.10$
), i.e. has similar neutral locations and maximum peak amplifications. Therefore, the three-dimensional modulation of the boundary layer caused by the streaks dominates the overall modification of the instability characteristics of the planar Mack-mode waves. Because the
 $\text{MM}_{0}$
mode shape is concentrated on the crests of the undulating velocity contours of the modified flow (figure 9
a), the analysis of the third ‘artificial’ case (
 $A=0.10:\unicode[STIX]{x1D701}=\unicode[STIX]{x1D706}/2$
) intends to resolve whether the instability characteristics of the boundary layer along the half-symmetry plane reflects the instability features of the total flow field. Figures 12(a) and 12(b) show that as the streak amplitude becomes significant for
 $\unicode[STIX]{x1D709}/L>0.5$
(figure 5), the
 $N$
-factor curve of the
 $A=0.10:\unicode[STIX]{x1D701}=\unicode[STIX]{x1D706}/2$
case strongly differs from that corresponding to the
 $A=0.10$
case, which implies that the three-dimensional effects need to be considered.
Evolution of
 $N$
-factors of planar Mack-mode waves with frequencies (a)
 $\unicode[STIX]{x1D714}=0.603$
and (b)
 $\unicode[STIX]{x1D714}=0.421$
for the unperturbed basic state (
 $A=0.00$
), the perturbed basic state (
 $A=0.10$
), the unperturbed basic state plus the MFD of the
 $A=0.10$
perturbation (
 $A=0.10+\text{MFD}$
), the perturbed basic state without the MFD (
 $A=0.10-\text{MFD}$
) and the
 $\unicode[STIX]{x1D701}=\unicode[STIX]{x1D706}_{ST}/2$
plane of the perturbed basic state (
 $A=0.10:\unicode[STIX]{x1D701}=\unicode[STIX]{x1D706}/2$
).

Finally, to further understand the dominant mechanism of the instability modes, the production terms associated with the local kinetic energy transfer as a function of the streamwise location are calculated; see Malik et al. (Reference Malik, Li, Choudhari and Chang1999) and Paredes et al. (Reference Paredes, Choudhari and Li2017a
) for further details. Figures 13(a) and 13(b) show the evolution of the normalized production terms associated with the streamwise velocity gradients in the three directions
 $(\unicode[STIX]{x1D709},\unicode[STIX]{x1D702},\unicode[STIX]{x1D701})$
for disturbance frequencies
 $\unicode[STIX]{x1D714}=0.603$
and
 $\unicode[STIX]{x1D714}=0.421$
, respectively. These terms are written as
 $$\begin{eqnarray}\displaystyle & \displaystyle Pu_{\unicode[STIX]{x1D709}}(\unicode[STIX]{x1D709})=-\int _{\unicode[STIX]{x1D701}}\int _{\unicode[STIX]{x1D702}}\text{Re}(\hat{u} \hat{u} ^{c})\bar{\unicode[STIX]{x1D70C}}\bar{u}_{\unicode[STIX]{x1D709}}h_{\unicode[STIX]{x1D709}}h_{\unicode[STIX]{x1D701}}\,\text{d}\unicode[STIX]{x1D702}\,\text{d}\unicode[STIX]{x1D701}, & \displaystyle\end{eqnarray}$$
 $$\begin{eqnarray}\displaystyle & \displaystyle Pu_{\unicode[STIX]{x1D702}}(\unicode[STIX]{x1D709})=-\int _{\unicode[STIX]{x1D701}}\int _{\unicode[STIX]{x1D702}}\text{Re}(\hat{u} \hat{v}^{c})\bar{\unicode[STIX]{x1D70C}}\bar{u}_{\unicode[STIX]{x1D702}}h_{\unicode[STIX]{x1D709}}h_{\unicode[STIX]{x1D701}}\,\text{d}\unicode[STIX]{x1D702}\,\text{d}\unicode[STIX]{x1D701}, & \displaystyle\end{eqnarray}$$
 $$\begin{eqnarray}\displaystyle & \displaystyle Pu_{\unicode[STIX]{x1D701}}(\unicode[STIX]{x1D709})=-\int _{\unicode[STIX]{x1D701}}\int _{\unicode[STIX]{x1D702}}\text{Re}(\hat{u} {\hat{w}}^{c})\bar{\unicode[STIX]{x1D70C}}\bar{u}_{\unicode[STIX]{x1D701}}h_{\unicode[STIX]{x1D709}}h_{\unicode[STIX]{x1D701}}\,\text{d}\unicode[STIX]{x1D702}\,\text{d}\unicode[STIX]{x1D701}, & \displaystyle\end{eqnarray}$$
where the superscript
 $c$
denotes complex conjugate. Figure 13(a,b) shows that the production term associated with the wall-normal gradient clearly dominates for both the unperturbed and perturbed cases, because the streamwise and azimuthal terms are negligible. Furthermore, the
 $Pu_{\unicode[STIX]{x1D702}}$
term for the perturbed boundary-layer flow remains positive over a relatively shorter streamwise domain, which explains the shorter range of amplification and the lower
 $N$
-factor peak of the
 $\text{MM}_{0}$
mode observed in figure 12(a,b).
Evolution of the ratio between the production terms associated with the streamwise velocity gradients and the kinetic energy of the planar Mack-mode waves with frequencies (a)
 $\unicode[STIX]{x1D714}=0.603$
and (b)
 $\unicode[STIX]{x1D714}=0.421$
.

3.4.2 Streak instabilities
In the previous subsections, we discussed the effect of streaks on the unstable eigenmodes of the unperturbed boundary layer. However, as the streak amplitude is increased, some of the stable (i.e. damped) modes of the original, axisymmetric boundary layer become increasingly less stable, and eventually, cross-over into the unstable portion of the spectrum. Indeed, at large enough streak amplitudes, these streak instabilities (denoted as SI modes following the nomenclature of Li et al.
Reference Li, Choudhari, Paredes and Duan2016) can become the most amplified modes, and hence, can dominate the process of laminar–turbulent transition. The PDE-based EVP analysis is used to obtain the growth rates (figure 14) and eigenfunctions (figure 15) of subharmonic and fundamental sinuous and varicose streak instability modes (SI
 $_{1/2,S}$
, SI
 $_{1/2,V}$
, SI
 $_{1,S}$
and SI
 $_{1,V}$
) at
 $\unicode[STIX]{x1D709}/L=1.0$
for the selected streak amplitudes. Figure 14 shows that the SI
 $_{1/2,S}$
mode is the first streak instability mode to become unstable for
 $A=0.20$
. The SI
 $_{1/2,S}$
is also the most unstable streak instability mode for streak amplitude parameters
 $A\leqslant 0.40$
. The SI
 $_{1,S}$
becomes unstable for
 $A=0.30$
and is the most amplified mode for
 $A=0.50$
. Varicose modes, SI
 $_{1/2,V}$
and SI
 $_{1,V}$
become unstable for
 $A=0.50$
. Summarizing, the SI
 $_{1/2,S}$
mode is the most unstable mode for moderate streak amplitudes and, therefore, may play an important role in the transition process. Mode shapes for each family at frequencies corresponding to peak local growth rate are shown in figure 15(a–d) for a streak amplitude parameter of
 $A=0.50$
. The streamwise velocity magnitude isocontours are rather similar between the fundamental and subharmonic sinuous modes, SI
 $_{1/2,S}$
and SI
 $_{1,S}$
, as well as between the varicose modes, SI
 $_{1/2,V}$
and SI
 $_{1,V}$
. These modes differ in the phase, which is observed in the real and imaginary parts of the mode shape perturbation. We note that, as shown by Dennisen & White (Reference Dennisen and White2011) and Choudhari et al. (Reference Choudhari, Li and Edwards2009) for low- and high-speed boundary layers, respectively, the streak instabilities for suboptimal streaks induced by discrete roughness elements can be more unstable for lower streak amplitudes than the optimal streaks studied herein.
Spatial growth rates (
 $-\unicode[STIX]{x1D6FC}_{i}$
) of streak instability modes (SI
 $_{1/2,S}$
, SI
 $_{1/2,V}$
, SI
 $_{1,S}$
and SI
 $_{1,V}$
) for selected streak amplitudes at
 $\unicode[STIX]{x1D709}/L=1.0$
.

Isocontours of real and imaginary parts and magnitude of streamwise velocity perturbations for
 $A=0.50$
at
 $\unicode[STIX]{x1D709}/L=1.0$
and frequencies (a)
 $\unicode[STIX]{x1D714}=0.0853$
for SI
 $_{1/2,S}$
, (b)
 $\unicode[STIX]{x1D714}=0.142$
for SI
 $_{1/2,V}$
, (c)
 $\unicode[STIX]{x1D714}=0.0967$
for SI
 $_{1,S}$
and (d)
 $\unicode[STIX]{x1D714}=0.119$
for SI
 $_{1,V}$
.

3.4.3 Overall effect on predicted transition onset
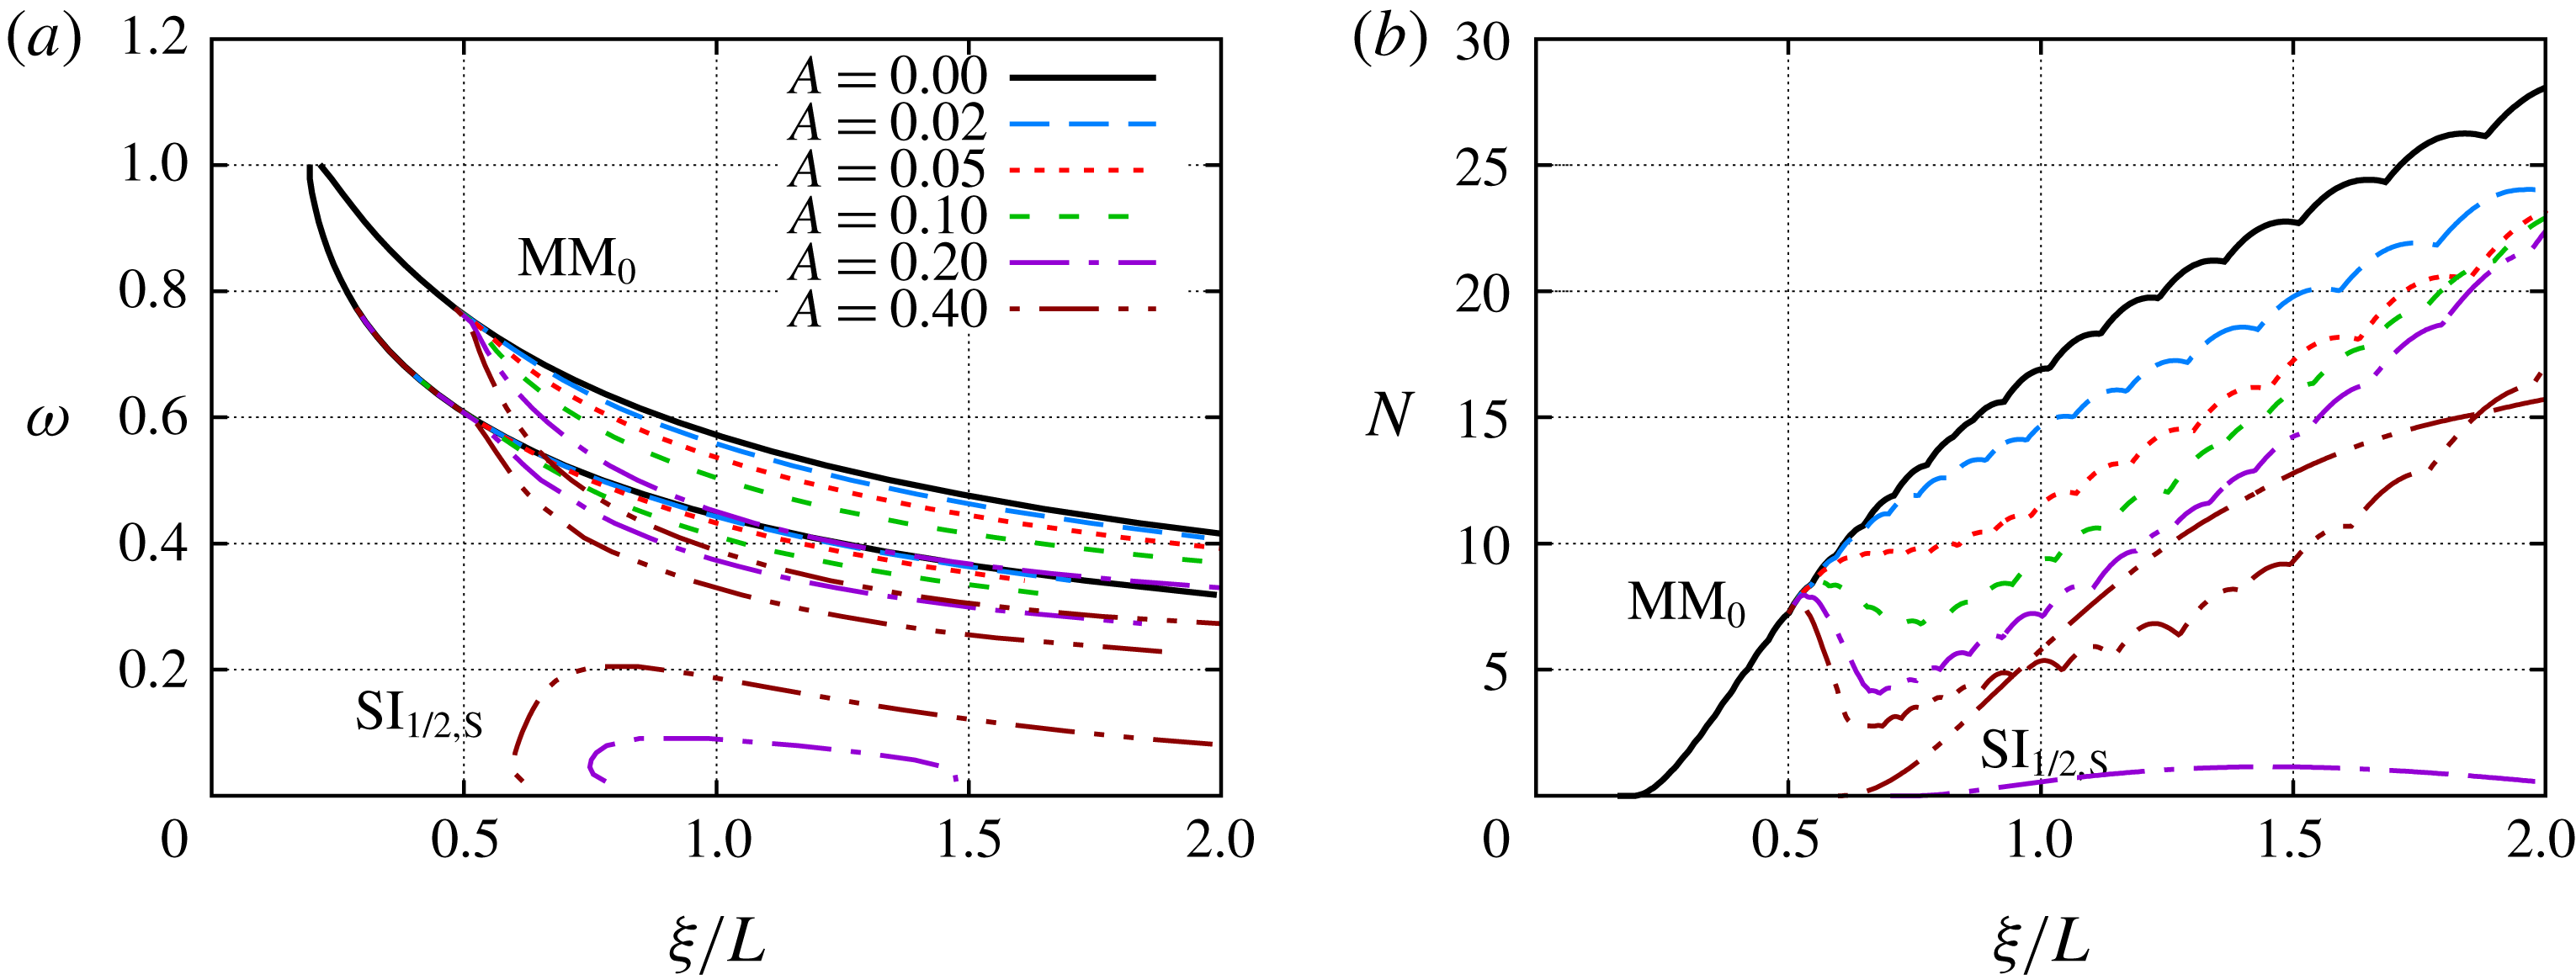
The overall effect of the streaks on the instability characteristics of the hypersonic boundary-layer flow is summarized in figures 16(a) and 16(b), where the neutral stability curves and the
 $N$
-factor envelopes, respectively, of the
 $\text{MM}_{0}$
and SI
 $_{1/2,S}$
modes are plotted for selected streak amplitudes. Figure 16(a) shows how the streaks affect the range of unstable frequencies. As explained in § 3.4.1, the neutral stability curves are displaced toward lower frequencies because the
 $\text{MM}_{0}$
mode shape concentrates on the crests of the modified flow (i.e. regions of increased boundary-layer thickness) as shown by figure 9(a). The sinuous subharmonic streak instabilities, which arise from the stable oblique first-mode disturbance with the same azimuthal wavelength, as documented by Paredes et al. (Reference Paredes, Choudhari and Li2016b
,Reference Paredes, Choudhari and Li
c
, Reference Paredes, Choudhari and Li2017a
) for supersonic and hypersonic boundary-layer flows, become unstable for streak amplitude parameter
 $A=0.20$
, with associated frequencies lower than those associated with the
 $\text{MM}_{0}$
mode. For each of the selected streak amplitudes, the stability regions of the
 $\text{MM}_{0}$
and SI
 $_{1/2,S}$
modes are separate from each other.
(a) Neutral stability curves and (b)
 $N$
-factor envelopes for planar Mack-mode disturbances (
 $\text{MM}_{0}$
) and sinuous, subharmonic streak instability modes (SI
 $_{1/2,S}$
).
The primary focus of this work corresponds to the stabilizing effect of streaks on Mack-mode disturbances, which have been shown to cause transition in the present flow configuration (Li et al.
Reference Li, Choudhari, Chang, Kimmel, Adamczak and Smith2015a
). For the conditions of the experiment (Kimmel et al.
Reference Kimmel, Adamczak, Paull, Paull, Shannon, Pietsch, Frost and Alesi2015), transition onset in the unperturbed cone boundary layer was measured to occur near
 $\unicode[STIX]{x1D709}_{tr}/L=0.85$
, where the peak
 $N$
-factor of the
 $\text{MM}_{0}$
modes is
 $N_{tr}=14.7$
. Selecting this value as the transition threshold, figure 16(b) shows how the transition onset due to
 $\text{MM}_{0}$
modes would be displaced downstream by the introduction of the finite-amplitude optimal disturbances. For the highest streak amplitude considered herein (
 $A=0.40$
with
 $\text{max}(As_{u})=0.34$
), the
 $\text{MM}_{0}$
modes reach the threshold
 $N$
-factor at
 $\unicode[STIX]{x1D709}_{tr,MM_{0}}/L=1.84$
, although the sinuous, subharmonic streak instability SI
 $_{1/2,S}$
reaches the threshold
 $N$
-factor at
 $\unicode[STIX]{x1D709}_{tr,SI_{1/2,S}}/L=1.76$
. Assuming that the threshold
 $N$
-factor is equivalent for Mack mode and streak instabilities, the laminar flow region would be
 $2.07$
times larger than for the unperturbed case. These results for high altitude conditions present an interesting comparison with the findings by Paredes et al. (Reference Paredes, Choudhari and Li2016b
) for a
 $7^{\circ }$
half-angle circular cone at the flow conditions of a ground test experiment in the VKI H3 hypersonic tunnel (Grossir, Musutti & Chazot Reference Grossir, Musutti and Chazot2015), namely
 $M_{\infty }=6$
,
 $Re^{\prime }=18\times 10^{6}~\text{m}^{-1}$
,
 $T_{\infty }=60.98$
K and wall-to-adiabatic temperature ratio equal to
 $T_{w}/T_{w,ad}=0.68$
. In the case of Paredes et al. (Reference Paredes, Choudhari and Li2016b
), the higher value of the
 $T_{w}/T_{w,ad}$
allows for the growth of oblique first-mode instability waves, which are destabilized by the presence of the streaks and eventually become the streak instability modes. The amplification due to the modulated unstable first-mode waves leads to a lower threshold streak amplitude beyond which streak instability becomes the dominant cause for the onset of transition. Paredes et al. (Reference Paredes, Choudhari and Li2016b
) predicted that the subharmonic sinuous mode dominates the transition onset above
 $A\approx 0.20$
for the ground test case with
 $T_{w}/T_{w,ad}=0.68$
, while the streak amplitude analogous value of threshold for the flight test case with
 $T_{w}/T_{w,ad}=0.35$
is
 $A\approx 0.40$
as observed in figure 16(b).
The
 $N$
-factor threshold to cause transition can be lower in the presence of the streaks than that in the uncontrolled case. The present analysis is solely based on the effect of the streaks on the linear amplification stage and because of the role of the streaks (or the device used to excite those streaks) on the receptivity and/or nonlinear phases of transition, lower
 $N$
-factors at the onset of transition can be possible. However, the results in figure 16(b) suggest that even if the transition
 $N$
-factor for the boundary layer with streaks were to be as low as
 $N=10$
(as against the value of
 $N=14.7$
in the uncontrolled case), transition onset may still be delayed until
 $\unicode[STIX]{x1D709}/L=1.34$
for a streak amplitude of
 $A=0.30$
.
The present results show a potential increase in the length of the laminar flow that is comparable to the length of the laminar region in the unperturbed case, i.e. the laminar flow acreage is potentially doubled. Considering that the ratio of local skin friction coefficients for turbulent and laminar flows is in the range of
 $c_{f,tur}/c_{f,lam}\in [5,7]$
(Schlichting Reference Schlichting1979), the maximum total skin friction reduction for the present geometry with a total length corresponding to
 $Re_{L_{c}}=26.84\times 10^{6}$
, at the present flow conditions (
 $M_{\infty }=5.3$
,
 $Re^{\prime }=13.42\times 10^{6}~\text{m}^{-1}$
,
 $T_{w}/T_{w,ad}=0.35$
) and with a transition threshold of
 $N=14.7$
, would be of the order of
 $60\,\%$
relative to the unperturbed case. As mentioned in the preceding paragraph, even if one assumes that transition in the controlled flow occurs at a significantly lower
 $N$
-factor of
 $10$
(instead of at
 $N=14.7$
in the baseline case), the total reduction in skin friction would still be approximately 35 per cent. Based on Reynolds analogy, comparable reduction may also be expected in the total heat load experienced by the cone surface.
3.4.4 Effect of streak wavenumber on transition onset
A parameter study for additional streak wavenumbers
 $m_{ST}$
is conducted to help with identifying the optimal flow control setting to maximize the transition delay for a given flow configuration. Figure 17(a) shows the evolution of
 $N$
-factor envelopes for the unperturbed boundary layer (
 $A=0.00$
) and the perturbed boundary layers for a streak amplitude parameter of
 $A=0.10$
and selected azimuthal wavenumbers. Note that the initial streak disturbance amplitude
 $A_{0}$
is different for each perturbed case with selected azimuthal wavenumbers following (3.4). The
 $N$
-factor envelope curves show a strong effect of the streak azimuthal wavenumber. For the azimuthal wavenumber (
 $m_{ST}=135$
) smaller than the optimal streak wavenumber (
 $m_{ST}=m_{op}=180$
), the
 $N$
-factor values are larger than those corresponding to
 $m_{ST}=m_{op}$
along most of the streamwise domain, but slightly smaller near the initial disturbance location (
 $\unicode[STIX]{x1D709}_{0}/L=0.5$
). For the present configuration, streaks with
 $m_{ST}<m_{op}$
would be less effective for transition delay than
 $m_{ST}=m_{op}$
. For azimuthal streak wavenumbers larger than
 $m_{op}$
, the effect of the streaks is weaker near the initial disturbance location, resulting in larger
 $N$
-factor values than those corresponding to the
 $m_{ST}=m_{op}$
case, but the
 $N$
-factor values decrease further downstream and the
 $N$
-factor envelopes for
 $m_{ST}>m_{op}$
remains below that corresponding to
 $m_{ST}=m_{op}$
along most of the domain. Streak instabilities were not found for any of the selected cases, even though the initial disturbance amplitude at these suboptimal wavenumbers must be larger than that for
 $m_{ST}=m_{op}$
in order to reach the same maximum streak amplitude. Therefore, for the same value of maximum streak amplitude, streaks with azimuthal wavenumbers larger than that are larger than the wavenumber corresponding to optimal transient growth are likely to result in a longer delay in the onset of transition. To help determine the most convenient streak azimuthal wavenumber for transition delay, figure 17(b) shows the predicted transition location as a function of the azimuthal wavenumbers for optimal disturbances initiated at
 $\unicode[STIX]{x1D709}/L=0.5$
with same streak amplitude parameter
 $A=0.10$
and with same initial amplitude
 $A_{0}$
, which is set to the relatively modest value for
 $A=0.10$
with
 $m_{ST}=m_{op}=180$
. Results show that the streaks with
 $m_{ST}=256$
(
 $m_{ST}=1.42\,m_{op}$
) lead to a further downstream displacement of the transition location with same initial amplitude; specifically, the predicted transition location is
 $\unicode[STIX]{x1D709}_{tr}/L=1.39$
for
 $m_{ST}=m_{op}=180$
and
 $\unicode[STIX]{x1D709}_{tr}/L=1.52$
for
 $m_{ST}=256$
with same initial amplitude
 $A_{0}$
.
(a)
 $N$
-factor envelopes for the unperturbed boundary-layer flow (
 $A=0.00$
) and for perturbed boundary-layer flows with
 $A=0.10$
and selected streak azimuthal wavenumbers
 $m_{ST}=135$
,
 $180$
,
 $270$
,
 $360$
,
 $450$
and
 $540$
. (b) Effect of predicted transition location with streak azimuthal wavenumber for same streak amplitude parameter
 $A=0.10$
, and for same initial disturbance amplitude
 $A_{0}$
corresponding to
 $A=0.10$
for
 $m_{ST}=m_{op}=180$
. The experimentally measured transition location for the unperturbed case (
 $A=0.00$
) is included. The suffix
 $ST$
is excluded in the figures for simplification.
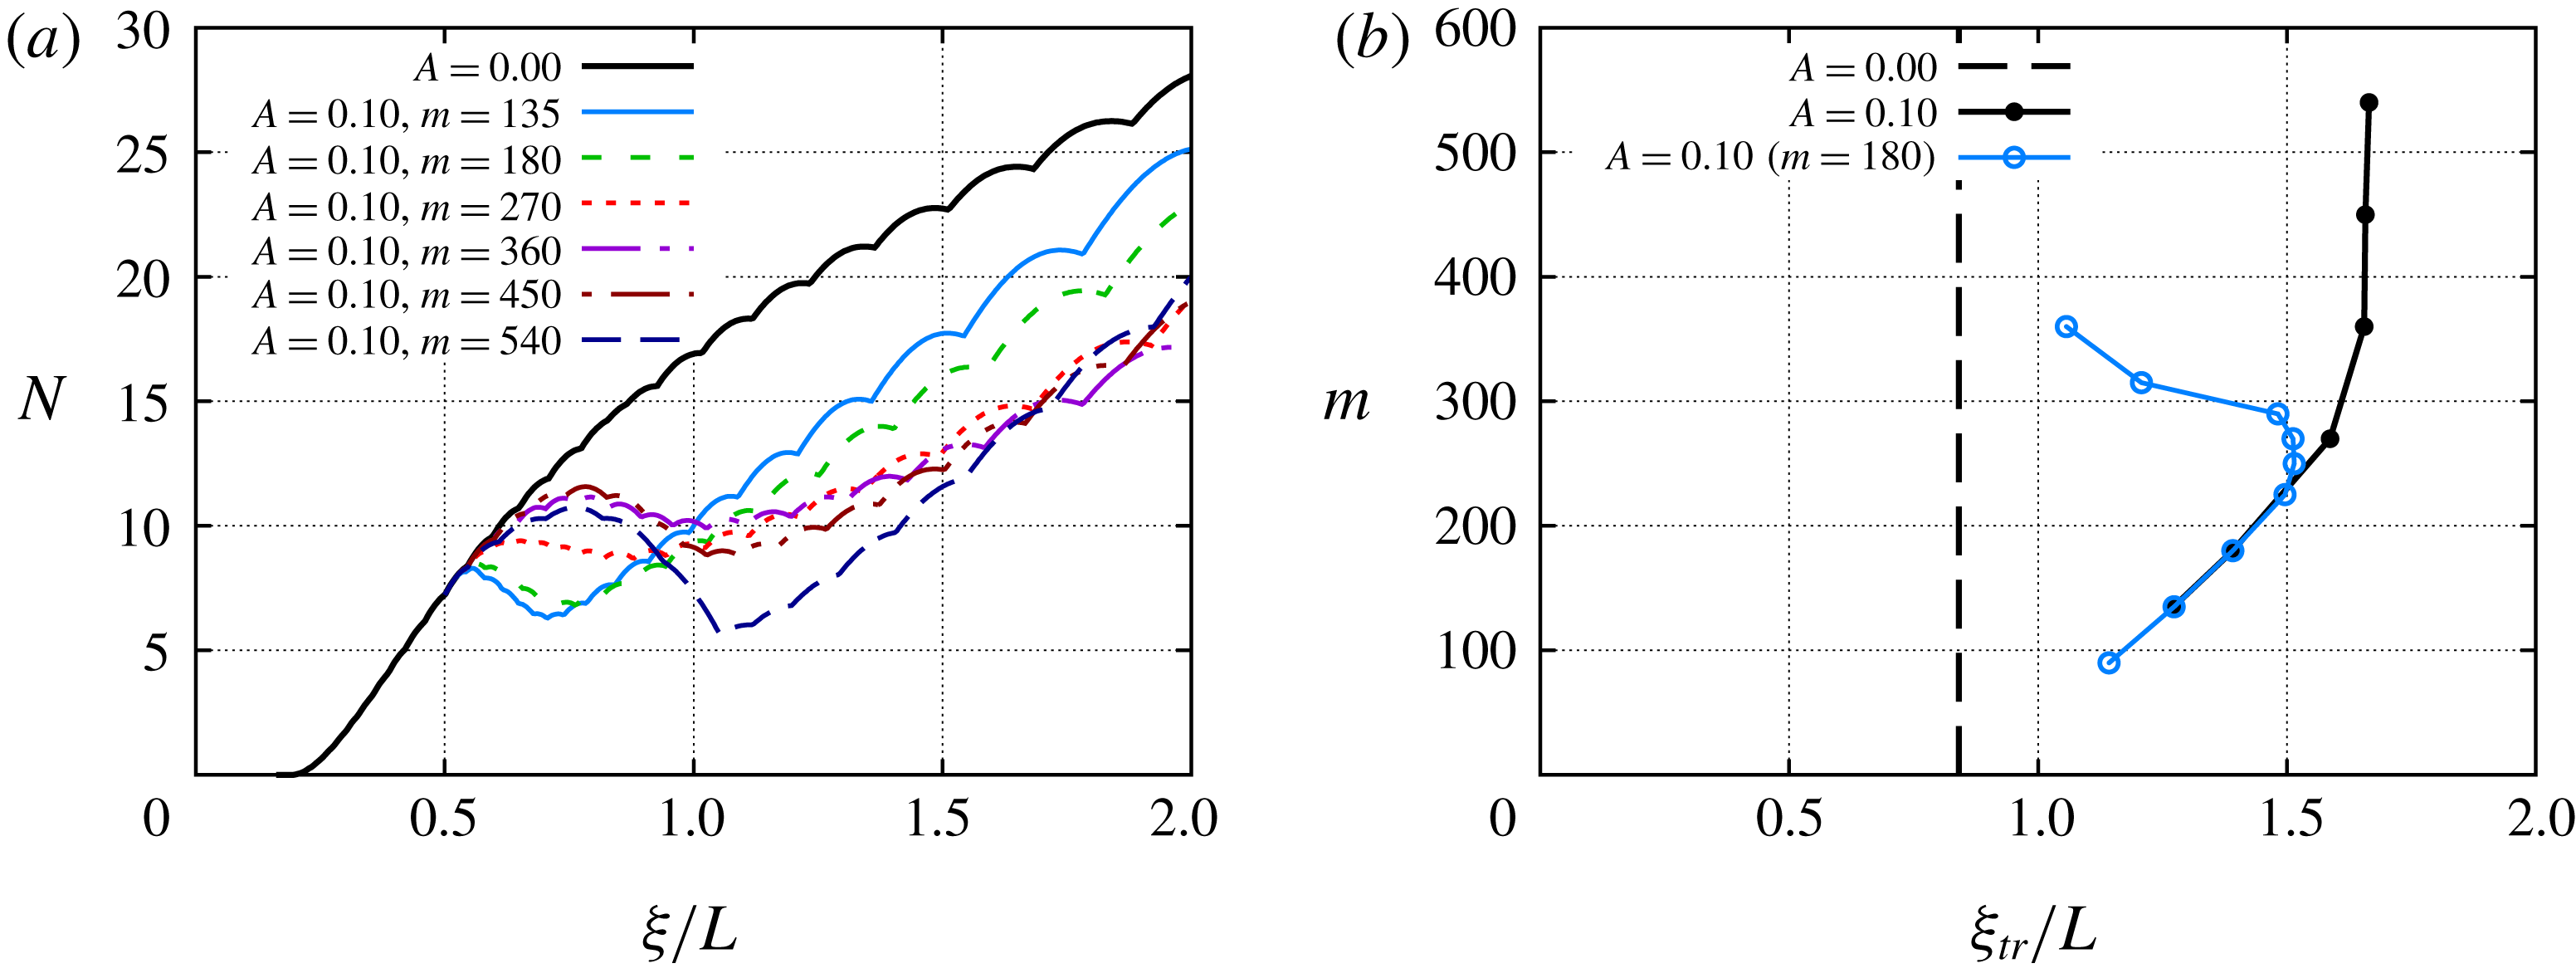
4 Summary and concluding remarks
Optimal growth theory based on the stationary form of parabolized stability equations (PSE) is used to identify the range of modulating wavenumbers that would benefit the most from the intrinsic ‘lift-up’ mechanisms within a high-speed boundary-layer flow over a
 $7^{\circ }$
half-angle circular cone at zero angle of attack. The plane-marching PSE have been used to monitor the nonlinear disturbance evolution of finite-amplitude, linearly optimal perturbations. Subsequently, the linear stability characteristics of the perturbed streaky boundary-layer flow are studied using the linear form of the plane-marching PSE. The present results have demonstrated that the introduction of finite-amplitude optimal growth streaks in a Mach
 $5.3$
axisymmetric flow over a cone at realistic flight conditions from the HIFiRE-1 experiment will reduce the peak linear amplification of boundary-layer instabilities, indicating the possibility of a delayed onset of laminar–turbulent transition. The current predictions show that the planar Mack-mode waves are the most amplified instabilities for both the unperturbed and perturbed cases up to a threshold amplitude of the stationary streaks. A detailed analysis of the primary mechanism for the effect of the streaks on the reduced amplification of the planar Mack modes provides further evidence that the MFD of the nonlinear stationary streak perturbation has a stabilizing effect on the Mack modes as previously reported by Ren et al. (Reference Ren, Fu and Hanifi2016) for small streak amplitudes and by Paredes et al. (Reference Paredes, Choudhari and Li2016b
) for a broad range of streak amplitudes. More interestingly, however, the present calculations demonstrate that the spanwise varying component of the stationary streak has an even larger effect of the amplification characteristics of the Mack modes. Yet, in general, the production of disturbance kinetic energy associated with the boundary layer instabilities is dominated by the wall-normal gradients of the boundary layer flow with or without the streaks. For sufficiently large streak amplitudes, intrinsic instabilities of the streaks can reach the threshold
 $N$
-factor for transition onset before the Mack-mode instabilities.
The results indicate that, if suitable stationary disturbances can be excited in the originally axisymmetric boundary-layer flow, then the net stabilization of planar Mack-mode instabilities due to the stationary streaks may lead to a notable delay in transition onset, provided that the
 $N$
-factor values correlating with transition onset remain similar in both unperturbed and perturbed cases. The streaks with azimuthal wavenumber corresponding to the optimal transient growth yield a downstream movement of the laminar–turbulent transition onset that is comparable to the uncontrolled transition length, which translates into a reduction of the total skin friction of the order of the 60 % relative to the uncontrolled case. Furthermore, the parametric study for additional streak wavenumbers has shown that a larger streak wavenumber of approximately 1.4 times the optimal growth value, may actually result in an increased delay in transition.
Detailed laboratory experiments are required to establish the effect of streaks, if any, on the
 $N$
-factor correlation. The physical source responsible for the excitation of transient growth disturbances has not been addressed in this study and, in turn, the effect of this source on the generation (i.e. receptivity) of the unsteady modal instabilities is also not addressed in the present investigation. The disturbances induced via wall-mounted devices would have shorter wall-normal extensions than the optimal disturbances and therefore their effect on the boundary-layer instabilities may differ from that presented herein. A study of both these aspects would represent an important extension of the present work.
Acknowledgements
This research was sponsored by the NASA Transformational Tools and Technologies (TTT) Project of the Transformative Aeronautics Concepts Program under the Aeronautics Research Mission Directorate. Resources supporting this work were provided by the NASA High-End Computing (HEC) Program through the NASA Advanced Supercomputing (NAS) Division at Ames Research Center.