Implications
This study found that a one cow/ha increase in stocking rate (SR) reduced milk production per cow by 8.7%, whereas production per hectare (ha) was increased by 19.6%. The results indicate that the classical definition of SR as animals per unit area of land (cows per ha) is inadequate to describe the effect of an SR change on milk production per cow. The results suggest that SR treatments may be defined as feed or energy available per cow, whereas the effects of an SR change may be characterised as the change in feed or energy supply to animals within each treatment.
Introduction
One of the primary objectives of pasture-based dairy producers is to maximise profitability per hectare (ha) of grazing land through increased pasture production and utilisation (Dillon et al., Reference Dillon, Hennessy, Shalloo, Thorne and Horan2008). Improvements in management within such systems have resulted in large increases in milk production per ha in experimental herds. For example, Horan et al. (Reference Horan, Dillon, Faverdin, Delaby, Buckley and Rath2005) reported annual production of 15 000 kg milk/ha from <500 kg of concentrates per cow. The main inter-relating factors responsible for this increase in productivity appear to be the stocking rate (SR) and calving date (Dillon et al., Reference Dillon, Crosse, Stakelum and Flynn1995; Macdonald et al., Reference Macdonald, Penno, Lancaster and Roche2008), nitrogen (N) fertilisation (Delaby et al., Reference Delaby, Peyraud, Bouttier and Peccatte1998; McGrath et al., Reference McGrath, Penno, Macdonald and Carter1998) and concentrate supplementation (Bargo et al., Reference Bargo, Muller, Delahoy and Cassidy2002). SR, traditionally defined as the number of animals fed per unit area of land during a defined period (cows per ha), is widely accepted as the most important factor governing milk output per cow and per unit area from pasture (Mott, Reference Mott1960; McMeekan, Reference McMeekan1964; Penno, Reference Penno1999). The balance between feed supply and demand as influenced by SR, and to a lesser extent by calving date, is critical because an imbalance will result in either underfeeding of the herd or waste of excess feed. In grazing systems, this interaction is further complicated as over/undergrazing of the pasture will result in reduced growth, senescence or reduced nutritional value of the main feed supply (Holmes et al., Reference Holmes, Wilson, Mackenzie, Flux, Brookes and Davey2002).
Previous research has indicated that an SR increase results in an increase in milk production per ha, but a decrease in milk production per cow (McMeekan and Walshe, Reference McMeekan and Walshe1963; Hoden et al., Reference Hoden, Peyraud, Muller, Delaby and Faverdin1991). The most recent SR experiment undertaken by Macdonald et al. (Reference Macdonald, Penno, Lancaster and Roche2008) reported that all per cow milk production variables, with the exception of fat and lactose content, declined linearly with increasing SR. The authors summarised that the reduction in per cow yield variables was due to the shortening lactation length and the lower peak and poorer persistency associated with increased SR and was a consequence of a lower total amount of feed available per cow, as more cows were carried on the same area.
SR determines how much of the available herbage is eaten by the herd, with a greater percentage of the available herbage harvested by the herd at increased SRs (McMeekan, Reference McMeekan1964). Macdonald et al. (Reference Macdonald, Penno, Lancaster and Roche2008) indicated a positive effect of increasing SR on milk yield per ha, irrespective of the effect on milk yield per cow. However, results from a single experiment will not provide a definitive understanding of the effect of SR treatment because the conditions under which observations are made in a single experiment are inevitably narrow (Sauvant et al., Reference Sauvant, Schmidely, Daudin and St-Pierre2008). A meta-analysis approach (Glass, Reference Glass1976), summarising the results across published studies in a particular area and in combination with new statistical techniques, allows increased precision of analysis of effects across multiple experiments (St-Pierre, Reference St-Pierre2001; Sauvant et al., Reference Sauvant, Schmidely, Daudin and St-Pierre2008; Lean et al., Reference Lean, Rabiee, Duffield and Dohoo2009). In a historical review of SR experiments, Journet and Demarquilly (Reference Journet and Demarquilly1979) reported that an SR increase of one cow/ha resulted in a mean reduction in milk production per cow of 10%, but an increase in production per ha of over 20%. Increased interest in pasture-based production systems internationally, coupled with the increased volume of research data from modern SR experiments now available, requires that the likely effect of an SR change on milk production be revisited. The objective of this study, therefore, is to quantify the milk production response per cow and per ha associated with an SR change, from a low SR, based on a meta-analysis of experiments from 1960 to 2008, taking cognisance of changes in management systems such as grazing management practice, supplementation strategy, lactation length and dairy cow characteristics.
Material and methods
Database design, construction and calculations
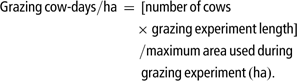
The database is best conceptualised with rows representing treatments or groups, whereas the columns initially consist of measured variables (those for which least square means are reported) in addition to treatment characteristics (class levels). Each experiment was allocated an individual experimental code (IdExp). For consideration within the database, an experiment had to contain a comparison of at least two SRs under the same experimental conditions. Where a sub-factor was applied to each SR (e.g. different supplementation or N fertilisation levels) or multiple years of data were reported, each individual SR response result was entered individually. Required experimental data included experimental length, grazing cow-days/ha, the various SR, milk production and bodyweight (BW) results per cow and per ha. Occasionally, measured variables such as grazing cow-days/ha or SR were not reported and were subsequently calculated according to formulas:

The database contained a number of variables that were not consistently reported in each experiment. Frequently, only milk yield per cow per day was reported, and milk yield per ha was then derived according to the formula:

As the objective of the study was to analyse the effect of an SR increase from a low SR, within the database, the lowest SR treatment within each experiment was considered the base SR (b_SR), with the milk production at this SR considered as base milk production. The choice of variable to standardise measurement methods across experiments is very important within this analysis to identify the true effect of an SR change, across a diverse group of experiments exhibiting large variation in both systems and animals. For this reason, in addition to the actual reported production, each additional increased SR treatment was described in terms of the relative milk production change per cow per ha compared to the base group. This new variable removed the effect of variation in base performance, experimental length and amount of supplementary feed usage between studies. On review of the experimental evidence, large variability in animal BW was observed both over time and also between experiments. Consequently, to account for this variability and the likely impact on maintenance requirements, in studies where BW information was reported, each SR was also described in terms of BW/ha within the analysis according to the equation:

The effect of an SR change was therefore also described in terms of an additional 100 kg BW/ha. As consistent feed supply data (herbage and total dry matter allowances) were unavailable from the reviewed papers, the change in the energy status per cow across treatments was described according to the energy supply within the b_SR treatment of each experiment (estimated according to the energy requirements for maintenance and production using the net energy system (Faverdin et al., Reference Faverdin, Delagarde, Delaby and Meschy2007)), divided by the increased SR to reflect the reduction in energy status of each cow within an increased SR treatment. This new variable represented the change in energy status of the individual animal according to SR change.
The final database contained 44 papers and 109 experiments published between 1960 and 2008, with 131 comparisons of base v. experimental SR used in the final analysis. The mean experiment was 228 days in duration, with 55 cows and a mean SR of 3.7 cows/ha (1879 kg BW/ha). A range of experimental designs was represented in the database including 94 continuous and 10 Latin square designs. The majority of studies used in the database were from Ireland, New Zealand, Australia, France or the United Kingdom.
For analytical purposes, two main subsets of data were created. In common experimental length (Type I) experiments, the experimental period was common to all SRs within the respective experiment (36 papers and 91 experiments), that is, the length of time that each SR within an experiment was applied was the same, with the SR effects observed due to variations in consistently applied feed allowances. Type I experiments reflect the stocking intensity during the grazing season and contain both short- and long-term experiments. These long-term stocking intensity experiments, however, did not cause differences in experimental lengths for the different stocking intensities within that experiment. In variable length (Type II) experiments (eight papers and 18 experiments), the length of the experimental period varied between SR treatments within the respective experiment. These Type II experiments reflect the overall SR at farm level and are therefore a truer reflection of the effect of SR, incorporating both the effects of a reduced herbage allowance and an associated reduction in lactation length.
Statistical analysis
A study effect (IdExp) representing the variance between studies not accounted for by the variables in the model was included in each model, as described by St-Pierre (Reference St-Pierre2001) and more recently by Sauvant et al. (Reference Sauvant, Schmidely, Daudin and St-Pierre2008). The actual change of independent variable in milk production according to SR change was continuous in nature and analysed using linear mixed models by the statistical procedures software of SAS (Proc MIXED, Statistical Institute, 2006), with IdExp included as a random effect and an unstructured variance–covariance structure among records according to the equation:

where, Ry is the predicted production of variable y in response to SR change, a is the intercept, IdExp is the study effect (i = 1 to 91 for Type I and 1 to 18 for Type II experiments), b represents the linear coefficient and c represents the quadratic coefficient. Where c was observed to be greater than P = 0.10, it was removed from the analysis.
The predicted proportional change in milk production (P y) was created using the statistical procedures software of SAS (Proc MIXED, Statistical Institute, 2006) according to the equation:

where, Py is the proportional change in variable y according to SR change (d_SR), base milk production per cow (b_X) and b_SR, a is the intercept, b represents the coefficient for the base milk production per cow, c represents the coefficient for the b_SR and d represents the coefficient for SR change. Where b, c and d were observed to be greater than P = 0.10, they were removed from the analysis, with the exception of b_SR (P = 0.115) for proportional change in milk yield per cow and b_SR (P = 0.118) for proportional change in lactose yield per cow, which were kept in the model.
Results
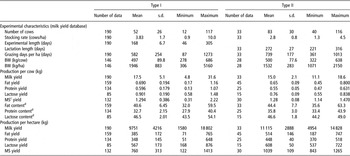
The mean experimental characteristics, production per cow per ha for each data set (Type I and Type II) are outlined in Table 1. Experimental characteristics for both the Type I and Type II data sets are calculated based on milk yield, as this variable contains the greatest number of data points in the Type I data set. The mean SR of the Type I data was 3.8 cows/ha, with a mean daily milk yield per cow and per ha of 17.5 and 9751 kg, respectively. The mean experimental length, grazing cow-days/ha and number of cows used in experiments was 168, 582 days and 52 cows, respectively. Within the Type II data set, the mean SR was 2.8 cows/ha, which resulted in a mean daily milk yield per cow and per ha of 15.0 and 11 115 kg, respectively. The mean grazing cow-days/ha and number of cows used in the experiments was 739 days and 83 cows, respectively. The mean lactation length of experiments within the Type II data set was 272 days.
Mean production data for the database for Type IFootnote a and Type IIFootnote b experimental data

MS = milk solids.
a Type I = common length experiments.
b Type II = variable length experiments.
c MS = fat + protein.
d Values are expressed in g/kg.
Effect of increasing SR and BW/ha on milk production for Type I data
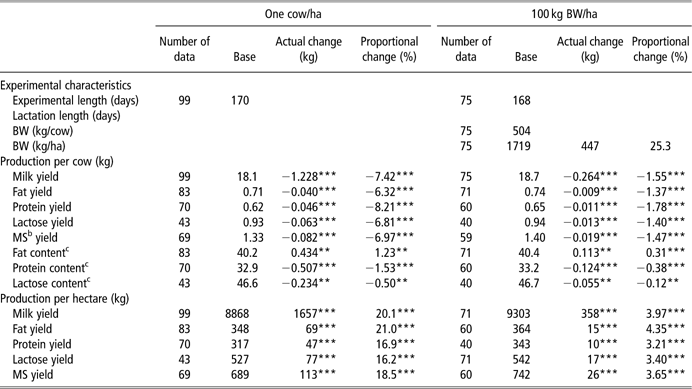
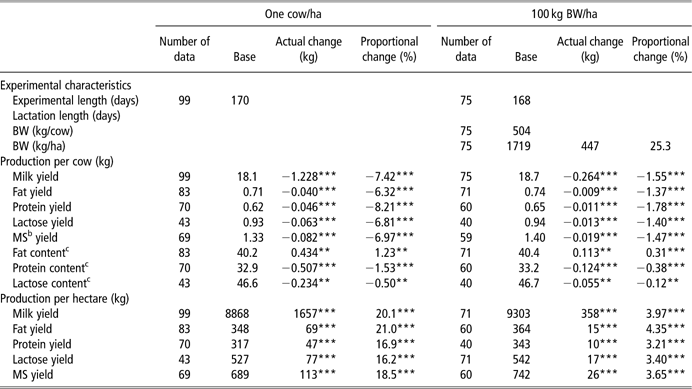
The total number of data comparisons for milk production was 121 for SR expressed as cows per ha and 90 for SR expressed as 100 kg BW/ha. The effect of a one cow/ha increase in SR and a 100 kg increase in BW/ha on milk production per cow and per ha for Type I data is outlined in Table 2. Mean daily milk and milk solids (fat + protein; MS) yield per cow for the b_SR were 18.1 and 1.33 kg, respectively. For all milk yield variables analysed, production per cow reduced (P < 0.05) and milk production per ha increased (P < 0.05), when SR increased by one cow/ha and BW/ha by 100 kg. Within the Type I data in which experimental length was common to all SRs, mean daily milk and MS yield per cow were reduced by 1.23 and 0.08 kg, respectively, whereas milk and MS yield per ha were increased by 1657 and 113 kg, respectively. A one cow/ha SR increase resulted in a decrease in daily milk, fat, protein, lactose and MS yield per cow of 7.4%, 6.3%, 8.2%, 6.8% and 7.0%, respectively, and an increase in milk, fat, protein, lactose and MS yield per ha of 20.1%, 21.0%, 16.9%, 16.2% and 18.5%, respectively. The impact of a one cow/ha SR increase was not consistent for fat, protein and lactose content, as milk fat content was increased by 1.2%, whereas milk protein and lactose content were reduced by 1.5% and 0.5%, respectively. An increase in BW/ha of 100 kg reduced per cow yields for milk production variables by a mean value of 1.52%, whereas per ha yields increased by 3.72%. As with a one cow/ha SR increase, a 100 kg increase in BW/ha increased milk fat content and reduced milk protein and lactose content.
Change in experimental length, milk production per cow and per ha for an increase in stocking rate of one cow/ha for and 100 kg BW/ha for Type IFootnote a experimental data
MS = milk solids.
a Type I = common length experiments.
b MS = fat + protein.
c Values are expressed in g/kg.
** = P < 0.01.
*** = P < 0.001.
Effect of increasing SR and BW/ha on milk production for Type II data
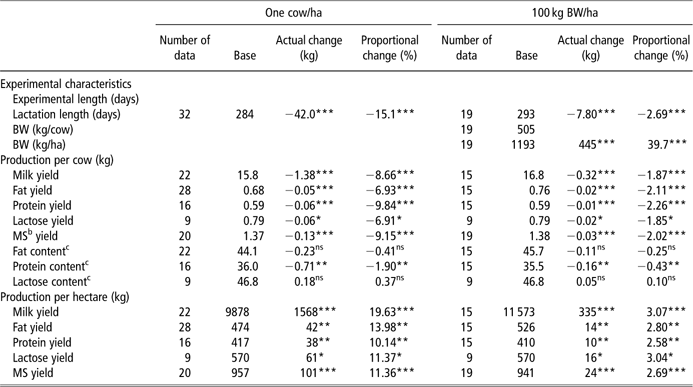
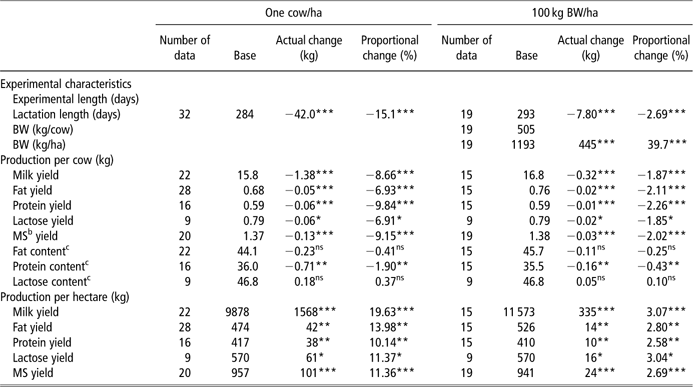
Table 3 describes the effect of a one cow/ha increase in SR and a 100-kg increase in BW/ha on milk production per cow and per ha for Type II data. Mean daily milk and MS were 15.8 and 1.37 kg, respectively. Similar to the results for Type I data, a one cow/ha increase in SR and a 100 kg increase in BW/ha reduced milk production per cow (P < 0.05) and increased milk production per ha (P < 0.05) for Type II data. Within the Type II data set, a one cow/ha SR increase reduced lactation length by 15.1% (equivalent to 42 days). A one cow/ha SR increase resulted in a reduction in daily milk and MS yield of 1.38 and 0.13 kg/cow, whereas increasing milk and MS yield per ha by 1568 and 101 kg, respectively. The reduction in daily milk yield variables per cow was greater, when compared to Type I data, as daily milk, fat, protein, lactose and MS were reduced by 8.7%, 6.9%, 9.8%, 6.9% and 9.2%, respectively. In comparison with the Type I data set, the increase in milk production per ha due to a one cow/ha SR increase in the Type II data set were less, with daily milk, fat, protein, lactose and MS yield per ha increases of 19.6%, 14.0%, 10.1%, 11.4% and 11.4%, respectively. Milk fat and lactose content were unaffected by a one cow/ha SR increase, whereas protein content was reduced by 1.9%. A 100-kg increase in BW/ha decreased lactation length by 2.69% (equivalent to 7.8 days). Similar to a one cow/ha increase in SR, daily milk yield per cow variables were reduced to a greater extent for Type II data compared to Type I data, whereas the increase in milk yield per ha variables was less. Mean daily milk yield variables per cow declined by 2.02% and milk yield per ha variables increased by 2.84%. Increasing BW/ha by 100 kg had no effect on milk fat and lactose content, whereas milk protein content was reduced by 0.43%.
Change in experimental length, milk production per cow and per ha for an increase in stocking rate of one cow/ha and 100 kg of BW/ha for Type IIFootnote a experimental data
MS = milk solids.
a Type II = variable length experiments.
b MS = fat + protein.
c Values are expressed in g/kg.
* = P < 0.05.
** = P < 0.01.
*** = P < 0.001.
ns = P > 0.05.
The prediction of milk production according to SR change (Type I experimental data) and lactation length (Type II experimental data)
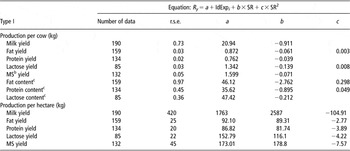
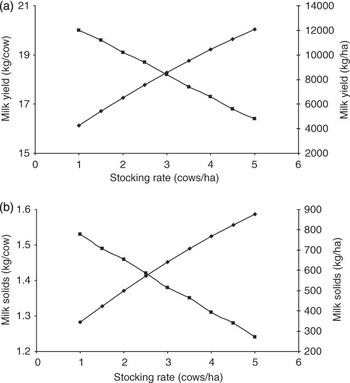
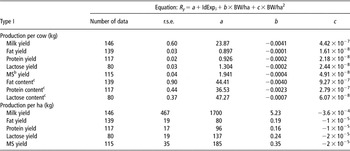
The equations that accounted for the greatest proportion of variation in predicted milk production per cow and per ha are described in Table 4 (and Figure 1). The residual standard error (r.s.e.) is low at 0.73 for milk yield, indicating a good precision of the predictive equations. With the exception of milk, protein and MS yield per cow and lactose content, quadratic equations accounted for the greatest proportion of the variance. On the basis of the predictive equations in Table 4, a one cow/ha SR increase resulted in a mean proportional reduction of 4.9%, 5.6%, 5.9%, 8.6% and 5.0% for daily milk, fat protein, lactose and MS yield per cow, respectively, whereas increasing yield per ha by 26.3%, 24.7%, 22.3%, 22.1% and 23.7%, respectively.
Effect of SR on milk production variables for Type IFootnote a experimental data

SR = stocking rate; MS = milk solids.
Ry = a + IdExpi + b × SR + c × SR2, where: a = origin, IdExp = experimental effect, b = linear coefficient and c = slope.
a Type I = common length experiments.
b MS = fat + protein.
c Values are expressed in g/kg.
Effect of a change in stocking rate on (a) milk production per cow (▪) and per hectare (ha) (⧫) and (b) milk solids per cow (▪) and milk solids per ha (⧫) according to stocking rate (Type I experimental data).

Predictive equations for daily milk yield per cow variables and milk yield per ha variables as a function of BW/ha are shown in Table 5. All equations were quadratic. On the basis of the predictive equations in Table 5, a 100-kg increase in BW/ha resulted in a mean proportional reduction of 1.5%, 1.3%, 1.9%, 1.6% and 1.7% for daily milk, fat, protein, lactose and MS yield per cow, respectively, whereas increasing production per ha by 5.8%, 5.7%, 4.9%, 4.8% and 5.2%, respectively. Similar to the effect of an SR change, all daily milk production variables, with the exception of fat content, declined while milk production per ha increased when BW/ha increased by 100 kg. The slope of the equations generated differs from those calculated according to a one cow/ha SR increase (Table 4), indicating a possible interaction between animal size and milk production response to an SR change. This effect has previously been observed (Ahlborn and Bryant, Reference Ahlborn and Bryant1992; Holmes et al., Reference Holmes, Wilson, Kuperus, Buvaneshwa and Wickham1993) and is further substantiated by Lopez-Villalobos et al. (Reference Lopez-Villalobos, Berry, Horan, Buckley, Kennedy, O’Donovan, Shalloo and Dillon2008) using data from Irish pasture-based systems. These authors suggested that increased feed conversion efficiency among phenotypically lighter cows was responsible for increased MS production at greater SRs in comparison with heavier cows.
Effect of BW/ha on milk production variables for Type IFootnote a experimental data

MS = milk solids.
Ry = a + IdExpi + b × BW/ha + c × BW/ha2, where: a = origin, IdExp = experimental effect, b = linear coefficient and c = slope.
a Type I = common length experiments.
b MS = fat + protein.
c Values are expressed in g/kg.
The predicted effect of SR on lactation length was derived from Type II data using the following equation:

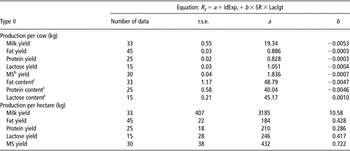
The prediction equation (r.s.e. = 12.5) indicates that a one cow/ha increase in SR will result in a 40-day decline in lactation length. Predictive equations for daily milk production per cow and per ha were derived separately for experiments differing in lactation length (Type II experimental data; Table 6). On the basis of these equations, a one cow/ha SR increase will result in a mean reduction of 5.3% and 7.4% in milk and MS production per cow, respectively, while increasing milk and MS yield per ha by 17.3% and 13.1%, respectively. The reduction in lactation length observed within Type II data has been observed previously. MacDonald et al. (Reference Macdonald, Penno, Lancaster and Roche2008) attributed a large portion of the reduction in milk production per cow to a reduction in lactation length, while Holmes et al. (Reference Holmes, Wilson, Kuperus, Buvaneshwa and Wickham1993) similarly reported a shortening of lactation length at increased SRs due to reduced feed supply and a requirement for an extended dry interval among animals of reduced body condition score.
Effect of SR and Laclgt on milk yield per cow and per ha (Type IIFootnote a experimental data)

SR = stocking rate; Laclgt = lactation length; MS = milk solids.
Ry = a + IdExpi + b × SR × Laclgt, where: IdExp = experimental effect, a = origin, b = slope.
a Type II = variable length experiments.
b MS = fat + protein.
c Values are expressed in g/kg.
The prediction of milk production according to base production per cow, b_SR and SR change (Type I experimental data)
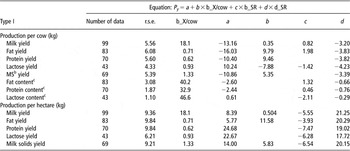
Predicted proportional change in milk production per cow and per ha is described in Table 7 according to base group productivity per cow, b_SR and SR change. In this analysis, the base production variable was not significant (P > 0.10) when describing the proportional change in production (P y) for fat, protein and lactose content per cow; protein and lactose yield per ha and was therefore excluded for these variables. The b_SR was not significant (P > 0.15) when describing the proportional change in production (P y) for protein and MS yield per cow and was also removed from these equations. For a one cow/ha SR increase from a b_SR of 3.5 cows/ha, the proportional reduction in milk, fat, protein, lactose and MS yield per cow was 7.1%, 6.0%, 8.4%, 6.3% and 7.1%, respectively, whereas the proportional increase per ha was 19.3%, 20.5%, 17.6%, 18.4% and 19.0%, respectively. These effects correspond to a 1.3% increase in fat content and a reduction of protein content of 1.6%, while lactose content was unaffected.
Effect of b_X/cow, b_SR and d_SR on the Py in milk production (Type IFootnote a experimental data)

b_X/cow = base production per cow; b_SR = base stocking rate; d_SR = change in stocking rate; Py = percentage change; MS = milk solids.
Py = a + b × b_X/cow + c × b_SR + d × d_SR, where a = origin, b = b_X/cow effect, c = b_SR effect and d = d_SR effect.
a Type I = common length experiments.
b MS = fat + protein.
c Values are expressed in g/kg.
Discussion
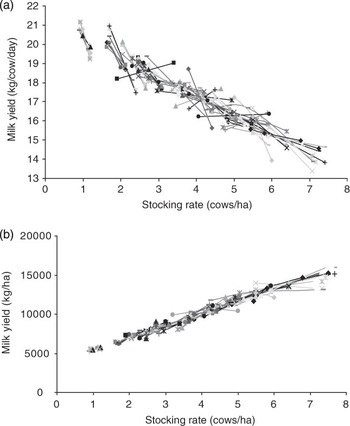
The results of this analysis further illustrate the strong positive relationship between SR and milk production per ha (Hoden et al., Reference Hoden, Peyraud, Muller, Delaby and Faverdin1991; Macdonald et al., Reference Macdonald, Penno, Lancaster and Roche2008) while the consistently low r.s.e. observed within these results emphasise the appropriateness of the techniques applied in this study. Castle et al. (Reference Castle, MacDaid and Watson1972) reported that over 19 years, SR and milk yield per cow explained 85% of the variation in total milk production. The impact of a one cow/ha SR increase on milk production per ha within the current data set (20.1% and 19.6% for Type I and Type II experiments, respectively) is similar to the findings of Journet and Demarquilly (Reference Journet and Demarquilly1979) when comparing raw mean effects on similar data. McMeekan and Walshe (Reference McMeekan and Walshe1963) considered that the optimum SR is such that the reduction in production per cow is 10% to 12% of the potential production obtained at a low SR. Within the context of the current data set, the observed reduction in milk production per cow of 7.4% and 8.7% for Type I and Type II data sets, respectively, suggests that the optimum SR per ha was not realised within the reviewed literature. This conclusion is further substantiated by the limited number of observations of reduced milk production per ha in response to an SR increase (Figure 2).
Visual representation of the response of (a) milk yield per cow per day and (b) milk yield per hectare (ha) to a stocking rate change within experiment for the Type I data set.

Although the results of this analysis illustrate that the response to an SR change in terms of milk yield per ha is similar for Type I and Type II data sets, the effects are not consistent for MS, fat, protein and lactose yield per ha. While MS yield per ha increased by 18.5% for Type I data, the increase within Type II data was only 11.4%. The comparatively reduced response in MS yield per ha within the Type II data (variable length experiments) is a consequence of a reduction in lactation length associated with increased SR within such experiments. While the reduction in lactation length within such studies has limited impact on milk yield per ha, the absence of late lactation milk, which is typically high in MS, considerably reduces the MS yield per ha associated with an increased SR. Type II data, despite the limited number of experimental observations, remain a truer reflection of the effect of an SR increase. Type I data contain experiments that are shorter and typically run during periods in which herbage supply is greatest, thereby biasing results in favour of increased SR as periods of gross underfeeding are ignored.
Previous studies have observed that as SR increases, milk production per cow declines due to reduced daily herbage allowance and intake associated with increased grazing severity (Le Du et al., Reference Le Du, Baker and Newberry1981), increased feed demand relative to animal requirements (Penno, Reference Penno1999) and the inability of the animal to select greater quality herbage from within the sward. The same authors suggested that the favourable effects on milk production per ha with an increased SR are in part due to reduced herbage wastage (McMeekan, Reference McMeekan1964), improved herbage growth and quality associated with increased grazing severity (Macdonald et al., Reference Macdonald, Penno, Lancaster and Roche2008) and increased energetic efficiency associated with reduced BW and body condition gain during lactation (McMeekan, Reference McMeekan1964). This is in agreement with Hoden et al. (Reference Hoden, Peyraud, Muller, Delaby and Faverdin1991), who stated that the proportion of area refused in a paddock is lower at increased SRs, thus indicating greater herbage utilisation. At increased SRs, the density of the herbage is also slightly increased; therefore, there is an increase in the amount of herbage harvested, and energy intake per ha is increased (measured using the Net Energy system (UFL; Faverdin et al., Reference Faverdin, Delagarde, Delaby and Meschy2007) resulting in an increase in milk production per ha (Hoden et al., Reference Hoden, Peyraud, Muller, Delaby and Faverdin1991).
While the general effect of an SR increase is to reduce milk production per cow and increase milk production per ha, increased milk production per cow or reduced milk production per ha in response to an SR increase has occasionally been observed within the reviewed literature (as illustrated by the variability in response in Figure 2a and b). Penno (Reference Penno1999) considered SR as a continuum in terms of herbage availability and observed three distinct results to an SR change. First, at a low b_SR (and high herbage availability), milk production per cow and per ha increased as SR increased (Baker and Leaver, Reference Baker and Leaver1986; Michell and Fulkerson, Reference Michell and Fulkerson1987), as intake per cow was not compromised and the quality of available herbage was enhanced through increased grazing severity. Second, at a greater b_SR, an SR increase results in reduced herbage availability and consequently reduced milk production per cow, while milk production per ha increases due to greater herbage utilisation (Macdonald et al., Reference Macdonald, Penno, Lancaster and Roche2008). Finally, milk production per ha may be reduced in response to an SR increase, where herbage utilisation is high at the b_SR and further incremental SR increases result in similar herbage utilisation while increasing maintenance energy requirements per ha (McFeely et al., Reference McFeely, Browne and Carty1975; Ahlborn and Bryant, Reference Ahlborn and Bryant1992; Penno, Reference Penno1999).
While the impact of a one cow/ha SR increase on milk production per ha is similar to Journet and Demarquilly (Reference Journet and Demarquilly1979), the 10% reduction in milk production per cow reported in that study is considerably greater than the current findings (7.4% and 8.7% for Type I and Type II experiments, respectively). This difference in response to a one cow/ha SR change suggests that there is an interaction between the effect of SR and the cow characteristics within the two data sets. When the experiments used are sub-divided based on decade, mean daily milk and MS yield per cow has increased from the 1960s up to the 2000s (P < 0.001). In this period, the total increase in daily milk and MS yield was 10.13 and 0.96 kg/cow, respectively, equivalent to a mean increase of 1.8%, 1.6%, 3.2%, 0.8% and 2.9% per year for milk, fat, protein, lactose and MS yield per cow, respectively, from the 1960s to 2000s. Similarly, milk, fat, protein, lactose and MS yield per ha has increased by 1.8%, 1.6%, 1.7%, 1.0% and 1.4% per year, respectively, from 1960s to 2000s. This increase in productivity has been reported previously and is a consequence of increased emphasis of selection for milk production, including fat and protein yield, as milk yield has been the main objective criterion for selection in most temperate countries (Miglior et al., Reference Miglior, Muir and Van Doormaal2005; Dillon et al., Reference Dillon, Berry, Evans, Buckley and Horan2006). The same authors have observed that the rate of increase in milk production per cow per year since 1985 has been 193, 131, 35 and 46 kg for the United States, The Netherlands, New Zealand and Ireland, respectively, while the rate of increase was 120 kg in France (L. Delaby, personal communication). This is equivalent to an increase of almost 2% of mean production per annum in the United States, The Netherlands and France, and approximately 1% of mean production in New Zealand and Ireland.
This analysis also shows that the milk production response per ha, to an SR increase, declines as b_SR increases (as the coefficients for b_SR are all negative). For example, with a mean milk yield per cow per day of 18 kg and an SR change of one cow/ha, the increase in milk yield per ha is 33.2%, where the b_SR is one cow/ha, and only 22.1% if the b_SR is three cows/ha. This result also explains why some experiments observe a reduction in milk production per ha in response to an SR increase. Similarly, the base milk production per cow significantly affects the response to an SR change. The results of this analysis show that the greater the base milk yield per cow per day, the lower the proportional reduction in milk production per cow and the greater the milk production response per ha.
The predicted effect of an SR change on the proportional reduction in milk production per cow is not precise within the current analysis as evidenced by the high residual error term as well as the variability in response to an SR change (Figure 2a). The difficulty in prediction relates to the definition of SR used within traditional SR experiments and specifically in relation to the effect of an SR change on the availability of feed to each individual animal. An SR increase results in a greater energy demand within the production system and the proportional effect on production per cow is dependent on the change in energy status of animals within the system.
The energy supply within the b_SR treatments of each experiment was estimated (according to the energy requirements for maintenance and production using the net energy system (Faverdin et al., Reference Faverdin, Delagarde, Delaby and Meschy2007)) and divided by the increased SR to reflect the reduction in energy status of each cow within an increased SR treatment. The mean energy available per cow per day was reduced by 2.5 UFL according to a one cow/ha SR increase, and according to Faverdin et al. (Reference Faverdin, Delagarde, Delaby and Meschy2007), this should have resulted in a 5.0-kg reduction in milk yield per cow per day. As actual milk yield declined only by 1.1 kg, herbage utilisation may have increased to achieve greater than anticipated production. The actual reduction in milk production observed (1.1 kg milk/2.5 UFL = 0.44 kg) is similar to that associated with a 1-kg reduction in daily herbage allowance (Peyraud et al., Reference Peyraud, Delagarde and Delaby2001). While it is widely acknowledged that milk production from pasture is dependent on numerous environmental, plant, animal and management factors controlling herbage intake and rumen digestion (Dillon, Reference Dillon2006), the results of this analysis illustrate that as SR increases by one cow/ha, the net energetic consequences are akin to a reduction of 1 kg in daily herbage allowance per cow.
Holmes et al. (Reference Holmes, Wilson, Mackenzie, Flux, Brookes and Davey2002) suggested that cows per ha is increasingly misleading as a measure of the balance between feed demand and supply, although cows per ha is still widely used. Other authors such as Macdonald et al. (Reference Macdonald, Penno, Lancaster and Roche2008) have suggested that alternative definitions of SR, such as comparative SR, be developed as cow BW/ton of feed offered. The low predictability of proportional change in milk production per cow according to the classical SR definition of cows per ha suggests that SR may be more appropriately defined in future experiments in terms of the change in available feed or energy offered per animal within each treatment. In addition, the change in the slope of milk production variables per cow and per ha when viewed in terms of BW/ha requires that increased information on the nature of the animal used be supplied in future SR experiments.
Conclusion
The results illustrate that while production per cow is reduced, a strong positive relationship exists between SR and milk production per ha. The results also indicate that the reduction in milk production per cow associated with an SR increase is a consequence of both an increased intensity of grazing associated with a reduction in daily herbage allowance and a reduction in lactation length. The low predictability of proportional change in milk production per cow, according to the classical SR definition of cows per ha over a defined period, suggests that SR may be more appropriately defined in terms of the change in available feed or energy offered per animal within each treatment rather than cows per ha.
Acknowledgement
The authors wish to acknowledge Adrian Van Bysterveldt and Dr Chris Grainger for their generous contributions in the preparation of this paper.