


Introduction
Modulation of the gut microbiota is an approach to support human health (Schmidt et al., Reference Schmidt, Raes and Bork2018; Valdes et al., Reference Valdes, Walter, Segal and Spector2018; Hou et al., Reference Hou, Wu, Chen, Wang, Zhang, Xiao, Zhu, Koya, Wei, Li and Chen2022; Ugwu et al., Reference Ugwu, Alum, Okon and Obeagu2024). Some bacterial species are significantly associated with various health effects (Zafar and Saier, Reference Zafar and Saier2021; Negishi et al., Reference Negishi, Ichikawa, Takahashi, Kano and Makino2025). Bifidobacterium and Lactobacillus have served as key genera due to their barrier-protection effects against inflammatory diseases and association with enhanced host immune system (O’Callaghan and van Sinderen, Reference O’Callaghan and van Sinderen2016; Dempsey and Corr, Reference Dempsey and Corr2022). Prebiotics are substrates, selectively utilized by host microorganisms, conferring health benefits (Gibson et al., Reference Gibson, Hutkins, Sanders, Prescott, Reimer, Salminen, Scott, Stanton, Swanson, Cani, Verbeke and Reid2017). Most established prebiotics (e.g., inulin-type fructans, galacto-oligosaccharides) only target a narrow group of taxa (primarily bifidobacteria). Novel prebiotic candidates are needed to expand the range of selectively stimulated microbial communities beyond Bifidobacterium.
Cellobiose, a β-(1 → 4) linked glucose disaccharide, is potentially a novel prebiotic. It can be either derived enzymatically from cellulose in plant-based biomass or synthesized enzymatically from glucose and sucrose. Recent EU regulatory approval for its use in foods (Regulation 2023/943), based on a safety assessment submitted by Turck et al. (Reference Turck, Bohn, Castenmiller, De Henauw, Hirsch-Ernst, Maciuk, Mangelsdorf, McArdle, Naska, Pelaez, Pentieva, Siani, Thies, Tsabouri, Vinceti, Cubadda, Frenzel, Heinonen, Marchelli, Neuhäuser-Berthold, Poulsen, Sanz, Schlatter, van Loveren, Ackerl, Gelbmann, Steinkellner and Knutsen2022), allows human consumption of cellobiose, enabling dietary intervention studies. Although safety is established, the specific impact on the human gut microbiota at a community-wide level remains unknown. This study addresses this gap. To our knowledge, this is the first randomised control human trial to apply high throughput 16S rRNA gene sequencing to investigate how cellobiose modulates gut microbiota structure and metabolic outputs. The aim of the study was to move beyond the analysis of targeted bacterial groups by profiling the full bacterial community, allowing detection of broad shifts in diversity and specific compositional changes.
Methods
Ethics
The study was given ethical approval by the University of Reading Research Ethics Committee [UREC (24/20)] and was conducted in accordance with the Declaration of Helsinki. The study was registered at clinicaltrials.gov (NCT07097389). All participants gave written consent prior to study entry.
Volunteer recruitment and screening
Healthy adults (18 years old and above) were recruited in Reading, UK. Inclusion required no history of gastrointestinal (GI) disorders or food allergies, and regular bowel habits (≥3 movements/week). Exclusion criteria were antibiotic use within last 6 months; anaemia or any chronic/acute illness (e.g., pre-diabetes); cancer diagnosis or history of bowel resection; active smoking, alcohol/drug misuse; pregnancy or lactation.
Study design and interventions
This randomized, double-blind, parallel-group, placebo-controlled trial involved a 4-week intervention: 5 g/day (Week 0–1; adaptation) increasing to 10 g/day (Weeks 2–4). We chose a parallel design instead of a cross-over design to avoid unpredictable carry-over effects, ensuring that each group’s baseline remained completely independent.
Prior to enrolment, eligible participants received both verbal and written information about the study and provided informed consent. Participants maintained their habitual diet but avoided other prebiotics/probiotics. The study interventions included: commercial cellobiose (Savanna GmbH, Germany), oligofructose (Orafti® P95, DP 3–9, average DP 4; Beneo-Orafti, Tienen, Belgium), and a maltodextrin placebo (Special Ingredients Ltd, UK). Participants were randomized (1:1:1) using a computer-generated sequence (https://www.randomizer.org/), and allocated via an online tool (https://ctrandomization.cancer.gov/). Blinding was ensured by identical packaging labelled with random letter codes; the decoding key was withheld from all personnel until analysis. All intervention bottles looked identical and bore only the letter code.
Stool samples were collected at baseline (V1) and post-intervention (V5). Compliance (≥95%) was verified via returned bottles and daily diaries. Each entry recorded the date and time of product consumption and daily tick-boxes for GI events (bloating; nausea; gas/flatulence; vomiting; abdominal pain or cramps; changes in stool consistency; diarrhoea; constipation; and frequency of bowel movements). All data were captured and managed using the secure Research Electronic Data Capture system hosted at the University of Reading, which facilitates validated data entry, audit trails, automated exports, and the integration of external data.
Outcome measures
Primary outcomes: Change in absolute abundance of faecal Bifidobacterium spp. and Lactobacillus spp. (16S rRNA sequencing and FISH-FLOW), changes in total faecal short-chain fatty acid (SCFA) concentration from V1 to V5.
Secondary outcomes: Magnitude and pattern of overall gut-microbiota shift from V1 to V5 and GI tolerance and safety (daily symptom checkboxes; adverse events) during Days 1–28. Exploratory outcomes: SCFA-microbe correlations for each subject, log₂-fold-changes (V5 vs. V1) in stool acetate, propionate, and butyrate. Spearman correlation coefficients (ρ) with 95% confidence intervals (CIs) were calculated to assess the relationship between the change in each SCFA and the log₂-fold-changes in Bifidobacterium. For other key genera (e.g., Faecalibacterium, Blautia, Roseburia, and Bacteroides), compositional changes were reported as mean log₂-fold-changes with 95% CIs. As an exploratory analysis, no formal hypothesis tests were performed; all results are presented as effect-size estimates only.
Faecal sample collection and processing
Participants received sterile stool collection containers for sample collection on V1 and V5. Immediately after collection, samples were placed in insulated bags with ice packs and retrieved from the participants’ residences within 2 hours of voiding. Additionally, a 5 g portion of each sample was diluted at a ratio of 1:10 (w/w) in anaerobic phosphate-buffered saline (PBS; 0.1 M, pH 7.4) and homogenized using a stomacher at 230 paddle beats per minute for 2 minutes at room temperature. Following homogenization, 750 μL aliquots of the faecal slurry were centrifuged at 13,000 g for 5 minutes. Supernatants were removed, and pellets resuspended in 375 μL of PBS (0.1 M, pH 7.4) before fixing in 1125 μL of 4% (w/v) paraformaldehyde for 4 hours at 4 °C. After fixing, the samples were centrifuged again at 13,000 g for 5 minutes at room temperature, washed with 1 mL of PBS, and washing was repeated twice. The final pellet was resuspended in 300 μL of PBS and stored in a 1:1 (v/v) PBS–ethanol solution at −20 °C until further analysis by FISH. In parallel, 1.5-mL aliquots of the faecal slurry were centrifuged at 13,000 g for 10 minutes, and the supernatants were transferred to 1.5-mL tubes and stored at −80 °C for subsequent analyses. The pellets were saved for bacterial DNA extraction at −80 °C.
Enumeration of faecal microbial populations by FISH-FLOW
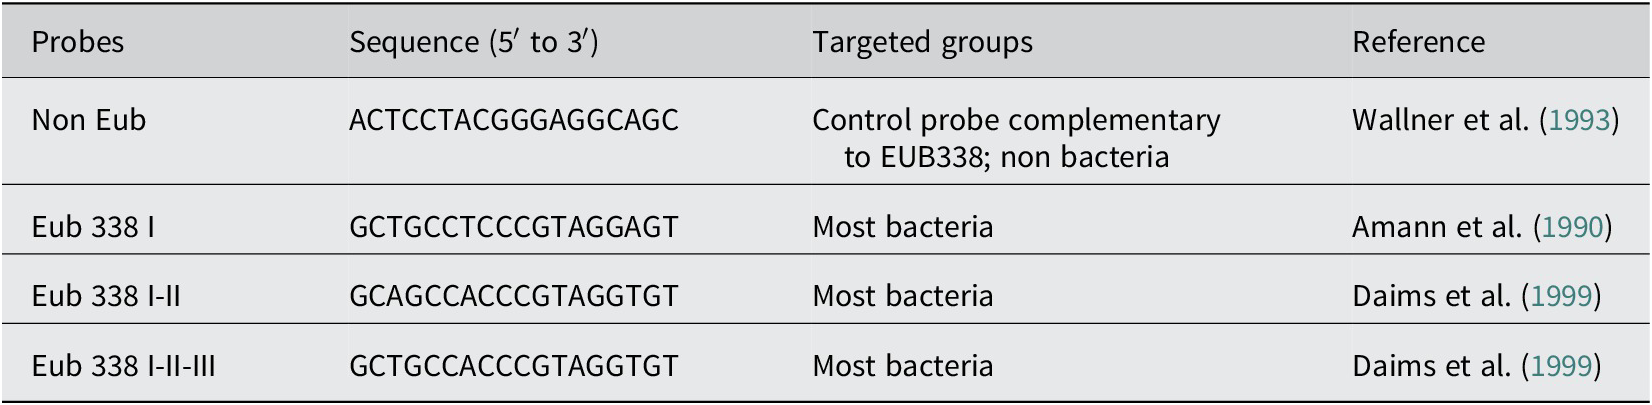
FISH-FLOW analysis was performed following Jackson et al. (Reference Jackson, Wijeyesekera, Williams, Theis, van Harsselaar and Rastall2023). The probes used are detailed in Table 1. Fluorescence measurements were taken at 488 and 640 nm using a BD Accuri C6 Plus flow cytometer. To minimize background noise, thresholds were set at 9000 for the forward scatter and 3000 for the side scatter, with a gate established to capture 90% of the primary event population. The flow rate was maintained at 10 μL/min, and data were acquired until 100,000 events were collected, as managed by the Accuri CFlow Sampler software. Bacterial counts were calculated by adjusting flow cytometry data according to PBS dilution, with results expressed as the logarithm (log₁₀) of cells per gram of fresh, wet faeces.
Name, sequence, and target group of oligonucleotide probes used in bacterial enumeration.

Table 1. Long description
The table consists of four columns titled Probes, Sequence (5 prime to 3 prime), Targeted groups, and Reference.
* Row 1: Non Eub. Sequence: A C T C C T A C G G G A G G C A G C. Targeted groups: Control probe complementary to E U B 3 3 8; non bacteria. Reference: Wallner et al. 1993.
* Row 2: Eub 338 I. Sequence: G C T G C C T C C C G T A G G A G T. Targeted groups: Most bacteria. Reference: Amann et al. 1990.
* Row 3: Eub 338 I-I I. Sequence: G C A G C C A C C C G T A G G T G T. Targeted groups: Most bacteria. Reference: Daims et al. 1999.
* Row 4: Eub 338 I-I I-I I I. Sequence: G C T G C C A C C C G T A G G T G T. Targeted groups: Most bacteria. Reference: Daims et al. 1999.
Bacterial DNA extraction
Fresh stool (1.5 g) was stored at −80 C for metabolic profiling analysis conducted after the intervention study was completed. Bacterial DNA was extracted from faecal samples using QIAamp PowerFaecal (QIAGEN) according to the manufacturer’s instructions. In summary, faecal samples were homogenized and aliquoted into 2 mL screwcap tubes containing 0.6 g 0.1 mm glass beads. Bead beating was performed using a Fastprep24 (MP Biomedicals) for 4 cycles of 45 s at speed 5. Then, 500 μL of raw extract were then used for DNA isolation.
DNA isolation, library preparation, and 16S rRNA gene sequencing
Extracted bacterial DNA was amplified by polymerase chain reaction (PCR) of the V4 region of the 16S rRNA gene with two-stage Nextera PCR libraries using the primer pairs 515F (50-GTG YCA GCM GCC GCG GTA A-30) and 806R (50-GGA CTA CNV GGG TWT CTA AT-30).
Raw sample extracts were diluted to 2.5 ng/μL using Tris buffer, and 5 μL were used in first step PCR, together with 5x HOT FIREPol MultiPlex Mix (Solis BioDyne) and 4 μM primer mix (forward and reverse) 515F/806R (Microsynth). First step PCR samples were purified with NGS Clean Beads (Labgene). Bead ratio was 1:1:2, and beads were washed with 75% ethanol, air-dried, and resuspended in the Tris buffer. In second-step PCR, each sample was individually barcoded, using Nextera XT Index Kit v2 (Illumina, San Diego, California) and 5x HOT FIREPol MultiPlex Mix (Solis BioDyne). Second-step PCR samples were purified with NGS Clean Beads (Labgene). The final second-step PCR products were quantified using a Quant-iT PicoGreen dsDNA Assay Kit (Thermo Fisher Scientific). Amplicons were pooled in equimolar amounts prior to sequencing. The final pool was quantified using a Quant-iT Pico-Green dsDNA Assay Kit (Thermo Fisher Scientific) and Fragment analyser (Agilent).
Subsequent PCR libraries were sequenced on an Illumina MiSeq platform using a v2 500 (2250 bp read length). Pools were diluted to 9.2 pM and loaded together with 15% PhiX (Illumina, FC-110-3001) to increase diversity resulting in a raw cluster density of 631 and a cluster passed filter rate of 98%. Paired-end reads that passed Illumina’s chastity filter were subjected to demultiplexing and trimming of Illumina adaptor residuals using Illumina’s bcl2fastq software version v2.20.0.422. The quality of the reads was checked with the software FastQC version 0.11.8, and sequencing reads that fell below an average Q-score of 20 or had any uncalled bases (N) were removed from further analysis. The locus-specific V4 primers were trimmed from the sequencing reads with the software cutadapt v3.2. Paired-end reads were discarded if the primer could not be trimmed. Trimmed forward and reverse reads of each paired-end read were merged to reform in silico the sequenced molecule considering a minimum overlap of 15 bases using the software USEARCH version 11.0.667. Merged sequences were again quality filtered, allowing a maximum of one expected erroneous base per merged read. Reads that contain ambiguous bases or were outliers regarding the amplicon size distribution were also discarded. Samples that resulted in less than 5000 merged reads were discarded so as not to distort the statistical analysis. Remaining reads were denoised using the UNOISE algorithm implemented in USEARCH to form amplicon sequencing variants (ASVs), discarding singletons and chimeras in the process. The resulting ASV abundance table was then filtered for possible barcode bleed-in contaminations using the UNCROSS algorithm. ASV sequences were compared to the reference sequences of the RDP 16S database provided by https://www.drive5.com/usearch/manual/sintax_downloads.html, and taxonomies were predicted considering a minimum confidence threshold of 0.5 using the SINTAX algorithm implemented in USEARCH. The resulting library was then corrected by taking into consideration numbers of 16S copies and rarefying to an even sampling intensity to reduce bias in diversity metric calculations and quantified as described by Vandeputte et al. (Reference Vandeputte, Kathagen, D’Hoe, Vieira-Silva, Valles-Colomer, Sabino, Wang, Tito, De Commer, Darzi, Vermeire, Falony and Raes2017).
Organic acids by gas chromatography-flame ionization detection
Faecal organic acids were extracted and quantified by gas chromatography-flame ionization detection (GC-FID) according to a modified Richardson et al. (Reference Richardson, Calder, Stewart and Smith1989) protocol. Briefly, the previously collected faecal fluids (1.5 mL) were thawed, and centrifuged at 11,337 × g for 10 min. One millilitre of sample was transferred into a labelled 100 mm × 16 mm glass tube (International Scientific Supplies Ltd, Bradford, UK) and 50 μL of 2-ethylbutyric acid (0.1 mol/L, internal standard), 500 μL concentrated HCl and 3 ml diethyl ether were added to each glass tube before vortexing for 1 min. Samples were centrifuged at 2,000 × g for 10 min. The resulting diethyl ether (upper) layer of each sample was transferred to clean 100 mL screw top glass tubes. Ether extract (400 μL) and 50 μL N-tert-butyldimethylsilyl)-N-methyl trifluoroacetamide were added into a GC screw-cap vial. Samples were left at room temperature for 72 h to allow samples to completely derivatise. An Agilent/HP 6890 Gas Chromatograph (Hewlett Packard, UK) using an HP-5MS 30 m × 0.25 mm column with a 0.25 μm coating (cross-linked [5%-phenyl]-methylpolysiloxane, Hewlett Packard) was used for analysis of organic acids. Temperatures of injector and detector were 275
$ {}^{\circ}\hskip-0.30em \mathrm{C} $
 , with the column temperature programmed from 63
$ {}^{\circ}\hskip-0.30em \mathrm{C} $
 to 190
$ {}^{\circ}\hskip-0.30em \mathrm{C} $
 at 15
$ {}^{\circ}\hskip-0.30em \mathrm{C} $
 /min followed by 190
$ {}^{\circ}\hskip-0.30em \mathrm{C} $
 for 3 minutes. Helium was the carrier gas (flow rate 1.7 ml/min; head pressure 133 KPa). A split ratio of 100:1 was used. Calibration curves were generated using acetic, propionic, butyric, lactate, iso-butyric, iso-valeric, valeric, and succinic acids (12.5–100 mmol/L). Raw concentrations (mmol/L) were converted to total SCFA per gram of starting material by multiplying by the extract volume and dividing by the wet weight of faeces. Final SCFA levels are reported as μmol SCFA per g wet faeces (mean ± standard error [SE]).
Sample size and statistical analysis
Data were processed and analysed in RStudio 4.2 and Statistical Package for Social Science version 29.0.2.0 (SPSS Inc.). All graphs were generated in GraphPad Prism Version 10.00 for MacOS (GraphPad Software). To investigate the primary, secondary and exploratory outcomes, different statistical analysis were applied. Power analysis (80%, α =0.05) indicated 11 subjects per arm to detect a 20% change in Lactobacillus abundance. Twelve subjects per arm (n = 36) were planned to be enrolled to account for 10% dropout. In practice, 37 participants were randomised. All randomised participants were included in the intention-to-treat analyses; models are robust to unequal group sizes.
Assumption checks were first applied to check the normality of each outcome (FISH-FLOW, quantitative microbiome profiling [QMP] and metabolic outputs) and of model residuals was assessed by Kolmogorov–Smirnov and Shapiro–Wilk tests, together with Q-Q plots, homogeneity of variances was evaluated by Levene’s test (based on means, medians, and trimmed means). Linearity, homoscedasticity, and homogeneity of regression slopes were examined in the context of the general linear model (GLM; scatterplots of covariate vs. dependent variable, residuals vs. predicted values, and tests of covariate
$ \times $
 factor interactions).
For primary and secondary outcomes that met normality and variance-equality assumptions, repeated-measures GLMs (time as within-participant factor; treatment as between-participant factor) were applied to test change over time and treatment
$ \times $
 time interactions in bacteriology outcomes. To adjust for baseline differences and participant sex, factorial analysis of covariance (ANCOVA) was performed on change-from-baseline values with baseline and sex as covariates. Pair-wise comparisons within each ANOCVA, repeated-measures general linear analysis of variance were Bonferroni-adjusted for type Ι errors. Outcomes failing normality of residuals (even after log- or other transformations) were analysed non-parametrically. Wilcoxon signed-rank tests were applied for within-intervention changes, and the Kruskal–Wallis H tests were also used for between-intervention comparisons, followed by Dunn’s post-hoc tests with Benjamini–Hochberg false discovery rate (BH-FDR) adjustment. For exploratory outcomes, correlations between bacterial taxa and SCFAs were analysed using log [fold change (post-pre)] using non-parametric Spearman’s rank correlation corrected for using FDR. Tests were two-tailed and P value <= 0.05 were considered statistically significant.
Results
Participant flow and baseline characteristic
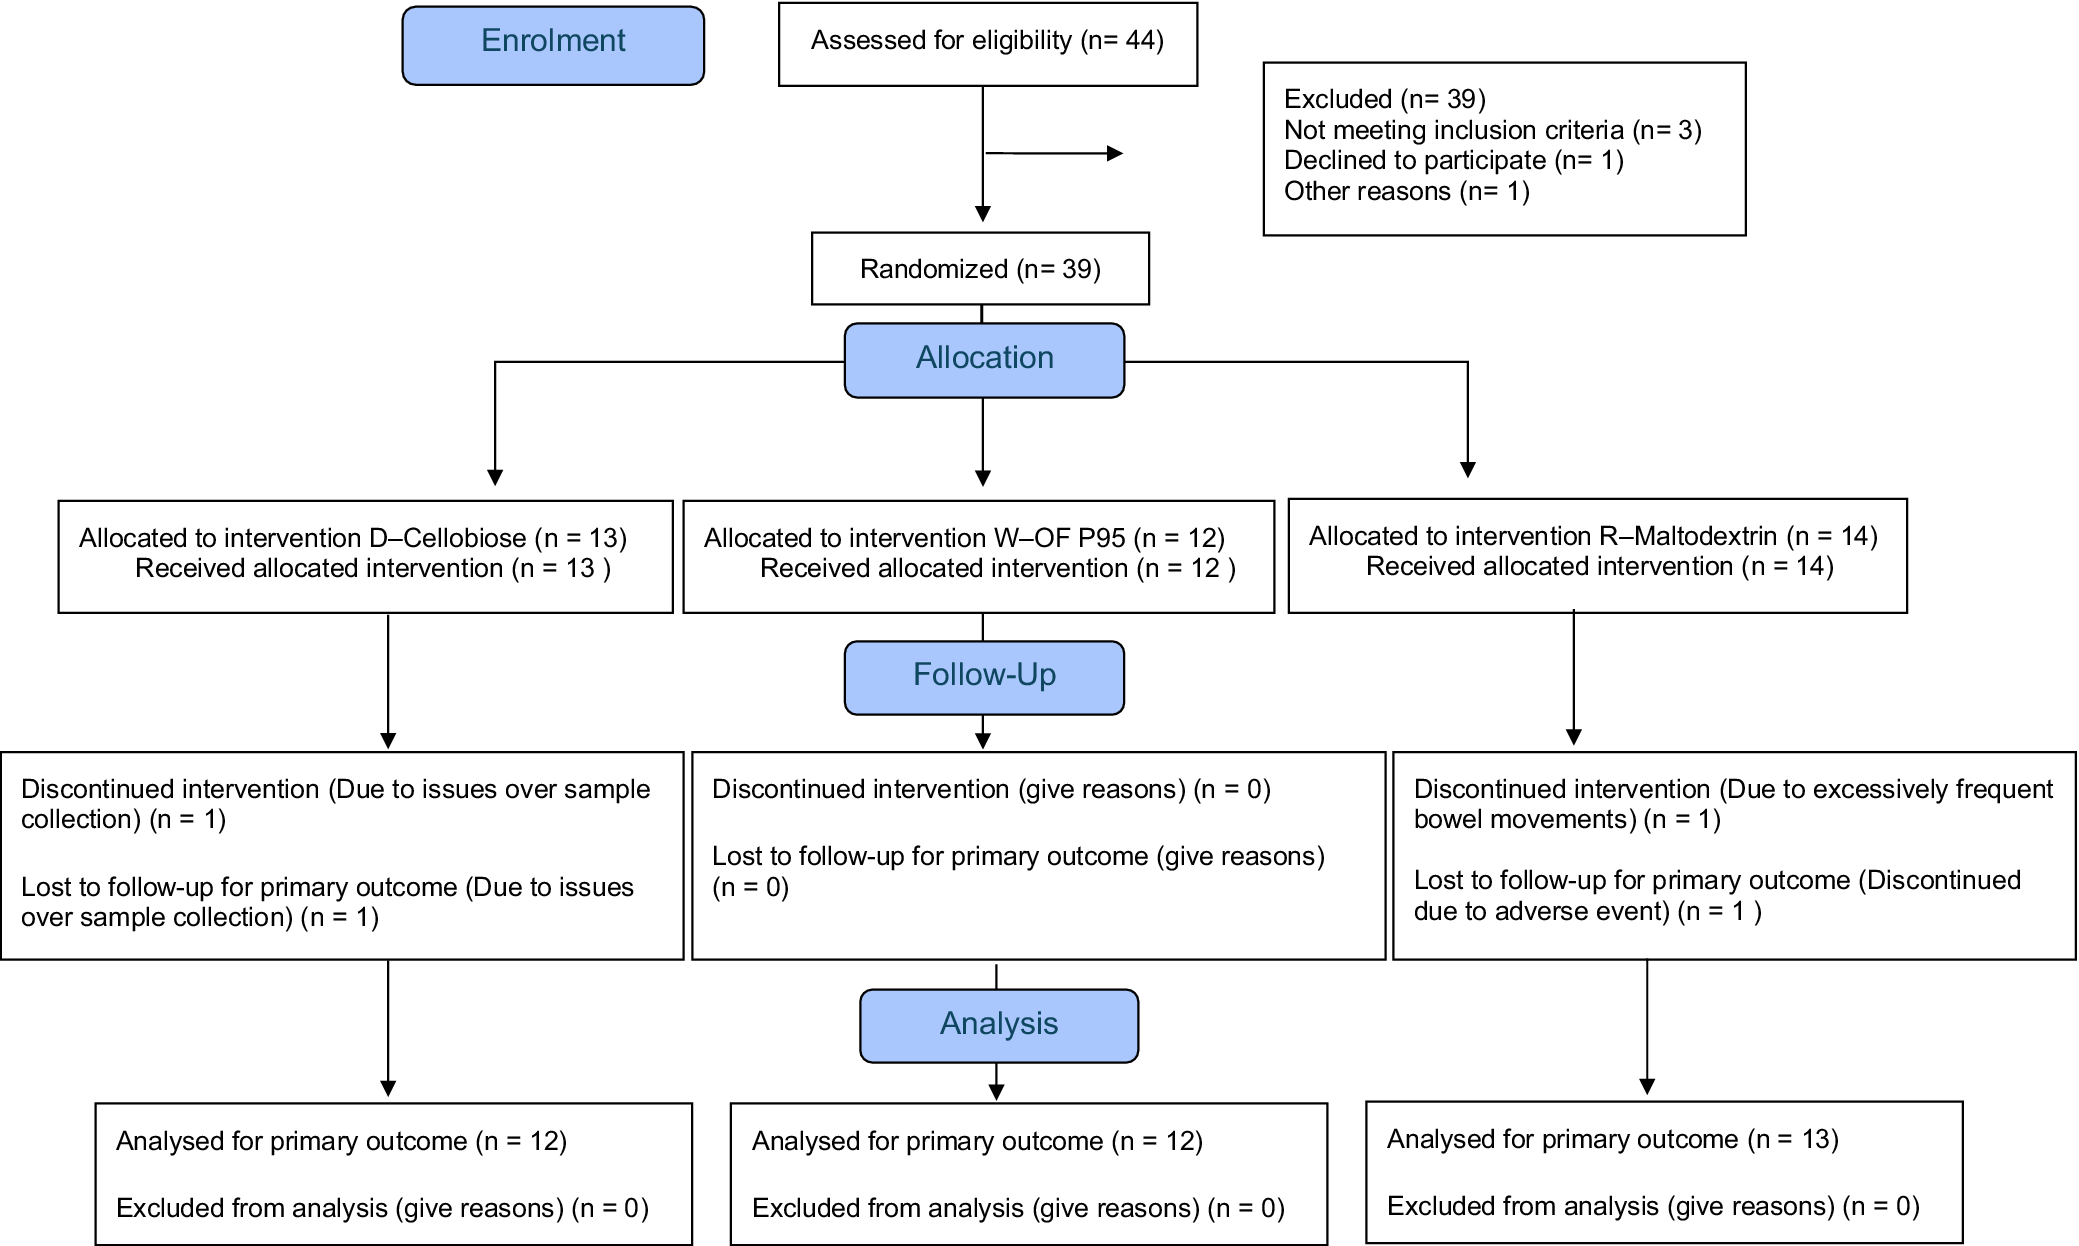
In total, there were 44 volunteers who expressed interest and were screened for eligibility, of whom 39 were randomised (n = 13 in each group). Two volunteers withdrew from the trial, 37 volunteers completed it (14 males and 23 females) (n = 12, 12, 13 for each group) and were assessed in analysis for all primary, secondary, and exploratory outcomes. The Consolidated Standards of Reporting Trials (CONSORT) flow diagram is presented in Figure 1 in accordance with the CONSORT 2025 statement (Hopewell et al., Reference Hopewell, Chan, Collins, Hróbjartsson, Moher, Schulz, Tunn, Aggarwal, Berkwits, Berlin, Bhandari, Butcher, Campbell, Chidebe, Elbourne, Farmer, Fergusson, Golub, Goodman, Hoffmann, Ioannidis, Kahan, Knowles, Lamb, Lewis, Loder, Offringa, Ravaud, Richards, Rockhold, Schriger, Siegfried, Staniszewska, Taylor, Thabane, Torgerson, Vohra, White and Boutron2025). Participants were recruited for the study between August 2024 and March 2025. The follow-up period for all participants concluded in April 2025, and the trial was completed as planned.
CONSORT flow diagram of participant progress through the phases of a three group, parallel randomised trial (enrolment, intervention allocation, follow-up, and data analysis). Abbreviations: OF P95, oligofructose; CONSORT, Consolidated Standards of Reporting Trials.

Figure 1. Long description
The flowchart is organized into four vertical stages.
1. Enrolment phase: At the top, 44 participants were assessed for eligibility. 39 were excluded: 3 for not meeting inclusion criteria, 1 declined, and 1 for other reasons. This left 39 participants who were randomized.
2. Allocation phase: The 39 participants were split into three groups.
* Left: 13 participants allocated to intervention D-Cellobiose; all 13 received the intervention.
* Center: 12 participants allocated to intervention W-O F P 95; all 12 received the intervention.
* Right: 14 participants allocated to intervention R-Maltodextrin; all 14 received the intervention.
3. Follow-Up phase:
* D-Cellobiose group: 1 discontinued due to sample collection issues and 1 was lost to follow-up for the primary outcome due to sample collection issues.
* W-OF P 95 group: 0 discontinued and 0 were lost to follow-up.
* R-Maltodextrin group: 1 discontinued due to frequent bowel movements and 1 was lost to follow-up due to an adverse event.
4. Analysis phase:
* D-Cellobiose group: 12 analyzed for primary outcome; 0 excluded.
* W-OF P 95 group: 12 analyzed for primary outcome; 0 excluded.
* R-Maltodextrin group: 13 analyzed for primary outcome; 0 excluded.
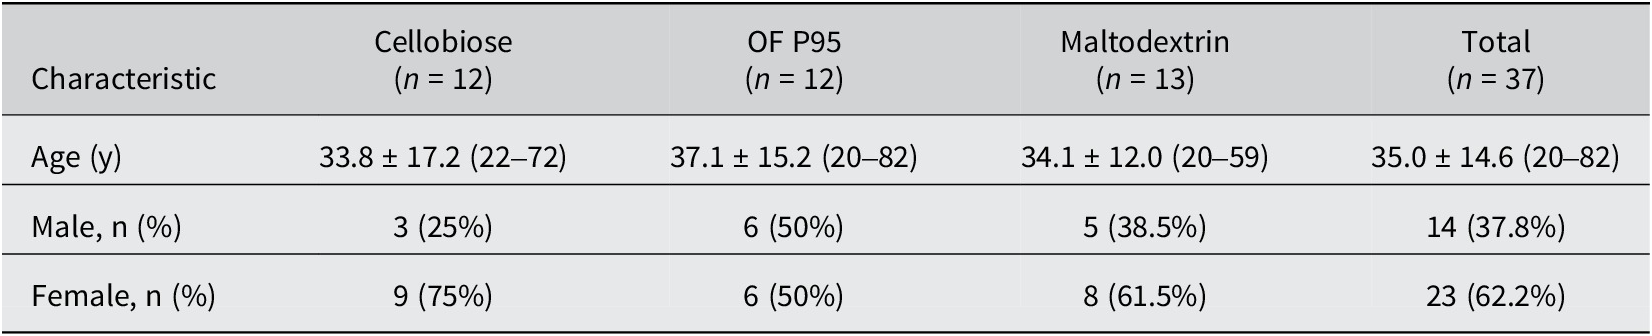
Based on returned bottle counts and consumption diaries, the mean adherence rate was 98% in the cellobiose group, 97% in the maltodextrin group and 99% in the OF P95 group. All participants included in the final analysis met the pre-defined compliance threshold of ≥95%. Table 2 summarizes baseline subject characteristics.
Baseline participant characteristics

Table 2. Long description
The table consists of five columns: Characteristic, Cellobiose (n = 12), O F P 95 (n = 12), Maltodextrin (n = 13), and Total (n = 37).
Data rows are as follows:
* Age (y): Cellobiose is 33.8 plus or minus 17.2 (range 22 to 72). O F P 95 is 37.1 plus or minus 15.2 (range 20 to 82). Maltodextrin is 34.1 plus or minus 12.0 (range 20 to 59). Total is 35.0 plus or minus 14.6 (range 20 to 82).
* Male, n (%): Cellobiose is 3 (25%). O F P 95 is 6 (50%). Maltodextrin is 5 (38.5%). Total is 14 (37.8%).
* Female, n (%): Cellobiose is 9 (75%). O F P 95 is 6 (50%). Maltodextrin is 8 (61.5%). Total is 23 (62.2%).
Note: Age data are presented as standard error S E (range). O F P 95 stands for oligofructose P 95.
Note: Data are presented as standard error (SE) (range) for age, and n (%) for sex distribution. Abbreviation: OF P95, oligofructose P95.
GI tolerability and bowel habit
For each GI symptom (bloating, nausea, gas/flatulence, vomiting, abdominal pain or cramps, diarrhoea, constipation), stool-frequency change, and stool-consistency change, we calculated the proportion of days (0–1) that was reported per participant (weekly counts ÷ 7). Median weekly proportions did not differ significantly across cellobiose, OF P95, and maltodextrin arms for any GI symptom (all Kruskal–Wallis qFDR >0.05). Gas/flatulence was the most reported GI symptom, occurring on a mean of 16.6% of study days across all participants (vs. 13.1% for stool-frequency changes and 10.4% for bloating). One participant in the maltodextrin arm withdrew early due to excessively frequent bowel movements that conflicted with their work. No other adverse events were reported. In short, these results indicate comparable GI tolerability among cellobiose, oligofructose, and maltodextrin at the tested doses, with low and stable rates of symptoms and stool changes throughout the 4-week intervention.
Bacterial enumeration by FISH-FLOW
All 37 participants provided paired stool samples at baseline (Visit 1) and after 4 weeks (Visit 5). Total bacterial counts, as measured by FISH-FLOW, did not change significantly from baseline to the end of the intervention in any of the three groups (Figure 2). A repeated-measures ANOVA confirmed that there was no significant effect of the intervention on total bacterial counts (see Supplementary Table 1 for full statistical results).
Differences in total bacteria measured by FISH-FLOW (log10 cells/g wet faeces) at visit 5 of the intervention using the Eub I-II-III probes. Values are mean and standard error (SE) (all points) expressed as log10 cells/g wet faeces. Results that are statistically significant between interventions are displayed by specified P values.

Figure 2. Long description
The Y axis is labeled log 10 cells forward slash g wet faeces, ranging from 8.0 to 10.0. The X axis is labeled Intervention and contains six categories.
From left to right, the bars represent:
* Cellobiose underscore V 1: Light blue bar with light blue circles. Mean is approximately 9.4 with an S E error bar extending from 9.3 to 9.5. Individual points range from 8.7 to 9.8.
* Cellobiose underscore V 5: Brown bar with orange triangles. Mean is approximately 9.35 with an S E error bar from 9.25 to 9.5. Individual points range from 8.3 to 9.8.
* O F P 95 underscore V 1: Light blue bar with light blue circles. Mean is approximately 9.6 with an S E error bar from 9.5 to 9.7. Individual points range from 9.1 to 9.9.
* O F P 95 underscore V 5: Brown bar with orange triangles. Mean is approximately 9.6 with an S E error bar from 9.5 to 9.7. Individual points range from 9.2 to 9.9.
* Maltodextrin underscore V 1: Light blue bar with light blue circles. Mean is approximately 9.5 with an S E error bar from 9.4 to 9.6. Individual points range from 9.1 to 9.9.
* Maltodextrin underscore V 5: Brown bar with orange triangles. Mean is approximately 9.5 with an S E error bar from 9.4 to 9.6. Individual points range from 9.0 to 9.9.
All bars show relatively high bacterial density with overlapping error bars, indicating similar mean values across the different interventions and time points.
Microbiome profiling analysis–QMP
The core microbiome was defined as genera present in at least 50% of the 37 participants at either baseline (Visit 1) or the end of the intervention (Visit 5). The mean absolute abundances of the 25 most abundant genera at baseline are presented for each intervention at both time points (Figure 3). Overall, there were no significant changes in the composition of the core microbiome from baseline to the end of the intervention in any of the three groups.
Quantitative microbiome profile (QMP) based on 16S rRNA sequencing across all interventions at V1 and V5. Numbers are expressed as cells/g faeces.

Figure 3. Long description
A stacked bar chart with a Y-axis labeled Q M P abundance (cells per g) ranging from 0.0 to 3.5 times 10 super 9. The X-axis lists six intervention groups: Cellobiose_V 1, Cellobiose_V 5, O F P 95_V 1, O F P 95_V 5, Maltodextrin_V 1, and Maltodextrin_V 5.
Each bar is composed of colored segments representing different bacterial genera. From bottom to top, the primary segments include:
* Agathobacter (light purple)
* Anaerobutyricum (dark blue)
* Anaerostipes (yellow)
* Bacteroides (pink)
* Bifidobacterium (red)
* Blautia (light blue)
* Faecalibacterium (tan)
* Phocaeicola (medium blue)
* Segatella (orange)
* N A (grey) at the top of every bar.
Key trends:
* Cellobiose groups show the lowest total abundance, approximately 2.4 to 2.5 times 10 super 9.
* O F P 95_V 1 shows the highest total abundance, reaching nearly 3.5 times 10 super 9.
* Bifidobacterium (red) and Blautia (light blue) segments are notably larger in the O F P 95 and Maltodextrin groups compared to Cellobiose.
* Segatella (orange) remains a dominant segment across all interventions, consistently positioned near the top of the colored stack.
The effects of the interventions on major phyla were assessed. Repeated-measures ANOVA revealed no significant changes from baseline to the end of the intervention in either the cellobiose or maltodextrin groups. However, the OF P95 group showed a significant decrease in two phyla: Euryarchaeota (P = 0.05) and Pseudomonadota (P = 0.021). A full statistical analysis is available in Supplementary Table 2. At the genus level, responses to the interventions varied. In line with the primary outcome, Figure 4 showed that the abundance of Bifidobacterium was significantly increased from baseline to the end of the intervention in the OF P95 group (P = 0.049). No significant changes in Bifidobacterium or Lactobacillus were observed in the cellobiose or maltodextrin groups. Full statistical results are available in Supplementary Table 3.
Quantitative microbiome profile differences in Bifidobacterium based on 16S rRNA sequencing at baseline (V1) and completion (V5) of the intervention in 37 adults. Individual, mean, and standard error (SE) were presented and expressed as numbers of cells/g faeces. Repeated-measure ANOVA was used to calculate intervention effect. Results that are statistically significant between interventions are displayed by specified P values. Abbreviation: OF P95, Oligofructose P95.

Figure 4. Long description
A vertical bar graph with overlaid individual data points and connecting lines.
Axes:
* The Y-axis is labeled QMP abundance (cells per gram) with a scale from 0.0 to 1.5 times 10 super 9.
* The X-axis is labeled Intervention and contains three paired groups: Cellobiose, O F P95, and Maltodextrin.
Data Groups from left to right:
* Cellobiose: The light blue bar for V1 is approximately 0.2 times 10 super 9. The brown bar for V5 shows a slight increase to approximately 0.25 times 10 super 9. Individual lines show varied trends with some sharp increases.
* OF P95: The light blue bar for V1 is approximately 0.3 times 10 super 9. The brown bar for V5 increases to nearly 0.5 times 10 super 9. A bracket above these two bars indicates a statistically significant difference with P equals 0.049. Several individual lines show steep upward trajectories.
* Maltodextrin: The light blue bar for V1 is approximately 0.3 times 10 super 9. The brown bar for V5 shows a slight decrease to approximately 0.25 times 10 super 9. Most individual lines trend downward or remain flat.
Visual Elements:
* Light blue bars and circles represent baseline V1.
* Brown bars and circles represent completion V5.
* Error bars indicate standard error S E.
* Lines connect individual data points between V1 and V5 for each participant.
As shown in Figure 3, on an aggregate level, genus-level QMP abundance remained relatively stable across timepoints; however, underlying individual responses to the interventions were highly heterogeneous, with some participants exhibiting large increases in specific genera while others remained unchanged or declined. To account for this variability and control for baseline differences and sex, a two-way ANCOVA was performed (factors: intervention, gender; covariate: V1; dependent variable: V5). Baseline abundance was a strong predictor of follow-up levels (F(1,30) = 21.44, P < 0.001, partial η 2 = 0.42), and sex had a modest but significant effect (F(1,30) = 5.01, P = 0.033, η 2 = 0.14). The main effect of intervention was borderline (F(2,30) = 3.31, P = 0.050, η 2 = 0.18), and Bonferroni-adjusted pairwise comparisons between cellobiose, OF P95, and maltodextrin were all non-significant (P > 0.05), although OF P95 tended to exceed maltodextrin (mean difference = 2.54 × 10⁸, P = 0.053).
The ANCOVA residuals for Lactobacillus abundance remained non-normal even after log-transformation (Shapiro–Wilk P = 0.006), necessitating the use of non-parametric analysis. At the end of the intervention (Visit 5), the median Lactobacillus abundance for all participants was 1.18 × 10⁷ cells/g (interquartile range: 6.33 × 10⁶–3.01 × 10⁷). A Kruskal–Wallis H test found no significant difference in the distribution of Lactobacillus abundance across the three intervention groups (H(2) = 1.19, P = 0.551). A median test likewise showed no difference in the proportion of participants above vs. below the overall median (χ2(2) = 0.999, P = 0.607). These results indicate that post-treatment Lactobacillus abundance did not differ among the cellobiose, OF P95, and maltodextrin groups.
Besides major bacterial taxa, the magnitude and pattern of overall gut-microbiota shift from V1 to V5 was also investigated. Log₂-fold-changes (V5/V1) were calculated and plotted in a heatmap (Figure 5) for each genus within each arm, they were compared across arms using ANOVA with FDR correction. Overall stability was observed across the core community: 17 of the 25 genera exhibited mean log₂-fold-changes between −2 and +2 in all three arms, corresponding to less than a twofold shift in abundance. None of the 25 genera show a statistically significant difference in mean Log₂-fold-changes across arms (adjusted p-values [q-FDR] > 0.05). To further understand the correlations between these changes, a correlation heatmap was generated among the top 25 genera, grouping by each intervention, as an exploratory, hypothesis-generating analysis. Figure 6 and Supplementary Table 4 show the genus-genus correlation matrix. In the cellobiose group, strong positive correlations (ρ > 0.6) were widespread. Anaerostipes formed the most links, correlating positively with 12 of the top 25 genera, nearly half of the network. Its strongest associations were with Blautia (Spearman’s ρ = 0.98, P = 9.3
$ \times {10}^{-6} $
 ), Coprococcus (Spearman’s ρ = 0.92, P = 7.1
$ \times {10}^{-4} $
 ), Faecalibacterium (Spearman’s ρ = 0.92, P = 5.6
$ \times {10}^{-4} $
 ), Fusicatenibacter (Spearman’s ρ = 0.92, P = 5.6
$ \times {10}^{-4} $
 ), and Gemmiger (Spearman’s ρ = 0.93, P = 3.0
$ \times {10}^{-4} $
 ). Bifidobacterium was also found to be positively correlated with Blautia (Spearman’s ρ = 0.83, P = 0.006), Coprococcus (Spearman’s ρ = 0.84, P = 0.005), Dorea (Spearman’s ρ = 0.87, P = 0.002), Faecalibacterium (Spearman’s ρ = 0.85, P = 0.003), Fusicatenibacter (Spearman’s ρ = 0.86, P = 0.003), Gemmiger (Spearman’s ρ = 0.90, P = 0.001), Segatella (Spearman’s ρ = 0.70, P = 0.031), and Streptococcus (Spearman’s ρ = 0.67, P = 0.050). Conversely, OF P95 produced a fragmented network, Anaerobutyricum was found to be the most connected, correlating positively with Bifidobacterium (Spearman’s ρ = 0.80, P = 0.027), Blautia (Spearman’s ρ = 0.91, P = 0.006), Collinsella (Spearman’s ρ = 0.88, P = 0.009), Dialister (Spearman’s ρ = 0.79, P = 0.033), Fusicatenibacter (Spearman’s ρ = 0.74, P = 0.050), and Gemmiger (Spearman’s ρ = 0.86, P = 0.013). While the maltodextrin group maintained only a few significantly positive correlations, reflecting a baseline community structure.
Heatmap of mean log₂ fold-change in top 25 selected genus level for each arm across the full cohort (n = 37). Log₂ fold-change values range from −4 (strong negative) to +4 (strong positive); colour intensity reflects the magnitude and direction (purple = negative, red = positive). Abbreviations: OF P95, oligofructose P95; NA, not assigned at the sequencing level.

Figure 5. Long description
A heatmap grid with 25 rows of bacterial genera and 3 columns representing treatment arms.
* Axes and Scale: The Y-axis lists genera including Agathobacter, Anaerobutyricum, Bifidobacterium, and others, ending with N A. The X-axis lists Cellobiose, O F P 95, and Maltodextrin. A vertical color bar on the right indicates log sub 2 fold-change from minus 4 (purple) to 0 (light green) to plus 4 (red).
* Data Trends:
* Agathobacter shows a strong negative fold-change (purple) in Cellobiose and OF P 95 but a strong positive fold-change (red) in Maltodextrin.
* Bifidobacterium shows a distinct negative fold-change (dark blue) specifically in the Maltodextrin arm.
* Lientehia shows a strong positive fold-change (orange-red) in the Maltodextrin arm.
* Streptococcus, Sutterella, and Vescimonas show strong negative fold-changes (blue) primarily in the OF P 95 arm.
* Parabacteroides and Ruminococcus show negative fold-changes in the Cellobiose arm.
* Most other genera, such as Anaerostipes and Blautia, maintain values near 0 (light green) across all three arms.
Heatmap of Spearman genus–genus correlations within each intervention. Cell colour reflects correlation coefficient (blue = positive, red = negative). Asterisks (*P
$ \le $
 0.5; **P
$ \le $
 0.01; ***P
$ \le $
 0.001) denote correlations significant after BH-FDR correction; only the upper triangle of each symmetric matrix is annotated to avoid duplication. Abbreviations: OF P95, oligofructose P95; NA, not assigned at the sequencing level.

Figure 6. Long description
A multi-panel figure with three heatmaps labeled A, B, and C. Each heatmap shares a common Y-axis on the left and X-axis at the bottom listing 26 bacterial genera including Agathobacter, Anaerobutyricum, Anaerostipes, Bacteroides, Bifidobacterium, Blautia, Collinsella, Coprococcus, Dialister, Dorea, Faecalibacterium, Fusicatenibacter, Gemmiger, Lientehia, N A, Mediterraneibacter, Parabacteroides, Phocaeicola, Romboutsia, Roseburia, Ruminococcus, Segatella, Streptococcus, Sutterella, and Vescimonas. A color scale bar to the right of each plot ranges from negative 0.4 (dark red) through 0 (white) to 1.0 (dark blue).
* Panel A, Cellobiose: Shows a dense cluster of dark blue cells in the upper-left quadrant, particularly among Anaerobutyricum, Anaerostipes, Bacteroides, and Bifidobacterium. This area is heavily annotated with asterisks indicating high statistical significance (P less than or equal to 0.001). The lower-right quadrant shows more varied correlations with scattered red cells for Sutterella and Vescimonas.
* Panel B, O F P95: Displays a more diffuse correlation pattern compared to panel A. Significant positive correlations (blue with asterisks) are visible between Agathobacter and Vescimonas, and between Bifidobacterium and Blautia. Red cells indicating negative correlations are more prominent, specifically involving Segatella and Roseburia.
* Panel C, Maltodextrin: Shows the least amount of significant correlations. The heatmap is dominated by light blue and white cells. Notable negative correlations (red) are seen for Roseburia against several other genera and for N A against Mediterraneibacter. Significant positive correlations are sparse, with a few marked in the upper-left and center-right sections.
SCFA quantification
Metabolic profiles of faecal samples across three interventions at baseline and completion were analysed. Figure 7 and Supplementary Table 5 summarize the concentrations of total organic acids, acetate, butyrate, and propionate. Organic acids were unchanged from V1 to V5 in cellobiose and maltodextrin (P > 0.05), while OF P95 induced a significant decrease (P = 0.038). Acetate and butyrate showed no significant differences over time in cellobiose and maltodextrin (P > 0.05). Propionate levels remained stable with no significant changes over time across all intervention groups. Crucially, when comparing the net changes from baseline between the different groups, no statistically significant differences were observed for any of the analysed metabolites.
Amount of total organic acids (A), acetate (B), butyrate (C) and propionate (D) from fresh wet faeces measured by gas chromatography at V1 and V5. Individual, mean and SE were presented and expressed as numbers of μmol/g faeces. Results that are statistically significant within respective treatments are displayed by specified P-values. Error bars represent SE. Abbreviations: OF P95, Oligofructose P95.

Figure 7. Long description
A four-panel set of bar graphs with overlaid individual data points and connecting lines. Each graph shares a common x-axis with three treatment pairs: Cellobiose underscore V 1 and V 5, O F P 95 underscore V 1 and V 5, and Maltodextrin underscore V1 and V5. Blue bars represent V 1 and red bars represent V 5. The y-axis for all panels is mu mol per g.
Panel A, Total organic acids: The y-axis ranges from 0 to 100. Cellobiose shows a slight increase from approximately 34 to 36. OF P 95 shows a significant decrease from 42 to 33 with a P-value equal to 0.038. Maltodextrin shows a decrease from 37 to 32.
Panel B, Acetate: The y-axis ranges from 0 to 75. Cellobiose remains stable around 20. OF P 95 shows a significant decrease from 25 to 19 with a P-value equal to 0.033. Maltodextrin decreases from 22 to 18.
Panel C, Butyrate: The y-axis ranges from 0 to 25. Cellobiose shows a slight increase from 6 to 6.5. O F P 95 shows a significant decrease from 8 to 5.5 with a P-value equal to 0.045. Maltodextrin remains stable around 7.
Panel D, Propionate: The y-axis ranges from 0 to 20. Cellobiose increases from 7.5 to 8. OF P 95 decreases from 7.5 to 6. Maltodextrin decreases from 7 to 6. No significant P-values are noted for Panel D.
In all panels, individual data points are connected by lines to show the trajectory of change for each subject between V 1 and V 5. Error bars represent S E.
OF P95 again showed a significance decrease over time in acetate (P = 0.038) and butyrate (P = 0.045). Propionate showed no significant differences over time in both interventions. However, between-group comparisons of change from baseline were not significant.
In short, neither total nor individual SCFAs were significantly affected by cellobiose and maltodextrin, while OF P95 exhibited a significant decrease in total SCFAs and key organic acids. The individual subject trajectories revealed a split: most subjects show an increase in total SCFA (and in each of acetate, propionate, and butyrate) in the cellobiose group, while most subjects induced a decrease in those same SCFA in OF P95 and maltodextrin.
Correlations between bacteriology and SCFA quantification
To investigate the relationships between changes in taxa and SCFA quantification, a correlation matrix using the fold change [Log2 (post/pre)] for of the QMP genera and SCFA was constructed (Figure 9). The data were analysed using a non-parametric Spearman’s rank correlation analysis, further adjusted using BH-FDR. Figure 8 and Supplementary Table 6 summarize the overall correlation heatmap between SCFA and top 25 bacteria taxa. No correlation reached statistical significance after BH-FDR correction (all q > 0.05). But 22 out of 25 genera had positive Spearman’s ρ with acetate fold-change (mean ρ = 0.11, range −0.20 to 0.34), yet 19 of 25 genera had negative Spearman’s ρ with propionate fold-change (mean ρ = −0.1, range −0.30 to 0.14).
Heatmap of Spearman’s rank correlations between bacterial genera and SCFA log₂–fold-changes across the full cohort (n = 37). Spearman’s ρ (two-sided) was calculated for each genus–SCFA pair and adjusted for multiple testing with the Benjamini–Hochberg FDR. ρ values range from −0.3 (strong negative) to +0.3 (strong positive); colour intensity reflects the magnitude and direction of ρ (blue = negative, red = positive). Asterisks denote correlations surviving FDR (q < 0.05). Abbreviations: NA, not assigned at the sequencing level.

Figure 8. Long description
A rectangular heatmap grid with 24 rows of bacterial genera and 4 columns of short-chain fatty acids.
Axes and Scale:
- Y-axis (left): Lists genera including Agathobacter, Anaerobutyricum, Anaerostipes, Bacteroides, Bifidobacterium, Blautia, Collinsella, Coprococcus, Dialister, Dorea, Faecalibacterium, Fusicatenibacter, Gemmiger, Lientehia, N A, Mediterraneibacter, Parabacteroides, Phocaeicola, Romboutsia, Roseburia, Ruminococcus, Segatella, Streptococcus, Sutterella, and Vescimonas.
- X-axis (bottom): Acetate, Butyrate, Propionate, and Total organic acid.
- Color Scale (right): A vertical bar ranging from +0.3 (dark blue) at the top, through 0 (white) in the middle, to -0.3 (dark red) at the bottom.
Data Distribution:
- Acetate column: Shows predominantly blue (positive) correlations, with the strongest blue intensities at Bifidobacterium, Collinsella, Romboutsia, and Roseburia. Dialister and Vescimonas show red (negative) correlations.
- Butyrate column: Displays a mix of light blue and light red. Dialister and Sutterella show the most distinct red (negative) correlations.
- Propionate column: Features the most prominent red (negative) clusters, particularly for Anaerobutyricum, Bacteroides, Bifidobacterium, Mediterraneibacter, Parabacteroides, and Romboutsia.
- Total organic acid column: Shows generally weaker correlations (lighter shades), with Dialister and Vescimonas leaning red, while Lientehia and Streptococcus lean blue.
No genus–SCFA pair reached significance (q < 0.05) in any intervention. However, there are some clear trends (Figure 9); in the cellobiose group, most genera correlated positively with acetate (median ρ = +0.12). Mediterraneibacter had the strongest correlation with acetate (ρ = 0.85; raw P = 0.0005; q = 0.052). Correlations with butyrate and propionate were weak and variable (median |ρ| < 0.05). In OF P95, genera tended to correlate negatively with butyrate (median ρ = −0.18) and propionate (median ρ = −0.15), mirroring the overall decline in these SCFAs despite increased bacterial counts. Acetate correlations were small (median ρ = −0.02). Last but not the least, in the maltodextrin group, correlations clustered around zero for all SCFAs (median ρ ≈ 0.04), in line with minimal changes in both bacterial abundance and SCFA levels.
Heatmap of Spearman’s rank correlations between bacterial genera and SCFA log₂-fold-changes across the full cohort (n = 37), grouped by intervention. Spearman’s ρ (two-sided) was calculated for each genus–SCFA pair and adjusted for multiple testing with the BH-FDR. ρ values range from −0.5 (strong negative) to +1 (strong positive); colour intensity reflects the magnitude and direction of ρ (blue = positive, red = negative). Specific value denotes correlations surviving FDR (q < 0.05). Abbreviations: OF P95, oligofructose P95; NA, not assigned at the sequencing level.

Figure 9. Long description
The heatmap is divided into three panels from left to right: Cellobiose, O F P95, and Maltodextrin. The Y-axis lists 25 bacterial genera: Agathobacter, Anaerobutyricum, Anaerostipes, Bacteroides, Bifidobacterium, Blautia, Collinsella, Coprococcus, Dialister, Dorea, Faecalibacterium, Fusicatenibacter, Gemmiger, Lientehia, NA, Mediterraneibacter, Parabacteroides, Phocaeicola, Romboutsia, Roseburia, Ruminococcus, Segatella, Streptococcus, Sutterella, and Vescimonas. The X-axis for each panel lists four SCFA categories: Acetate, Butyrate, Propionate, and Total organic acid.
A color scale on the far right indicates Spearman rho values from negative 0.5 (dark red) to positive 1.0 (dark blue), with white representing zero.
* In the Cellobiose panel, the Acetate column shows a consistent positive correlation (blue) across almost all genera, with a specific value of 0.052 noted for Mediterraneibacter. The Butyrate and Propionate columns show mixed, weaker correlations with notable negative (red) clusters for Agathobacter and Parabacteroides.
* In the O F P95 panel, correlations are more fragmented. Strong negative correlations (red) are visible for Lientehia with Butyrate and Dorea with Acetate. Strong positive correlations (blue) appear for Bifidobacterium with Propionate.
* In the Maltodextrin panel, the correlations are generally weaker (lighter colors). Notable negative correlations (red) are seen for Dialister and Mediterraneibacter with Acetate and Propionate.
Discussion
This randomised, controlled trial used QMP and a pre-specified analysis plan to test three carbohydrate interventions, cellobiose, oligofructose P95 (OF P95), and maltodextrin. The primary endpoints were Bifidobacterium and Lactobacillus absolute abundances. Neither genus changed significantly from baseline after cellobiose consumption. In contrast, OF P95 produced a borderline increase in Bifidobacterium, consistent with its well-documented bifidogenic activity (Kolida et al., Reference Kolida, Tuohy and Gibson2002; Meyer and Stasse-Wolthuis, Reference Meyer and Stasse-Wolthuis2009; Jackson et al., Reference Jackson, Wijeyesekera, Williams, Theis, van Harsselaar and Rastall2023; Van Harsselaar et al., Reference Van Harsselaar, Mödinger, Dharsono, Menzel, Theis and Schön2024), while maltodextrin had no clear effect. Secondary analyses of overall composition showed only small, non-significant differences between interventions. Exploratory co-abundance networks revealed intervention-specific patterns. Cellobiose was associated with dense, positive correlations among butyrate-linked genera, Anaerobutyricum, Anaerostipes, and Coprococcus, with Blautia positioned as a major acetate producer (Shetty et al., Reference Shetty, Boeren, Bui, Smidt and de Vos2020; Hosomi et al., Reference Hosomi, Saito, Park, Murakami, Shibata, Ando, Nagatake, Konishi, Ohno, Tanisawa, Mohsen, Chen, Kawashima, Natsume-Kitatani, Oka, Shimizu, Furuta, Tojima, Sawane, Saika, Kondo, Yonejima, Takeyama, Matsutani, Mizuguchi, Miyachi and Kunisawa2022; Sheridan et al., Reference Sheridan, Louis, Tsompanidou, Shaw, Harmsen, Duncan, Flint and Walker2022; Notting et al., Reference Notting, Pirovano, Sybesma and Kort2023). Bifidobacterium clustered alongside Gemmiger, Faecalibacterium, and Dorea (strong positive ρ). This pattern fits known cross-feeding relationships between bifidobacteria (lactate producers) and butyrate producers (lactate consumers) (Duncan et al., Reference Duncan, Louis and Flint2004; Belenguer et al., Reference Belenguer, Duncan, Calder, Holtrop, Louis, Lobley and Flint2006; Vital et al., Reference Vital, Howe and Tiedje2014). In contrast, OF P95 networks were more fragmented, and maltodextrin largely preserved baseline structure. The correlation between Mediterraneibacter log₂-fold-change and acetate under cellobiose was strong but borderline. Furthermore, it is worth noting that maltodextrin, while utilized as a placebo control in this trial, may not be entirely inert. Emerging evidence indicates that maltodextrin can subtly modulate gut microbial composition and metabolic pathways (Almutairi et al., Reference Almutairi, Basson, Wearsh, Cominelli and Rodriguez-Palacios2022), a factor that should be kept in mind when evaluating comparative baseline-to-endpoint changes between the groups.
As for the tolerability and safety, GI symptoms and stool measures were similar across interventions, indicating good tolerability of the tested cellobiose at 5–10 g/day. This result is supported by a previous human trial where cellobiose was shown to be highly tolerable, with single doses of 20 g causing no issues and repeated 15 g doses causing only minor, temporary symptoms (Moré et al., Reference Moré, Postrach, Bothe, Heinritz and Uebelhack2020). Compared with the broader prebiotic literature, inulin-type fructans/oligofructose show a dose-dependent GI profile, gas/bloating rise above ~10 g/day, although typical prebiotic doses (≈5–10 g/day) are generally acceptable, placing our findings within expected tolerability bands for fermentable carbohydrates (Kolida and Gibson, Reference Kolida and Gibson2007; Bonnema et al., Reference Bonnema, Kolberg, Thomas and Slavin2010; Le Bourgot et al., Reference Le Bourgot, Rigaudier, Juhel, Herpin and Meunier2022).
Given that fructan-type substrates are preferentially fermented by bifidobacteria, the observed bifidogenic effect of OF P95 is expected. The lack of a Lactobacillus response is also expected, as Lactobacillus is typically a minor member of adult faecal communities and is more characteristic of the upper gut (Heeney et al., Reference Heeney, Gareau and Marco2018; Jensen et al., Reference Jensen, Heyndrickx, Jonkers, Mackie, Millet, Naghibi, Pærregaard, Pot, Saulnier, Sina, Sterkman, Van den Abbeele, Venlet, Zoetendal and Ouwehand2023); hence, it is often hard to detect stable increases in stool collection studies. These taxa are also strain-specific and often respond to different carbohydrate niches than fructans (Kaplan and Hutkins, Reference Kaplan and Hutkins2000; Walton et al., Reference Walton, van den Heuvel, Kosters, Rastall, Tuohy and Gibson2012; Zúñiga et al., Reference Zúñiga, Monedero and Yebra2018; Zheng et al., Reference Zheng, Wittouck, Salvetti, Franz, Harris, Mattarelli, O’Toole, Pot, Vandamme, Walter, Watanabe, Wuyts, Felis, Gänzle and Lebeer2020; Huang et al., Reference Huang, Wu, Zhou, Wei, Yue, Xiao and Luo2022). In short, the data suggest that while OF P95 was specifically bifidogenic, the effect of cellobiose on Bifidobacterium was not statistically significant. Instead, cellobiose appears to alter community interactions among various butyrate-producing bacteria rather than driving a large shift in any single genus.
A strength of this study is the use of QMP to report absolute counts (cells/g faeces) rather than relative abundances. Percentages can be misleading when increases in one taxon mathematically lower others’ percentages (Gloor et al., Reference Gloor, Macklaim, Pawlowsky-Glahn and Egozcue2017). This method has been used for linking community variation to microbial load (Vandeputte et al., Reference Vandeputte, Kathagen, D’Hoe, Vieira-Silva, Valles-Colomer, Sabino, Wang, Tito, De Commer, Darzi, Vermeire, Falony and Raes2017). To improve the interpretability of our data, we focused our analysis on a predefined group of core genera that were prevalent across most participants. This approach reduces the statistical noise from rare taxa, which can show misleadingly large fold-changes even if they are only present in one or two individuals (Weiss et al., Reference Weiss, Xu, Peddada, Amir, Bittinger, Gonzalez, Lozupone, Zaneveld, Vázquez-Baeza, Birmingham, Hyde and Knight2017).
This study’s ability to detect genus-level microbial shifts was likely limited by its brief duration and the use of modest doses (5–10 g/day). These factors, combined with a relatively small sample size (n = 37), mean that more subtle or strain-specific changes may have been missed. Furthermore, while participants remained on their normal diets to improve the external validity of the findings, this introduced dietary variability as a confounding factor that could have masked smaller prebiotic effects.
The exploratory multi-taxon analyses involved many statistical comparisons, which increases the likelihood of finding false positives by chance, even after applying a FDR correction. To address this, our interpretation strategy prioritized biologically meaningful signals over simple statistical significance. We therefore focused on the magnitude of change (effect sizes) and consistent trends across related bacterial groups, treating these exploratory results as hypothesis-generating findings for future research.
Finally, QMP provides stool-based absolute counts and therefore characterises luminal communities; it does not capture the mucosa-associated microbiota and cannot localise changes to specific colonic regions; conclusions are therefore restricted to stool. Likewise, faecal SCFA concentrations are conservative endpoints: because most SCFA are absorbed and metabolised in the large intestine, stool levels reflect the residual rather than the production rate and are sensitive to transit and dilution effects.
In summary, this in vivo intervention trial confirmed the selective fermentation of OF P95 by Bifidobacterium and suggested that cellobiose may reshape co-abundance patterns among butyrate-linked genera. The core community remained stable in absolute terms. While no statistically significant differences were observed between the intervention groups, the data suggest a trend towards an increase in beneficial bacteria following cellobiose consumption.
We did not find major shifts in total microbial numbers or endpoint metabolite levels. However, this does not mean cellobiose has no biological activity. These results show the limits of testing a healthy, resilient gut using only static “before and after” measurements, which can easily miss fluid ecosystem changes happening during the intervention. Because a single human study does not give a definitive result, continuous in vivo testing is necessary to consistently validate these ingredients. Future human trials must inevitably continue to rely on robust pre- and post-intervention designs to provide essential clinical data.
To complement these essential human trials and better validate underlying mechanisms, future work can pair in vivo studies with dynamic in vitro gut models, such as continuous fermentation systems. These laboratory systems offer a controlled platform to track rapid community interactions and metabolic fluxes in real time. Using in vitro tools to resolve these transient pathways will provide key mechanistic insights that can then be used to better design and validate subsequent, fully powered human interventions.
Nevertheless, these proof-of-concept data from our human trial indicate that cellobiose is well-tolerated and shows a promising trend towards modulating the gut microbiota.
Establishing the definitive prebiotic status of cellobiose will require a broader body of evidence, as outlined by consensus panels (Gibson et al., Reference Gibson, Hutkins, Sanders, Prescott, Reimer, Salminen, Scott, Stanton, Swanson, Cani, Verbeke and Reid2017; Hutkins et al., Reference Hutkins, Walter, Gibson, Bedu-Ferrari, Scott, Tancredi, Wijeyesekera and Sanders2024). Future work should also build on the findings of this study by employing larger, longer-duration clinical trials with predefined health endpoints. Furthermore, applying methods such as shotgun metagenomics and metabolomics in future trials would allow for a mechanism analysis, directly linking specific microbial genes to the metabolic products of cellobiose fermentation in the human gut.
Supplementary material
The supplementary material for this article can be found at http://doi.org/10.1017/gmb.2026.10032.
Data availability statement
Processed data supporting the findings of this article will be publicly deposited in the University of Reading Research Data Archive upon acceptance for publication. The data are fully de-identified to comply with ethical and privacy guidelines and the Helsinki Declaration. The data are currently available from the corresponding author, R.A.R., upon reasonable request and for peer review purposes. The study protocol was pre-registered at ClinicalTrials.gov (Identifier: NCT07097389) and the full protocol document is provided within the Supplementary Material accompanying this article.
Acknowledgements
The authors would like to express their sincere gratitude to Dr. Abigail Basson and Dr Patricia Sanz Morales for their invaluable guidance with 16S rRNA sequencing and GC-FID. We also thank Christy Chung for her technical assistance. Finally, the authors acknowledge Savanna Ingredient GmbH for providing the cellobiose used in this study.
Author contribution
Conceptualization, M.H. and R.A.R.; Methodology, P.P.J.J.; Investigation, M.H.; Project administration, M.H., A.C., and R.A.R.; Supervision, P.P.J.J., A.C., and R.A.R.; Writing—original draft, M.H.; Writing—review and editing, P.P.J.J., A.C., and R.A.R.
Funding
This research received no specific grant from any funding agency, commercial, or not-for-profit sectors.
Disclosure statement
No conflict of interest declared from author(s).


 Open access

