Introduction
The concept of nanogaps, which are nanoscale gaps between nanostructures, has become one of the cornerstones of the field of plasmonics due to the enormous electromagnetic (EM) field enhancement and strong confinement of the optical field that can be induced between closely adjacent metal nanostructures. The optical properties of nanogaps are very important for surface-enhanced Raman scattering (SERS),Reference Haran1–Reference Lim, Jeon, Kim, Nam and Suh4 but they have also influenced other areas of nano-optics, including nonlinear plasmonics,Reference Hanke, Cesar, Knittel, Trugler, Hohenester, Leitenstorfer and Bratschitsch5,Reference Abb, Albella, Aizpurua and Muskens6 nano-optical forces,Reference Grigorenko, Roberts, Dickinson and Zhang7,Reference Zhang, Huang, Santschi and Martin8 optical nanoantennas,Reference Novotny and Hulst9,Reference Biagioni, Huang and Hecht10 and nanolasers.Reference Kim, Jin, Kim, Park, Kim and Kim11 Localized surface plasmons (LSPs) can be excited in single metal particles and produce enhanced local EM fields, but unless the single particle has a very sharp feature, these fields are typically much weaker than that in a nanogap. The nanogap effect occurs because individual nanostructures couple electromagnetically if they are brought close to each other. The EM coupling results in additional near-field enhancement in the nanogap, forming the so-called “hot spot,” and this effect can amplify both the driving field and the radiative emission rate of an emitter located in the gap.Reference Xu, Aizpurua, Käll and Apell12,Reference Schatz, Young and Van Duyne13 In many cases, this is the basic reason why SERS is such a sensitive spectroscopic tool for molecular analysis.Reference Xu, Bjerneld, Käll and Borjesson14–Reference Pieczonka and Aroca17 In this article, we briefly review some important concepts and experimental results on nanogaps for SERS. (See the August 2013 issue of MRS Bulletin on SERS substrates and materials.)
The gap distance is one of the crucial parameters that determines the magnitude of the local EM field. The additional field enhancement in the gap only occurs if two metal nanoparticles (NPs) are close to each other. “Close” here refers to a distance comparable to the extension of the evanescent EM near-field induced through excitation of a plasmon resonance. This distance is typically much smaller than the vacuum wavelength and often of the same order as the characteristic dimension of the nanostructure. With a further decrease in separation, the strength of EM coupling increases sharply, leading to a rapidly increased field enhancement in the nanogap.Reference Gunnarsson, Rindzevicius, Prikulis, Kasemo, Käll, Zou and Schatz18,Reference Tabor, Murali, Mahmoud and El-Sayed19 The increase continues until the distance between the two metal surfaces becomes so small that electron spill-out and non-local effects become important, eventually leading to electronic tunneling and electrical shortcut. The dominant current view is that classical electrodynamics provides a good description down to gap distances of the order of one nanometer, after which quantum and non-local theory approaches have to be used.Reference Savage, Hawkeye, Esteban, Borisov, Aizpurua and Baumberg20–Reference Scholl, Koh and Dionne22
Dipole approximation and voltage division
The strength of EM coupling between two metal NPs strongly depends on the gap distance, particle geometries, and excitation configurations.Reference Willets and Van Duyne3,Reference Xu, Bjerneld, Aizpurua, Apell, Gunnarsson, Petronis, Kasemo, Larsson, Höök and Käll23–Reference McMahon, Li, Ausman and Schatz26 As illustrated in Figure 1, the optical properties of a nanoparticle dimer, which is the most well-studied gapped structure in SERS and plasmonics, can be discussed starting from two simple but very different models.
(a) Schematic illustration of the induced dipole fields generated by two metal nanoparticles (NPs) driven in-phase in parallel and perpendicular excitation configurations. (b) Schematic illustration of the “voltage division” model of the electric-field enhancement. D and d represent the diameter of the NPs and the gap distance, respectively. Simple geometrical considerations suggest that the local electric field Eloc is approximated by  $E_{loc} = E_0 {{\left( {D + d} \right)} \mathord{\left/ {\vphantom {{\left( {D + d} \right)} d}} \right. \kern-\nulldelimiterspace} d}$ within the gap region. Reproduced with permission from Reference 23. © 2011 SPIE.

In the dipole approximation, a NP situated in a medium with permeability  ${\varepsilon _m}$ acquires a dipole moment
 $P = {\varepsilon _m}\alpha \,{E_0}$ when illuminated with light with electric field strength
 ${E_0}$. The wavelength dependent polarizability α contains all the information about the plasmon resonances in the particle. The oscillating dipole, in turn, generates an induced near-field that is strongest in the direction of the dipole moment. At a point r just outside the dipole, the total local field becomes
 $E_{loc} \approx E_0 + {P \mathord{\left/ {\vphantom {P {2\pi \varepsilon _0 r^3 }}} \right. \kern-\nulldelimiterspace} {2\pi \varepsilon _0 r^3 }}$, which can be significantly enhanced compared to the driving field if the particle is driven at resonance. In the case of two nearby particles, we instead have two induced fields that have to be added coherently to the driving field. As illustrated in Figure 1a, we can distinguish two special cases (i.e., when the polarization of the driving field and therefore the induced dipole moments are parallel and perpendicular to the dimer axis).Reference Moskovits27–Reference Kerker29 In the former case, there will be a strong field enhancement in the gap region because the strongest near-fields generated by the two particles act in concert. In the perpendicular case, on the other hand, the gap region falls completely outside the region of strongest near-fields. Moreover, from Figure 1a, we see that the induced field from one particle either opposes or helps drive the neighboring dipole moment. This effect leads to the formation of two new “hybridized” dimer plasmon resonances that are blue-shifted (perpendicular polarization) or red-shifted (parallel polarization) with respect to the resonance wavelength of a single sphere.
Although the color changes associated with particle “dimerization” and the resulting plasmon hybridization can be reasonably well explained from the picture discussed previously, it turns out that this dipole approximation severely underestimates the field-enhancement in the gap region in most cases. The reason is that the field distribution inside a gap that is small compared to the characteristic curvature of the two particles resembles that inside a parallel plate capacitor much more than that between two dipoles. To describe this situation accurately, one has to include hybridization between multipolar resonances up to a very high order using the Mie theory or advanced numerical methods. However, it is possible to estimate the enhancement in the gap based on the similarity to a capacitor in electrostatics. In this “voltage division” model, which is illustrated in Figure 1b, we assume two identical particles of diameter D separated by a gap distance d. The particles are subject to a field E0 polarized along the dimer axis. If we make the crude approximation that the particles are perfect conductors (disregarding that there would be no plasmon excitations), the total potential drop induced by the field has to occur inside the gap, which implies that the local field in the gap becomes  $E_{loc} = E_0 {{\left( {D + d} \right)} \mathord{\left/ {\vphantom {{\left( {D + d} \right)} d}} \right. \kern-\nulldelimiterspace} d}$. The SERS enhancement factor, commonly approximated as the fourth power of the EM field enhancement (the product of the intensity enhancements at the incident and the Raman-scattered frequencies), is then simply given by
 $M \approx {\left| {{D \over d} + 1} \right|^4}$, where M is the enhancement factor.
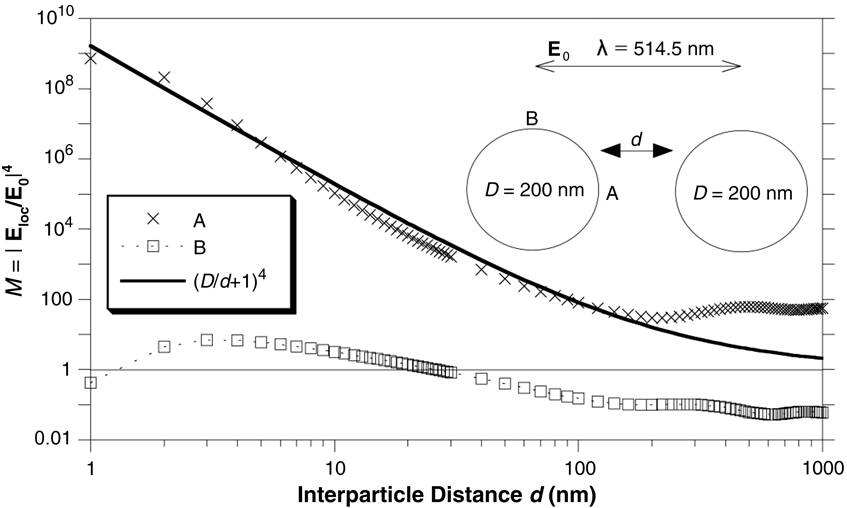
To illustrate the previous discussion, Figure 2 shows calculated SERS enhancement factors as a function of separation distance d.Reference Xu, Bjerneld, Aizpurua, Apell, Gunnarsson, Petronis, Kasemo, Larsson, Höök and Käll23 The calculation is based on Mie theory for coupled spheres, and we look at two different positions, indicated in the inset in Figure 2 as A and B, around a dimer composed of 200 nm Ag NPs that are excited by a plane wave polarized parallel to the dimer axis. The illumination wavelength is 514.5 nm, which is a common laser wavelength in SERS. It is seen that the enhancement factor approaches 109 at d = 1 nm, which is typically sufficient for single molecule detection. We also see that the simple electrostatic “voltage division” model  $M \approx \left( {{D \mathord{\left/ {\vphantom {D d}} \right. \kern-\nulldelimiterspace} d} + 1} \right)^4 $ is in excellent agreement with the full generalized Mie theory calculation for point A situated in the gap. Both electrostatics and Mie theory predict negligible enhancement at position B outside the gap.
Raman enhancement factor (M) versus gap distance for a dimer of 200 nm Ag nanoparticles excited by a 514.5 nm wavelength plane wave polarized parallel to the dimer axis. Crosses and squares refer to full electrodynamics simulations at positions A and B shown in the inset, respectively, while the full line is an estimate of the gap enhancement factor based on the “voltage division” model. Reproduced with permission from Reference 23. © 2011 SPIE.
Nanogaps in NP oligomers
It has long been known that aggregates of metal NPs are effective substrates for SERS measurements (see the August 2013 issue of MRS Bulletin). Large aggregates are typically used for practical SERS sensing due to multiple “hot spots” that are generated in the many crevices produced between densely packed particles while oligomers, such as dimers and trimers, are popular model systems for elucidating fundamental physical mechanisms in surface-enhanced spectroscopy and plasmonics in general.
Small NP aggregates, such as dimers, can be easily produced via either nanofabrication or controlled aggregation of colloidal metal NPs (e.g., by adding salts or molecules that disrupt colloid stability).Reference Gunnarsson, Bjerneld, Xu, Petronis, Kasemo and Käll30,Reference Meyer, Le Ru and Etchegoin31 The plasmonic response and Raman enhancement of dimers have been studied extensively.Reference Gunnarsson, Rindzevicius, Prikulis, Kasemo, Käll, Zou and Schatz18,Reference Brown, Sobhani, Lassiter, Nordlander and Halas32–Reference Shegai, Chen, Miljkovic, Zengin, Johansson and Käll36 Xu et al. investigated SERS from hemoglobin (Hb) protein molecules at single molecule concentrations and found that the signal exclusively originated from dimers or sometimes aggregates of a few particles, see Figure 3a. Based on Mie theory calculations, they concluded that enhancement in nanogaps was the key factor behind the single molecule SERS effect, which had previously been reported by Nie and EmoryReference Nie and Emery15 and Kneipp et al.Reference Kneipp, Wang, Kneipp, Perelman, Itzkan, Dasari and Feld16 The experimental SERS enhancement factor found by Xu et al. was of the order of ∼1010, which was in good agreement with simulations of enhancement in gap distances of the order of ∼1 nm. The enhancement factor was found to be ∼104 times larger than the highest enhancement outside a single Ag NP, which explains why no “hot spots” were found in single particles in the study.
(a) Scanning electron microscope (SEM) images of Ag nanoparticle (NP) dimers with corresponding surface-enhanced Raman scattering (SERS) spectra of single hemoglobin molecules excited using a 514.5 nm laser polarized along the double arrows. (b) SERS Fourier images of a dimer (left) and trimer (right), respectively. Insets show corresponding SEM images. Data were recorded using an oil immersion objective with numerical aperture NA = 1.3, and the dashed circles in the images indicate the critical angle of a glass–air interface supporting the NP clusters. (c) Depolarization ratio (ρ) of the emission of a dipole (indicated by a red arrow) located in the gap of an Ag NP dimer (left) and trimer (right, with polarization angles). The data in (a), (b), and (c) were reproduced with permission from References 14, 35, and 37, respectively.
Figure 3b–c gives two more recent examples of the many oligomer studies reported since the publication of Reference 14. Shegai et al. investigated the angular emission properties of surface-enhanced resonance Raman scattering (SERRS) from small Ag NP clusters incubated with Rhodamin 6G (R6G) using Fourier imaging, see Figure 3b. For the case of a dimer, the emission was found to be concentrated in two well-defined lobes pointing in the direction perpendicular to the dimer axis. This pattern is just what can be expected for a strong SERS transition dipole oriented along the main dimer direction and localized to the gap between the two particles.Reference Shegai, Brian, Miljkovic and Käll35 Similarly, the emission from a NP trimer was found to be in excellent agreement with a model based on three independent dipoles localized to the three gaps in the cluster.Reference Shegai, Brian, Miljkovic and Käll35
In small NP clusters, not only the intensity but also the phase of the Raman-scattered light can be modulated if the geometric symmetry is changed.Reference Li, Shegai, Haran and Xu37–Reference Shegai, Li, Dadosh, Zhang, Xu and Haran39Figure 3c illustrates this through the complex polarization dependence and the Raman emission depolarization observed for a trimer.Reference Li, Shegai, Haran and Xu37 Li et al. showed that by changing the position of the third NP with respect to the remaining dimer, the emission polarization of a dipole located at the dimer gap can be rotated, and the depolarization ratio can be changed due to the phase modulation.Reference Li, Shegai, Haran and Xu37,Reference Shegai, Li, Dadosh, Zhang, Xu and Haran39 For a linear trimer, the emission from the emitting dipole is linearly polarized along the axis, just like in the dimer case (see Figure 3c, left panel).Reference Li, Shegai, Haran and Xu37 However, if the third NP is moved to the right side of the SERS active dimer, the polarization angle with respect to the dimer rotates because of the asymmetric coupling between the three particles. If the three NPs are positioned as in an equilateral triangle, the polarization is further rotated, as seen in the right panel of Figure 3c. In this case, the emission was found to be homogeneously distributed over all angles, as might also be anticipated from the SERS Fourier map in Figure 3b.
Nanogaps in nanoparticle aggregates
Larger NP aggregates naturally contain a larger number of hot spots useful for SERS sensing.Reference Taylor, Lee, Scherman, Esteban, Aizpurua, Huang, Baumberg and Mahajan40–Reference Slaughter, Willingham, Chang, Chester, Ogden and Link43 An important characteristic is that large aggregates are usually not polarization sensitive—hot spots can be generated regardless of the incident polarization. This is especially useful for practical SERS applications. However, the complex geometry encountered in a large aggregate also complicates theoretical analysis of the optical near-field distribution and far-field response. Esteban et al. simulated the plasmon response of one-, two-, and three-dimensional gold NP aggregates.Reference Esteban, Taylor, Baumberg and Aizpurua41 Interestingly, their calculations showed that the average EM field enhancement in a one-dimensional gold NP chain excited at the lowest energy plasmon mode is only weakly affected by the extent of disorder if the chain contains more than ∼10 NPs. The optical response of two- and three-dimensional aggregates similar to aggregates encountered in experiments could be well described by the properties of a single one-dimensional chain.
The fabrication of NP aggregates in colloids for SERS is of great importance from a practical point of view. Experimental approaches include chemical binding using linker molecules, salt-driven aggregation of metal colloids, and NPs aggregated using optical tweezers.Reference Lim, Jeon, Kim, Nam and Suh4,Reference Meyer, Le Ru and Etchegoin31,Reference Svedberg, Li, Xu and Käll44,Reference Barrow, Wei, Baldauf, Funston and Mulvaney45 Chemical binding often requires special linker molecules designed to interact with the surface of the metal NPs. The nanogaps thus created provide hotspots for SERS detection of the linker or external molecules. Optical tweezers make use of a highly focused laser beam to trap and manipulate NPs in solution.Reference Prikulis, Svedberg, Käll, Enger, Ramser, Goksor and Hanstorp46–Reference Urban, Lutich, Stefani and Feldmann48 The technique is particularly attractive in the context of SERS because of the possibility of optically aggregating NPs in an optical trap through strong nano-optical interparticle forces. Thus, free floating NPs that pass through an optical trap already loaded with NPs are attracted to the trap due to plasmon coupling, leading to the formation of SERS active NP dimers or larger aggregates.Reference Miljkovic, Pakizeh, Sepulveda, Johansson and Käll49,Reference Li, Käll and Xu50 Integrated with microfluidic channels, optical tweezers may be used for lab-on-a-chip and reusable SERS sensors for real-time detection of analytes in solutions.Reference Tong, Righini, Gonzalez, Quidant and Käll51
Nanogaps in heterostructures
Nanogaps between metallic heterostructures, including NP heterodimers with different sizes/compositions, NP/nanohole, and NP/nanowire (NW) structures are of particular interest in terms of EM coupling and SERS applications.Reference Brown, Sobhani, Lassiter, Nordlander and Halas32,Reference Shegai, Chen, Miljkovic, Zengin, Johansson and Käll36,Reference Wei, Hao, Huang, Wang, Nordlander and Xu52–Reference Theiss, Pavaskar, Echternach, Muller and Cronin55 Due to the geometrical and/or compositional asymmetry, the EM coupling can behave very differently than in a homodimer of spherical NPs. For example, it has been shown that bimetallic NP dimers exhibit highly emission-angle dependent scattering spectra, resulting in a nano-optical “color routing” effect, that is, light of different wavelengths are scattered to different directions determined by the dimer.Reference Shegai, Chen, Miljkovic, Zengin, Johansson and Käll36
Individual nanoholes in a metal film normally do not produce sufficient EM enhancement for SERS, but if coupled with a metal NP, as shown in Figure 4a, significant Raman signals of a probe dye molecule (malachite green isothiocyanate, in this example) result.Reference Wei, Hakanson, Yang, Höök and Xu53 The explanation for this effect is that coupled NP-nanohole pairs form a relatively large “hot volume” at the small gap between the NP and the inner wall of the nanohole, as illustrated by three-dimensional finite difference time domain simulation shown in the inset of Figure 4a.
Surface-enhanced Raman scattering (SERS) from nanogaps in nanoparticle (NP)-nanohole and NP-nanowire heterostructures. (a) Scanning electron microscope (SEM) images of a single nanohole and a NP-nanohole structure together with corresponding SERS spectra of malachite green-isothiocyanate (MGITC) molecules adsorbed on the gold surface. Black line: SERS on a single nanohole. Red line: SERS on a single hole-particle pair. The inset shows the electric field distribution calculated within the heterostructure. (b) Remote SERS from a NP-nanowire coupled system. (i) SEM image. (ii) Optical graph of surface plasmon polariton propagation. (iii) Background corrected Raman image at 438 cm–1 of remotely excited MGITC located at the nanogap. The laser wavelength is 633 nm in both panels. Reproduced with permission from Reference 53. © 2008 Wiley and Reference 54. © 2009 American Chemical Society.
Metal NWs that support propagating surface plasmon polaritons can also couple to a NP and generate enhanced EM fields for SERS.Reference Wei, Hao, Huang, Wang, Nordlander and Xu52,Reference Fang, Wei, Hao, Nordlander and Xu54,Reference Hutchison, Centeno, Odaka, Fukumura, Hofkens and Uji-i56 If the incident laser is polarized perpendicular to the NW axis, a propagating plasmon mode with an enhanced EM field localized to the sides of the NW is created. This field can couple to an adjacent metal NP and induce a strong EM gap field between the particle and the wire. An interesting result of the propagating character of the wire plasmon is that the hotspot can be excited remotely, as shown in Figure 4b. The maximum enhancement is obtained with incident polarization normal to the surface of the NW and pointing to the center of the NP. Remote SERS can be realized in the NP-NW system that avoids direct thermal degeneration or damage to the molecules caused by the incident laser. Note that a cos Reference Ward, Grady, Levin, Halas, Wu, Nordlander and Natelson2θ dependence, instead of cos 4θ, of the Raman enhancement was observed in this work, due to the fact that only the incident EM enhancement is polarization dependent while the Raman emission is not.
Nanogaps between metal electrodes
Nanogaps between polycrystalline metal “nanofingers” can be formed using feedback-controlled metal electrodeposition. Studies of the polarization and separation dependent EM field enhancement at such gaps indicate that an incident EM field polarized across the nanogap induces the strongest local field.Reference Ward, Grady, Levin, Halas, Wu, Nordlander and Natelson2,Reference Tian, Liu, Li, Yang, Ren, Wu, Tao and Tian57,Reference Baik, Lee and Moskovits58 However, Herzog et al. observed the contrary behavior in SERS studies from nanogaps of 2–10 nm separation formed between two gold nanowires with roughened edges (left panel in Figure 5a).Reference Herzog, Knight, Li, Evans, Halas and Natelson59 It was found that the transverse polarization resulted in much higher Raman enhancement of the probe molecules [trans-1,2-bis(4-pyridyl)-ethylene (BPE) as a self-assembled monolayer on the gold surface] than the longitudinal case (across the gap).Reference Herzog, Knight, Li, Evans, Halas and Natelson59 It was argued that the transverse polarization excites dark plasmon modes (that do not radiate) at the nanogaps with stronger enhanced local fields, as revealed by cathodoluminescence imaging and finite element method calculations (Figure 5b). From a comparison with previously reported SERS measurements on mechanical break-junctions and electromigrated electrodes,Reference Ward, Grady, Levin, Halas, Wu, Nordlander and Natelson2 the authors concluded that an intense transverse dipolar plasmon mode coupled to multipolar plasmons localized to the nanogap region induce much stronger near-field and Raman enhancement for the transverse polarization, as indicated by the polarization dependence shown in the right panel of Figure 5a.
Surface-enhanced Raman scattering (SERS) from nanojunctions between gold nanowires with extended electrodes. (a) Left: SERS spectra of trans-1,2-bis(4-pyridyl)-ethylene (BPE) molecules on the gold surface excited at 785 nm laser for transverse (blue) and longitudinal (red) polarizations. Inset shows a scanning electron microscope image of the nanogap (scale bar: 100 nm). Right: Polarization dependence of Raman emission at 1550 cm–1 of BPE. (b) Finite element method simulations of electromagnetic enhancement at the two excitation polarizations indicated by the double-sided arrows. Reproduced with permission from Reference 59. © 2013 American Chemical Society.
Conclusion
Nanogaps between metal structures provide ultrastrong electromagnetic field-enhancement due to electrostatic effects and near-field coupling between localized surface plasmons. Surface-enhanced Raman scattering (SERS) is a direct application of this effect and also a measure that reflects the magnitude and polarization information of the enhanced gap fields. Nanogaps in aggregates of metal NPs, gaps between NPs and nanoholes and nanowires, and gaps between metal electrodes have been investigated in relation to SERS. In most cases, the results can be quantitatively understood based on the electromagnetic theory of SERS. Future investigations into the basic mechanisms of SERS are likely to focus on obtaining a detailed quantum mechanical and quantum optical understanding of how molecular and plasmonic degrees-of-freedom couple in strongly enhancing nanostructures, such as nanogaps. It is also likely that the quest for the optimal SERS substrate, be it gapped or un-gapped, will continue for many years to come.
This article complements the August 2013 issue of MRS Bulletin on SERS substrates and materials.
Lianming Tong is an associate professor in the Nanoscale Physics and Devices Laboratory of the Institute of Physics at the Chinese Academy of Sciences. His research interests lie in the field of nanophotonics and nanoplasmonics, with a focus in surface-enhanced spectroscopy, near-field optical microscopy, and relevant applications in chemistry and biology. Tong can be reached by email at lianming.tong@iphy.ac.cn.
Hongxing Xu is a professor at the Institute of Physics at the Chinese Academy of Sciences and Wuhan University, China. He earned his PhD degree in physics from Chalmers University of Technology in Sweden in 2002. His research interests include surface-enhanced Raman scattering, nanophotonics, single molecule spectroscopy, and plasmonics. Xu can be reached by email at hxxu@iphy.ac.cn.
Mikael Käll is a professor in the Department of Applied Physics at Chalmers University of Technology in Sweden, where he received his PhD degree in 1995 for work on Raman scattering from cuprate superconductors. He is head of the Division of Bionanophotonics and his research interests include plasmonics, optical antennas, SERS, surface plasmon biosensing and biophotonics. Käll can be reached at tel. +46 31 772 31 19 and email Mikael.kall@chalmers.se.