1. Introduction
In recent years, the issue of the aging population has gained significant attention from the public and the research community due to its socioeconomic impact. Traditional defined benefit (DB) plans, which place all the risks on the provider, have been questioned in terms of their adequacy and long-term sustainability. As a result, there is a global trend toward defined contribution (DC) plans, where employees accumulate retirement savings through mandatory or voluntary contributions to their retirement accounts. In countries like Australia and the United States (US), DC plans have emerged as the primary form of retirement plan, supplanting the earlier reliance on DB plans.
Although DC plans can alleviate pressure on pension providers, they may not be the best solution for individuals. According to Wise (Reference Wise2004), due to a lack of investment expertise, most US employees tend to accept default arrangements for crucial features such as contribution rates and investment choices. While these choices may be optimized based on a global criterion with an average view of the investment horizon and investor circumstances, they may not be appropriate for an individual’s risk appetite and life stage. Moreover, during the Global Financial Crisis in 2008, people in the US with DC pension arrangements suffered losses in their retirement accounts just as the value of their homes decreased dramatically by 20–30% (see Stiglitz, Reference Stiglitz2009). Similarly, Kovács et al. (Reference Kovács, Dömötör and Naffa2011) show that none of the European countries were immune to the effects of the 2007–2009 credit crisis, as sub-prime-led financial crisis caused massive losses in net asset value across different private pension schemes. In such situations, individuals tend to save more, further destimulating the overall economy.
In response to these challenges, Canadian pension sponsors are taking proactive measures to address current and future shocks by modifying the current pension system through the implementation of Target Benefit Plans (TPBs). Unlike traditional DB plans, TPBs distribute targeted benefits, which can be adjusted (both up and down) to balance the plan’s funding, rather than being guaranteed. This approach aims to provide greater flexibility in pension planning, allowing sponsors to make adjustments as necessary to ensure that the plan remains financially sustainable in the long term. In contrast to DC plans, TBPs pool both longevity and investment risk, providing greater security and stability for plan members. An in-depth analysis of the state of TBPs across Canada can be found in Steele (Reference Steele2016).
The risk pooling features of TBPs have led to their designation as collective DC (CDC) plans,Footnote 1 which have gained popularity in the Netherlands and the United Kingdom. Numerous studies, including one by Mitchell and Shea (Reference Mitchell and Shea2016), have demonstrated that grouping active members in the accumulation stage with those retiring and withdrawing from the fund leads to higher average pension incomes with greater predictability than conventional DC schemes. While the downside of risk sharing is the potential need to reduce benefits in extreme circumstances, reductions in the Netherlands have been minimal and significantly lower than those in the UK’s DC scheme. As a result of the success of CDCs in the Netherlands, other countries have begun to investigate their feasibility as an alternative to traditional pension systems. For example, an Aon report (see Wesbrooom et al., Reference Wesbrooom, Hardern, Areds and Harding2013) finds that a CDC in the UK produces substantially better outcomes than a DC plan. Chen and Rach (Reference Chen and Rach2021) provide a detailed discussion of the Zielrente, a hybrid German occupational plan consisting of both a collective and an individual fund, implemented in 2018. Their analysis suggests that target pension plans offer comparative advantages over traditional DB and some DC plans from a policyholder’s perspective.
TBP plans have gained industry-wide interest due to their risk pooling features. However, the mathematical structure of TBPs and their sensitivity to stochastic risk factors, such as investment return and salary fluctuation, is not well understood. Industry standard reports use constant investment parameters over a lengthy period, see for example, constant investment proportions such as 30% in risk-free assets and 70% in risky assets (the Aon report uses 40%/60%; see Wesbrooom et al. (Reference Wesbrooom, Hardern, Areds and Harding2013) over 20–30 years, which is inappropriate for a long-term perspective, especially during economic booms or financial crises. This paper addresses the gap by incorporating stochastic risk factors over a long-term period and studying a multi-period optimal investment–benefit problem for a TBP pension fund. Unlike the traditional continuous setting, see for example, Wang et al. (Reference Wang, Lu and Sanders2018), the analysis adopts a discrete-time framework that is consistent with periodic decision-making and data collection processes for a board of trustees.
TBP schemes are distinguished by their focus on providing targeted benefits to members rather than guaranteed benefits. Such schemes typically use a pension formula that considers various risk factors, such as projected salary inflation, to determine the target benefits. There are various ways to structure the payment system for a TBP, but this paper follows the approach proposed by Wang et al. (Reference Wang, Lu and Sanders2018), which uses a mean-target objective. This objective seeks to minimize the difference between the actual benefit payments and the target benefit, with the goal of achieving the closest possible match between the two. In addition, incorporating the target values directly into the objective function provides fund trustees with the flexibility to adjust their control strategies in response to regulatory or administrative requirements. By explicitly considering the target benefit levels, trustees can more easily make informed decisions about how to allocate the fund’s resources and manage risk. This approach also helps to ensure that the fund remains aligned with its overall goals and objectives, even as market conditions or other external factors change over time.
Using the mean-target objective, this paper incorporates the stochastic nature of investment risk and salary inflation risk into a multi-period optimization problem that reflects the risks faced by plan members. The fund trustee must determine both investment strategies and benefit distribution (relates to the replacement rate that is usually known in practiceFootnote 2), taking into account current market conditions, in order to maintain balance between active and retired members while ensuring the long-term stability of the fund. To obtain an analytical solution, the paper draws on the discrete-time dynamic programming approach proposed by Yao et al. (Reference Yao, Lai, Ma and Jian2014). By using this approach, the paper is able to effectively model the complex interplay between investment and benefit decisions over time, while also accounting for the inherent uncertainty and volatility of the market.
To determine when a TBP plan may be more beneficial than a DC scheme, it is important to consider the perspective of plan members. To establish a benchmark, we also explore an optimal investment problem for traditional DC schemes using the method proposed by Blake et al. (Reference Blake, Wright and Zhang2013). This method creates a target-based objective function for terminal wealth, which aligns with the mean-target objective used in TBP plans.
Our technical contribution addresses the challenging research problem of formulating and solving a multi-period dynamic programming problem. Traditionally, numerical procedures have been required, but these may not always lead to the global optimum, as demonstrated in previous work by Hibiki (Reference Hibiki2006). While some progress has been made in obtaining closed-form solutions for optimal portfolio selection under the mean-variance framework by Li and Ng (Reference Li and Ng2000) and under the utility maximization framework by Mei and Nogales (Reference Mei and Nogales2018), this paper extends the scope by incorporating an additional control variable, the replacement rate, and multiple risky assets. We achieve this by formulating a dynamic programming procedure with a matrix-variate structure. The existence of closed-form solutions depends on the invertibility, positivity, and comparability of the evolving matrices, which can be determined using the mathematical property of the Moore–Penrose pseudo-inverse of a symmetrical square matrix and the technique of reduction to absurdity.
In addition, this paper presents an empirical study based on real financial and salary data from Australia. The predominant pension scheme in Australia is the DC system, commonly known as superannuation in that context. The Australian government implemented a compulsory superannuation scheme in 1992, which requires employers to contribute a mandatory percentage of their employees’ salaries to a fund known as the superannuation guarantee (SG). The Superannuation Guarantee (Administration) Act 1992 established this system. The contribution rate has increased from 3% in 1992 to
 $9.5\%$
in 2017 and is projected to rise further to 12% by 2025, according to ASFA’s superannuation statistics from December 2019.
Our empirical study, focusing on the Australian market, examines the optimal benefit–investment strategy for a TBP scheme. We demonstrate that an optimized TBP offers greater stability in distributing funds across generations and enables precise control over benefit distribution by adjusting the objective function’s parameters. These features suggest that the TBP structure may help alleviate the impact of financial crises on retirees. By adjusting the fund’s target benefit over time, the TBP structure can effectively cushion the financial stress experienced by a particular generation during a crisis. Additionally, the incorporation of a wealth target in the objective function is crucial in providing benefits for generations retiring beyond the planning horizon. Our study demonstrates that the TBP serves as a relevant model of intergenerational risk sharing (IRS), a concept that has been extensively explored in the literature. For instance, Chen et al. (Reference Chen, Kanagawa and Zhang2023) examine the effectiveness of funding-ratio-linked declaration rates as a means of IRS in a CDC pension scheme. We refer the reader to the cited literature review for more information on IRS. It is worth noting that IRS is also applicable to a group of DC members. Chen et al. (Reference Chen, Nguyen and Rach2021) investigate the impact of guarantees, sharing rules, and management fees on a group of investors with varying risk preferences who are linked in their investment decisions.
Our study highlights the following key findings:
-
The benefit distribution in a TBP scheme is significantly influenced by the benefit target, while the wealth target has a limited impact. A high benefit target may not be achievable, whereas a low target can impede the fund’s wealth accumulation momentum in its early stages.
-
The investment strategy in a TBP scheme is primarily driven by the wealth target. A higher wealth target leads to a more aggressive investment into risky assets.
-
TBP trustees can achieve a more stable benefit distribution over time compared to a DC account by implementing optimal investment and benefit payment strategies, provided that the model parameters, such as the benefit target, wealth target, and weighting parameters, are carefully adjusted.
These findings offer valuable insights into the daily operations of a TBP fund, especially in determining optimal benefit distribution, investment strategies, and long-term wealth considerations. Our empirical studies demonstrate that the model parameters, such as weights, target benefit, and target wealth, significantly impact the performance of a TBP fund. Therefore, we suggest that before the trustee makes any decisions regarding daily operations, the government should provide guidance or even regulations for these settings to protect the interests of active and retired members.
The remainder of this paper is organised as follows. In Section 2, we provide an overview of the market setting and formulate the multi-period optimal control problem for a TBP pension. Section 3 presents the closed-form expressions for an efficient strategy. For comparative purposes, Section 4 presents the optimal investment strategy for the DC structure with a similar formulation. In Section 5, we present the empirical results and discuss the qualitative features of the TBP structure. Finally, Section 6 concludes the paper. To maintain conciseness, we defer all proofs to the appendices.
2. The optimal problem in a TBP
This section commences by formulating the aggregate wealth of the fund and explicitly detailing its accumulation dynamics. Based on this structure, we construct the optimal control problem in terms of the overall stability of the fund from the member’s point of view, equally weighted across generations of the members.
2.1. Notation and model specification
This paper focuses on a defined benefit pension (TBP) plan with a discrete-time stochastic nature and decision-making process. The benefit payments to each retiring cohort are determined by an exogenous salary process whose source is random and which may be correlated with the financial market. The pension fund invests in a combination of a risk-free asset and multiple risky assets. The plan trustees aim to adjust the benefit payments to stay close to the target while avoiding excessive borrowing or leaving an excessive surplus for future cohorts. The study considers a discrete-time horizon from time 0 to T, divided into intervals of length one unit,
 $[k,k+1),$
where k ranges from 0 to
 $T-1$
.
Remark 1. Although the literature frequently incorporates the interests of all generations (past and future) by considering an infinite planning horizon, in practice, target benefits are determined based on a long-term but finite viewFootnote 3 and scenario testing of the horizon. Furthermore, as Wang et al. (Reference Wang, Lu and Sanders2018) points out, the terminal valuation time T in a target benefit pension plan may be set at any time. A finite planning horizon is also evident in various regulations of TBPs. For example, the New Brunswick Shared Risk Plans RegulationFootnote 4 stipulates that the primary objective of risk management is to ensure that testing demonstrates a minimum 97.5% probability that the base benefits received at the end of each year will not be reduced throughout a 20-year period. In Section 5 of this paper, we select a value of
 $T=$
54, which represents the typical lifespan of a member who begins working at 25 years of age, retires at 65 years and then lives for an additional 14 years.
The notations used in this paper are listed below, for time k,
-
 $(\Omega,\mathcal{F},\mathcal{P})$
is a complete probability space, where
$\mathcal{F}\triangleq\{\mathcal{F}_{k}\, \textrm{for}\, k=0,1,..., T\}$
is the natural filtration generated by the processes for the securities in the economy;
-
${E_{k}}[{\cdot}]=E[{\cdot}\left|{\mathcal{F}_{k}}\right.]$
and
${Var_{k}}[{\cdot}]=Var[{\cdot}\left|{\mathcal{F}_{k}}\right.]$
represent, respectively, the expectation and variance operators under the condition of information set
$\mathcal{F}_{k}$
.
-
$x_{k}$
denotes the fund wealth;
-
$A_k$
denotes the total number of active members in the pool, while
$R_k$
is the total number of retiring members at k;
-
$B_{k}$
denotes the total benefits distributed to retired members and
$B_{k}^{*}$
denotes its corresponding target;
-
$c_{k}$
denotes the fixed proportion of one’s wage that is contributed to the fund;
-
$y_{k}$
denotes the average wage of the active members, and
$p_{k}$
denotes the stochastic ratio of the average wage over the period
$[k,k+1)$
, that is
$y_{k+1}=p_{k} y_{k}$
;
-
$\mathcal {C}_{k}$
denotes the total contributions from the active members, then
$\mathcal {C}_{k}=c_{k}y_{k}A_{k}$
;
-
$r_{k}$
denotes the deterministic gross rate of return of the risk-free asset,
$e_{k}=(e_{k}^{1},...,e_{k}^{n})^{\prime}$
Footnote 5 denotes the vector of the stochastic gross rate of return from n risky assets, and we define
\begin{equation*}\theta_{k}=e_{k}-r_{k}\textbf{{1}}, \quad {\eta_{k}}=\left({\begin{array}{c}{e_{k}}\\{p_{k}}\end{array}}\right);\end{equation*}
-
$\mathcal{{S}_{+}}$
and
$\mathcal{S}_{++}$
denote the set of positive semidefinite and positive definite matrices, respectively;
-
For any symmetric matrices
$\textrm{X}$
and
$\textrm{Y}$
with the same order, we denote
$\textrm{X}\ge\textrm{Y}$
if only if
$\textrm{X}-\textrm{Y}\in\mathcal{S}_{+}$
; and
$\textrm{X}>\textrm{Y}$
if only if
$\textrm{X}-\textrm{Y}\in\mathcal{S}_{++}$
. In particular,
$\textrm{X}\ge0$
if only if
$\textrm{X}\in\mathcal{S}_{+}$
; and
$\textrm{X}>0$
if only if
$\textrm{X}\in\mathcal{S}_{++}$
; -
$u_{k}=\left(u_{k}^{1},...u_{k}^{n}\right)^{\prime}$
denotes the vector for the amount of the fund’s wealth invested in the n risky assets. We point out that there is no exogenous injection or withdrawal of money throughout the running of our TBP fund: inflows result solely from members’ contributions, and outflows result from retirement withdrawals.


Remark 2. Setting the target benefits
 $B^{*}_{k}$
is a crucial measurement that reflects the interests of each generation and promotes IRS. As noted by Steele (Reference Steele2016), the target benefit is typically determined using a pension formula that takes into account various risk factors, including projected salary inflation. To facilitate a meaningful comparison with DC plans, directly comparing the targets of a TBP and a DC plan is not convenient due to their distinct collective and individual nature, respectively. In Section 5, we adopt a proportion of the final salary, commonly known as the replacement rate, to define
 $B^{*}_{k}$
. Once the target replacement rate is established, the target benefit
 $B^{*}_{k}$
can be computed by multiplying the final salary (obtained from data) by the target replacement rate. This approach will also be used to define the target benefit in a DC plan in Section 4.
We make the following assumption in accordance with the positive nature of the average wage.
Assumption 1.
We assume
 $p_{k}>0$
almost surely for
 $k=0,1,...T-1$
.
It is worth noting that we do not impose any particular parametric assumptions on
 $p_k$
. This reflects the stochastic nature of salary inflation, which has a direct impact on the fund’s wealth. The fund’s wealth process, denoted by
 $x_k$
, accumulates over discrete time intervals, pays benefits to retired members, and collects contributions from active members at the end of each period. Therefore, the dynamics can be modeled by:
 \begin{align}x_{k+1} & =(x_{k}-u^{\prime}_{k}\textbf{1})r_{k}+u^{\prime}_{k}e_{k}-B_{k+1}+\mathcal {C}_{k+1}\nonumber\\ & =x_{k}r_{k}+\theta^{\prime}_{k}u_{k}-B_{k+1}+c_{k+1}A_{k+1}y_{k}p_{k}.\end{align}
Following Equation (2.1), the fund trustee’s strategy for period
 $[k,k+1)$
is composed of two parts: the investment strategy
 $u_k$
implemented at time k, and the total benefit payment
 $B_{k+1}$
made to retired members at the end of the period, at time
 $k+1$
.
Definition 1.
Given the information available up to time k,
 $\mathcal{{F}}_{k}$
, we say that a strategy
 $\pi=[(u^{\prime}_{1},B_{2})^{\prime},...,(u^{\prime}_{T-1},B_{T})^{\prime}]$
is admissible if both
 $u_{k}$
and
 $B_{k+1}$
are finite and progressively measurable with respect to
 $\mathcal{F}_{k}$
. We use
 $\Theta_{k}(x,y)$
to denote the set of all such admissible strategies that start at time k and end at time T with the state (x,y); later on, we omit the explicit reference to (x,y) for the sake of brevity.
This model incorporates two sources of randomness along with time: the average wage growth rate (reflected by
 $p_k$
) and the stochastic investment market returns (reflected by
 $e_k$
). We make the following assumption.
Assumption 2. The covariance matrix
 \begin{eqnarray*}Var_{k}[\eta_{k}]&=&cov(\eta_{k},\eta_{k})=E_{k}\left[{(\eta_{k}-E_{k}[\eta_{k}])(\eta_{k}-E_{k}[\eta_{k}]{)}^{\prime}}\right]\\&=&\left({\begin{array}{c@{\quad}c}{cov(e_{k},e_{k})}\quad & {cov(e_{k},p_{k})}\quad \\[5pt]{cov(e_{k},p_{k})}\quad & {cov(p_{k},p_{k})}\quad \end{array}}\right)>0,\end{eqnarray*}
for
 $k=0,1,\;\cdots,\;T-1$
.
Assumption 2 is a mild condition that assumes the rate of return from the risky asset
 $e_{k}$
and the rate of increase from the average salary
 $p_{k}$
are relatively independent in practice. Even in cases where they are dependent, the time-lag in the dependence structure results in a small value for
 $cov_{k}(e_{k},p_{k})$
.
2.2. The long-term objective of the TBP structure
This section discusses the long-term objectives of the trustee responsible for managing the TBP retirement fund and presents a mathematical formulation of these objectives as a stochastic optimal control problem.
First, unlike the traditional DB structure that guarantees benefits, the TBP structure establishes a benefit target
 $B_{k}^{*}$
at time 0. The fund trustee sets this target as a guide for future benefit payments. The actual benefit payment
 $B_k$
depends on the fund’s wealth level at the end of each period, which the trustee then declares and distributes. The trustee aims to minimize the squared distance between the benefit
 $B_k$
and its target
 $B_k^*$
, which usually remains deterministic and stable over time. The resulting benefit payment
 $B_k$
is also expected to be stable over time, providing an advantage of TBP schemes over traditional DC schemes. Additionally, from the members’ perspective, if the actual benefit is lower than the target benefit, the fund fails to meet their expectations, and this shortfall should be penalized.
Second, it is the trustee’s responsibility to maintain a balance in benefits between active and retired members. If retired members receive an excessive temporary benefit payment, it may come at the expense of younger generations. To safeguard the interests of younger generations, a target terminal wealth must be set for their retirement. This target also ensures the long-term sustainability of the fund. For instance, one can use
 $x_{0}\prod_{i=0}^{T-1}{r_{i}}$
as the target terminal wealth, which represents a conservative expected wealth accumulated from the initial wealth
 $x_0$
at time 0 to time T. The trustee is responsible for investing and distributing the fund’s wealth in an appropriate manner to ensure that the terminal wealth
 $x_T$
remains close to the target. For generality, we adopt
 $x^*_{0}\prod_{i=0}^{T-1}{r_{i}}$
as the target terminal wealth in this paper, where
 $x^*_0$
is a factor set at time 0.
Let the notation
 $\pi$
be the strategy consisting of
 $u_{k}$
and
 $b_{k+1}$
, and
 $\Theta$
be the transformed admissible set for this strategy. To reflect the target benefit, target wealth, and their relationships with the actual benefit payment and resulting terminal wealth, we adopt a mean-target objective function. When putting these elements together into the long-term objective function,
 $f_{k}(y,x)$
, at time k with wealth x and average wage y, we have
 \begin{equation}\left\{ \begin{array}{l}{f_{k}}(y,x)=\mathop{\min_{\pi\in\Theta_{k}}}E_{k}\left\{ {\sum\limits _{t=k}^{T-1}{\left[{{{\left({{B_{t+1}}-B_{t+1}^{*}}\right)}^{2}}-2{\lambda_{1}}\left({{B_{t+1}}-B_{t+1}^{*}}\right)}\right]{\rho^{t+1-k}}}}\right.\\[9pt]\quad \quad \quad \quad \left.{+{\lambda_{2}}{\left({x_{T}}-{x_{0}^*}\prod\limits _{i=0}^{T-1}{r_{i}}\right)^{2}}{\rho^{T-k}}}\right\} \quad \text{subject to }\quad y_{k+1}=p_k y_k\quad \text{and}\quad (2.1),\\[9pt]{f_{T}}(y,x)={\lambda_{2}}{\left(x-{x_{0}^*}\prod\limits _{i=0}^{T-1}{r_{i}}\right)^{2}},\end{array}\right.\end{equation}
where
 $\lambda_{1}\ge0$
and
 $\lambda_{2}>0$
are the penalty weights given to the deviation of the true value from the target,
 $\rho>0$
is a discount factor, and
 $x_0^*$
is a factor such that
 $x^*_{0}\prod\limits_{i=0}^{T-1}{r_{i}}$
reflects the target wealth at time T. The choice of
 $\lambda_1$
and
 $\lambda_2$
reflects the balance of risks between the benefit adequacy for the current retiring generation and the interest of future generations. It is important to note that
 $B_k$
is distributed for only one generation retiring at time k, while
 $x_T$
is considered for the overall future generations. Therefore,
 $\lambda_1$
and
 $\lambda_2$
adopt different magnitudes, which will be illustrated in Section 5.
It should be noted that each year, members retiring from our TBP scheme receive a lump-sum benefit and leave the fund. On the other hand, all active members are in their accumulation phase. The fund trustee makes the investment decision for all active members collectively, which has two implications. Firstly, the investment decision is uniform for all active members, including those retiring in the future. Secondly, this decision is made jointly with benefit distribution decisions, taking into account the already retired members.
The advantages of adopting a mean-target objective function are evident. As discussed in Section 1, this approach provides a clear indication of targets and allows for a comprehensive analysis of the distribution of benefits and remaining wealth. It also facilitates the weighting of parameters based on the risk-sharing mechanisms between generations, making the structure transparent and intuitive for interpreting a TBP plan. By examining the effects of model parameters, the study can provide valuable guidance for the day-to-day operations of a TBP fund. Additionally, it provides simplicity, allowing us to solve the problem analytically. The mean-target framework leads to a quadratic control structure, which can be solved analytically and backwardly through time via the dynamic programming approach. Although the penalty on both upside and downside risks is a by-product of the mean-target anatomy, this is precisely what we need in this IRS strategy. This objective is consistent with the mean-target” objective, as pointed out by Wang et al. (Reference Wang, Lu and Sanders2018):
the practical objectives of a target benefit plan are then threefold: to provide benefits that are adequate (at or above the target), to maintain stability (benefits not too far from the target on either side), and to respect intergenerational equity (limiting transfers between generations).
Remark 3. Mortality risk and other risks. The two significant sources of risk that a pension fund member faces are wage inflation and the risky asset’s return, which are represented by the stochastic processes
 $p_k$
and
 $e_k$
. While mortality risks and the stability of the fund’s demographic structure also play crucial roles in real-life scenarios, we treat them as exogenous factors that are known in advance. Although it is theoretically possible to model these factors stochastically, doing so would increase the model’s complexity and lead to overly complicated solutions to our Bellman equations. To provide the fund’s demographic structure, we adopt overlapping generation models in Section 5, which are widely used to study intergenerational risks. This approach has been extensively discussed in previous studies such as Gollier (Reference Gollier2008) and Cui et al. (Reference Cui, De Jong and Ponds2011).
To account for interest rate risk, we allow the long-term projection of risk-free return to vary over time, but it remains a deterministic variable specified by analysts. In other words, it is exogenous. This deterministic assumption is reasonable because the rate is typically relatively stable over time, and the set of possible values is finite.
In terms of consumer price inflation (CPI) faced by members, the fund trustee can partially hedge the risk by selecting a benefit target that links to the long-term projection of the CPI. Hence, its stochasticity is not explicitly considered in our model.
Remark 4. Another feature of the TBP pension plan is its sharing mechanics of intergenerational risk. This paper employs parameters
 $\lambda_1$
and
 $\lambda_2$
to balance the benefits of retiring generations during [0, T] and the wealth available at time T for future retiring members. Section 5 investigates how parameters such as
 $\lambda_1$
,
 $\lambda_2$
, the benefit target
 $B^{*}_k$
, and the wealth target at time T affect the fund’s wealth and optimal strategies.
Solving problem (2.2) with the presence of two control variables,
 $B_{k+1}$
and
 $u_{k}$
, is not straightforward in the multi-period case. To make the problem technically tractable, we need to transform the objective function as shown below. By following a completion-of-square procedure, we obtain
 \begin{eqnarray*}&&E_{k}\left\{ {\sum\limits _{t=k}^{T-1}{\left[{{{\left({{B_{t+1}}-B_{t+1}^{*}}\right)}^{2}}-2{\lambda_{1}}\left({{B_{t+1}}-B_{t+1}^{*}}\right)}\right]{\rho^{t+1-k}}}+{\lambda_{2}}{\left({x_{T}}-{x_{0}^*}\prod\limits _{i=0}^{T-1}{r_{i}}\right)^{2}}{\rho^{T-k}}}\right\}\\[4pt]&=&E_{k}\left\{ {\sum\limits _{t=k}^{T-1}{\left[{{{\left({{B_{t+1}}-B_{t+1}^{*}-{\lambda_{1}}}\right)}^{2}}-\lambda_{1}^{2}}\right]{\rho^{t+1-k}}}+{\lambda_{2}}\left.{\left({x_{T}}-{x_{0}^*}\prod\limits _{i=0}^{T-1}{r_{i}}\right)^{2}}{\rho^{T-k}}\right)}\right\} \\[4pt]&=&E_{k}\left\{ {\sum\limits _{t=k}^{T-1}{{{\left({{B_{t+1}}-B_{t+1}^{*}-{\lambda_{1}}}\right)}^{2}}{\rho^{t+1-k}}}+{\lambda_{2}}\left.{\left({x_{T}}-{x_{0}^*}\prod\limits _{i=0}^{T-1}{r_{i}}\right)^{2}}{\rho^{T-k}}\right)}\right\}-\lambda_{1}^{2}\sum\limits _{t=k}^{T-1}{\rho^{t+1-k}}\end{eqnarray*}
The lengthy expression can be shortened by defining
 \begin{equation*}\alpha_{k}=x_{k}-x^*_{0}\prod\limits _{i=0}^{k-1}{r_{i}},\end{equation*}
 \begin{equation*}b_{k+1}^{\ast}=B_{k+1}^{\ast}+\lambda_{1},\end{equation*}
and
 \begin{equation*}b_{k+1}=B_{k+1}-B_{k+1}^{\ast}-\lambda_{1}=B_{k+1}-b_{k+1}^{\ast}.\end{equation*}
In problem (2.2),
 $x^*_{0}\prod\limits_{i=0}^{T-1}{r_{i}}$
is the wealth target at the terminal time T; here,
 $x^*_{0}\prod\limits _{i=0}^{k-1}{r_{i}}$
can be taken as the wealth target at time k. Consequently, the difference between the wealth
 $x_k$
and its target at time k can be expressed as
 $\alpha_{k}=x_{k}-x^*_{0}\prod\limits _{i=0}^{k-1}{r_{i}}$
, which represents the excess of wealth at time k. Then based on (2.1), we have
 \begin{eqnarray*} \alpha_{k+1} &=& x_{k+1}- x^*_{0}\prod\limits _{i=0}^{k}{r_{i}}\\ &=& x_{k}r_{k}+\theta^{\prime}_{k}u_{k}-B_{k+1}+c_{k+1}A_{k+1}y_{k}p_{k}- x^*_{0}\prod\limits _{i=0}^{k}{r_{i}}\\ &=& r_{k}\left(x_k-x^*_{0}\prod\limits _{i=0}^{k-1}{r_{i}}\right)+\theta^{\prime}_{k}u_{k}-B_{k+1}+c_{k+1}A_{k+1}y_{k}p_{k}\\ &=& r_{k}\alpha_{k}+\theta^{\prime}_{k}u_{k}-b_{k+1}-b_{k+1}^{\ast}+c_{k+1}A_{k+1}p_{k}y_{k}\end{eqnarray*}
The optimization problem (2.2) is equivalent to finding the optimal
 $b_{k+1}$
and
 $u_{k}$
for the following problem:
 \begin{equation}\left\{ {\begin{array}{l}V_{k}(y,\alpha)=\mathop{\min}\limits _{\pi\in\Theta_{k}}E_{k}\left\{ {\sum\limits _{t=k}^{T-1}{b_{k+1}^{2}\rho^{t+1-k}}+\lambda_{2}\alpha_{T}^{2}\rho^{T-k}}\right\}, \\[12pt]\text{subject to}\quad y_{k+1}=p_k y_k\text{ and}\\[8pt]\alpha_{k+1}\,=\alpha_{k}r_{k}+\theta^{\prime}_{k}u_{k}-b_{k+1}-b_{k+1}^{\ast}+c_{k+1}A_{k+1}p_{k}y_{k}\\[8pt]V_{T}(y,\alpha)=\lambda_{2}\alpha^{2}.\end{array}}\right.\end{equation}
Moreover, by comparing the objective functions of the optimization problems in Equations (2.2) and (2.3), we have
 $f_{k}(y,x)=V_{k}(y,\alpha)-\lambda_{1}^{2}\sum\limits_{t=k}^{T-1}{\rho^{t+1-k}}$
.
3. Solution to the optimization problem
3.1. A further transformation into matrix form
To proceed with solving the problem in Equation (2.3), we first transform it into its matrix form. Let
 $\textrm{0}_{i\times j}$
denote the zero matrix with the dimensions
 $i\times j$
, and
 \begin{equation}\left\{ \begin{array}{l}{z_{k}}=\left({\begin{array}{c}{y_{k}}\\[4pt]{\alpha_{k}}\end{array}}\right),\quad {\pi_{k}}=\left({\begin{array}{c}{u_{k}}\\[4pt]{b_{k+1}}\end{array}}\right),\;{C_{k}}=\left({\begin{array}{c@{\quad}c}{p_{k}} & 0\\[4pt]{{c_{k+1}}{A_{k+1}}{p_{k}}} & {r_{k}}\end{array}}\right),\;\\[17pt]{D_{k}}=\left({\begin{array}{c@{\quad}c}{{\bf {0^{\prime}}}_{n\times1}} & 0\\[4pt]{{\theta^{\prime}}_{k}} & {-1}\end{array}}\right),{N_{k}}=\left({\begin{array}{c}0\\[4pt]{-b_{k+1}^{*}}\end{array}}\right),M=\left({\begin{array}{c@{\quad}c}0 & 0\\[4pt]0 & {\lambda_{2}}\end{array}}\right),L=\left({\begin{array}{c@{\quad}c}{{\bf {0}}_{n\times n}} & {{\bf {0}}_{n\times1}}\\[4pt]{{\bf {0^{\prime}}}_{n\times1}} & 1\end{array}}\right).\end{array}\right.\end{equation}
Then, problem (2.3) can be written in the form as:
 \begin{equation}V_{k}(z)=\mathop{\min}\limits _{\pi\in\Theta_k}E_{k}\left\{{\sum\limits_{t=k}^{T-1}{\rho^{t+1-k}{\pi}^{\prime}_{k}L\pi_{k}}+{z}^{\prime}_{T}Mz_{T}\rho^{T-k}}\right\},\text{subject to}\quad z_{k+1}=C_{k}z_{k}+D_{k}\pi_{k}+N_{k},\end{equation}
with a boundary condition
 $V_{T}(z)={z}^{\prime}Mz$
.
The optimization problem (3.2) is a discrete-time stochastic linear–quadratic (LQ) optimal control problem with a discount rate. The standard treatment of solving the stochastic LQ optimal control problem requires that the carrier matrices are positive definite matrices, that is,
 $L>0$
and
 $M>0$
in problem (3.2). However, both
 $L\in\mathcal{{S}_{+}}$
and
 $M\in\mathcal{{S}_{+}}$
in our model are irreversible (see (3.1)). This structure of
 $D_{k}$
, M, and L allows us to demonstrate the strictly positive definiteness and invertibility of some matrices critical for the existence of solutions (see Proposition 1 for more details). Thus, by combining our method with the classical method for solving the stochastic LQ optimal control problem, we can obtain the analytical solution of our model. The outline of the solving procedure is sketched in the next subsection.
3.2. The solution
Following the dynamic programming principle, we can derive the corresponding Bellman equation for Equation (3.2) as follows:
 \begin{equation}V_{k}(z)=\rho\mathop{\min}\limits _{\pi\in\Theta_k}E_{k}\left[{{\pi}^{\prime}_{k}L\pi_{k}+V_{k+1}(z_{k+1})}\right]=\rho\mathop{\min}\limits _{\pi\in\Theta_k}E_{k}\left[{{\pi}^{\prime}_{k}L\pi_{k}+V_{k+1}(C_{k}z+D_{k}\pi_{k}+N_{k})}\right].\end{equation}
To derive the expression for
 $V_{k}(z)$
, we construct a series of matrics
 $\Omega_{k}$
,
 $G_{k}$
, and
 $F_{k}$
for all
 $k=0,1,\;\cdots,\;T$
satisfying the following recurrence relation:
 \begin{equation}\left\{ {\begin{array}{l}\Omega_{k}=\rho\left({E_{k}\left[{{C}^{\prime}_{k}\Omega_{k+1}C_{k}}\right]-E_{k}\left[{{C}^{\prime}_{k}\Omega_{k+1}D_{k}}\right]\left({L+E_{k}\left[{{D}^{\prime}_{k}\Omega_{k+1}D_{k}}\right]}\right)^{-1}E_{k}\left[{{D}^{\prime}_{k}\Omega_{k+1}C_{k}}\right]}\right),\\[5pt]{G}^{\prime}_{k}=\rho\left({{N}^{\prime}_{k}\Omega_{k+1}E_{k}\left[{C_{k}}\right]+{G}^{\prime}_{k+1}E_{k}\left[{C_{k}}\right]-{N}^{\prime}_{k}\Omega_{k+1}E_{k}\left[{D_{k}}\right]\left({L+E_{k}\left[{{D}^{\prime}_{k}\Omega_{k+1}D_{k}}\right]}\right)^{-1}}\right.\\[5pt]\quad \quad \left.{\times E_{k}\left[{{D}^{\prime}_{k}\Omega_{k+1}C_{k}}\right]-{G}^{\prime}_{k+1}E_{k}\left[{D_{k}}\right]\left({L+E_{k}\left[{{D}^{\prime}_{k}\Omega_{k+1}D_{k}}\right]}\right)^{-1}E_{k}\left[{{D}^{\prime}_{k}\Omega_{k+1}C_{k}}\right]}\right),\\[5pt]F_{k}=\rho\left({F_{k+1}+{N}^{\prime}_{k}\Omega_{k+1}N_{k}+2{G}^{\prime}_{k+1}N_{k}-{N}^{\prime}_{k}\Omega_{k+1}E_{k}\left[{D_{k}}\right]\left({L+E_{k}\left[{{D}^{\prime}_{k}\Omega_{k+1}D_{k}}\right]}\right)^{-1}}\right.\\[5pt]\quad \quad \times E_{k}\left[{{D}^{\prime}_{k}}\right]\Omega_{k+1}N_{k}-{G}^{\prime}_{k+1}E_{k}\left[{D_{k}}\right]\left({L+E_{k}\left[{{D}^{\prime}_{k}\Omega_{k+1}D_{k}}\right]}\right)^{-1}E_{k}\left[{{D}^{\prime}_{k}}\right]G_{k+1}\\[5pt]\quad \quad \left.{-2{G}^{\prime}_{k+1}E_{k}\left[{D_{k}}\right]\left({L+E_{k}\left[{{D}^{\prime}_{k}\Omega_{k+1}D_{k}}\right]}\right)^{-1}E_{k}\left[{{D}^{\prime}_{k}}\right]\Omega_{k+1}N_{k}}\right)\end{array}}\right.\end{equation}
with boundary conditions at time T:
 \begin{equation}\Omega_{T}=M,\quad G_{T}=\textrm{0}_{2\times1},\quad F_{T}=0,\end{equation}
where
 $\Omega_{k}$
is a symmetric matrix of order
 $2\times2$
,
 $G_{k}$
is a column vector of order 2 and
 $F_{k}$
is a scalar. These boundary conditions are derived by equating the boundary condition equation
 $V_{T}(z)={z}^{\prime}Mz$
in problem (3.2) with
 $V_{T}(z)={z}^{\prime}\Omega_{T}{z}+2G_{T}^{\prime} z+F_T$
. These conditions represent the scenario at time T when no investment strategy decisions need to be made. In this case, the value function is solely determined by the terminal conditions.
It is worth noting that the series
 $\Omega_{k}$
,
 $G_{k}$
, and
 $F_{k}$
are independent of the state variable
 $z_{k}$
, and their recursion formulas and boundary conditions do not depend on
 $z_{k}$
. Based on Equations (3.4)–(3.5), we can obtain the estimated numerical values of
 $\Omega_{k}$
,
 $G_{k}$
, and
 $F_{k}$
for all
 $k=0,1,\cdots,T-1$
using historical or stochastic simulated data. In Appendix A, we provide the formulas for calculating the expectations of those random matrices or vector multiplications, such as
 $E_{k}\left[{{C}^{\prime}_{k}\Omega_{k+1}C_{k}}\right]$
,
 $E_{k}\left[{{C}^{\prime}_{k}\Omega_{k+1}D_{k}}\right]$
and
 $E_{k}\left[{{D}^{\prime}_{k}\Omega_{k+1}D_{k}}\right]$
. These formulas can be computed using the market data
 $E_{k}[p_{k}]$
,
 $E[p_{k}^{2}]$
,
 $E_{k}[p_{k}{\theta}^{\prime}_{k}]$
,
 $E_{k}[\theta_{k}]$
and
 $E_{k}[\theta_{k}{\theta}^{\prime}_{k}]$
. The calculations in Section 5 can be simplified accordingly.
The following proposition shows that
 $L+E_{k}\left[{{D}^{\prime}_{k}\Omega_{k+1}D_{k}}\right]>0$
and hence
 $\left({L+E_{k}\left[{{D}^{\prime}_{k}\Omega_{k+1}D_{k}}\right]}\right)^{-1}$
exists, which guarantees that the definition of Equations (3.4)–(3.5) is meaningful.
Proposition 1.
 $\Omega_{k}>0$
and
 $L+E_{k}\left[{{D}^{\prime}_{k}\Omega_{k+1}D_{k}}\right]>0$
for
 $k=1,\;2,\;\cdots,\;T-1$
.
The proof of Proposition 1 directly follows from Lemmas 1–3 in Appendix B. Lemmas 1 and 2 present a method for representing the returns from risky assets as a linear space. This allows for the investigation of their linear correlation, independence, and the representation of random variable groups. Additionally, necessary and sufficient conditions for the nonsingularity of the second-order moment matrix and the covariance matrix are provided. Lemma 3 provides the necessary and sufficient condition for the positive definiteness of the block matrix.
The proof for Proposition 1 is sketched as follows: we first simplify the expression of
 ${E_{k}}\left[{{{D^{\prime}}_{k}}{\Omega_{k+1}}{D_{k}}}\right]$
using the structure of
 $D_{k}$
and M (see (3.1)). Next, using mathematical induction and Lemmas 1–2, we show that
 $L+{E_{k}}\left[{{{D^{\prime}}_{k}}{\Omega_{k+1}}{D_{k}}}\right]>0$
for
 $k=1, 2, \cdots, T-1$
. We then decompose the matrix
 $\Omega_{k+1}$
into
 $J_{1}+J_{2}$
, where
 $J_{1}\in\mathcal{{S}_{+}}$
and
 $J_{2}$
has a special structure similar to M (see (3.1)). Using mathematical induction and the partition of positive semidefinite matrices (Lemma 3), we further prove
 $\Omega_{k}>0$
for
 $k=1, 2, \cdots, T-1$
. The complete proofs are presented in Appendix C.
We are now ready to state the main theorem of this paper.
Theorem 1. The solution to Bellman Equation (3.3), namely, the value function of problem (3.2) is given by:
 \begin{equation}V_{k}(z)={z}^{\prime}\Omega_{k}z+2{G}^{\prime}_{k}z+F_{k},\end{equation}
and the corresponding optimal strategy is given by:
 \begin{equation}\pi_{k}=-\left({L+E_{k}\left[{{D}^{\prime}_{k}\Omega_{k+1}D_{k}}\right]}\right)^{-1}\left({E_{k}\left[{{D}^{\prime}_{k}\Omega_{k+1}C_{k}}\right]z+E_{k}\left[{{D}^{\prime}_{k}}\right]\Omega_{k+1}N_{k}+E_{k}\left[{{D}^{\prime}_{k}}\right]G_{k+1}}\right),\end{equation}
where
 $\Omega_{k}$
,
 $G_{k}$
, and
 $F_{k}$
are determined by (3.4) and (3.5).
The proof of Theorem 1 is based on the classical stochastic LQ optimal control theory and the concept of mathematical induction. Specifically, when
 $k=T-1$
, we apply the method of differentiation (i.e., the first-order condition) to Bellman Equation (3.3) to obtain the optimal solution and the optimal value of the objective function, which is a quadratic function. This establishes the validity of the theorem for
 $k=T-1$
. Assuming the theorem holds for
 $k+1$
, we demonstrate, using first-order conditions and Bellman Equation (3.3), that it also holds for k (the methodology is akin to that of the
 $T-1$
case). By virtue of the principle of mathematical induction, we thus establish the result. The details of this proof are presented in Appendix D.
With reference to Theorem 1 and bearing in mind that
 $\alpha_{k}=x_{k}-x_{0}^*\prod\limits _{i=0}^{k-1}{r_{i}}$
and
 $f_{k}(y,x)=V_{k}(y,\alpha)-\lambda_{1}^{2}\sum\limits_{t=k}^{T-1}{\rho^{t+1-k}}$
, we have the following results for the original problem (2.2).
Theorem 2.
Let
 $x=x_{k},\;y=y_{k}$
for
 $k=0,1,\;\cdots,\;T-1$
, the optimal value for problem (2.2) is
 \begin{equation*}f_{k}(x,y)=\left({y,\;x-x_{0}^*\prod\limits_{i=0}^{k-1}{r_{i}}}\right)\Omega_{k}\left({\begin{array}{l}y \\{x-x_{0}^*\prod\limits _{i=0}^{k-1}{r_{i}}} \end{array}}\right)+2{G}^{\prime}_{k}\left({\begin{array}{l}y \\{x-x_{0}^*\prod\limits _{i=0}^{k-1}{r_{i}}}\quad \end{array}}\right)+F_{k}-\lambda_{1}^{2}\sum\limits _{t=k}^{T-1}{\rho^{t+1-k}},\end{equation*}
and the corresponding optimal strategy is given by:
 \begin{align*}{\pi_{k}} & =\left({\begin{array}{c}{u_{k}}\\[4pt]{b_{k+1}}\end{array}}\right)=-{\left({L+{E_{k}}\left[{{{D^{\prime}}_{k}}{\Omega_{k+1}}{D_{k}}}\right]}\right)^{-1}}\\[7pt] & \quad \times\left({{E_{k}}\left[{{{D^{\prime}}_{k}}{\Omega_{k+1}}{C_{k}}}\right]\left({\begin{array}{c}y\\[4pt]{x-{x_{0}^*}\prod\limits _{i=0}^{k-1}{r_{i}}}\end{array}}\right)+{E_{k}}\left[{{D^{\prime}}_{k}}\right]{\Omega_{k+1}}{N_{k}}+{E_{k}}\left[{{D^{\prime}}_{k}}\right]{G_{k+1}}}\right).\end{align*}
Theorem 2 demonstrates that the optimal value function of the optimal problem (2.2) is quadratic in nature and depends on both the present average wage level
 $y_{k}$
and the current excess wealth level (relative to risk-free investment)
 ${x_{k}}-{x_{0}^*}\prod\limits_{i=0}^{k-1}{r_{i}}$
. The optimal strategy
 $\pi_k$
takes the form of a linear feedback control, that is, a linear function of the present average wage level
 $y_{k}$
and the current excess wealth level
 ${x_{k}}-{x_{0}^*}\prod\limits_{i=0}^{k-1}{r_{i}}$
. Therefore, when determining the investment strategy
 $u_k$
and benefit payment strategy
 $B_{k+1}=b_{k+1}+B^*_{k+1}+\lambda_1$
(since
 $b_{k+1}=B_{k+1}-B^*_{k+1}-\lambda_1$
), the fund trustee must take into account both the current levels of wage and wealth.
The economic implications are not immediately apparent due to the stochastic nature and matrix form of the solution. However, we can gain insights by considering a special case where
 $k=T-1$
,
 $n=1$
(only one risky asset), and the coefficient matrices are deterministic. In this case, the optimal strategy can be simplified as follows:
 \begin{align*}{\pi_{T-1}} =\left({\begin{array}{c}{u_{T-1}}\\[5pt]{b_{T}}\end{array}}\right)=\frac{1}{\theta_{T-1}}\left({\begin{array}{c}b_{T}^*-c_{T}A_{T}p_{T-1}y-r_{T-1}\left({x-{x_{0}^*}\prod\limits _{i=0}^{T-2}{r_{i}}}\right)\\[5pt]0\end{array}}\right).\end{align*}
In the time period
 $[T-1, T]$
, since this scenario is deterministic, the benefit distribution is given by
 $B_{T}=B_{T}^*+\lambda_1$
(derived from
 $b_{T}=0$
). This means that we distribute the benefit according to the planned target
 $B_{T}^*$
, with the consideration of the weight
 $\lambda_1$
. Regarding the investment strategy, a higher target benefit
 $B_{T}^*$
or a higher weight
 $\lambda_1$
(then a higher
 $b_{T}^*=B_{T}^*+\lambda_1$
), as well as a higher wealth target
 ${x_{0}^*}\prod\limits_ {i=0}^{T-2}{r_{i}}$
, will result in a more aggressive investment in the risky asset. The implications of this relationship will be further explored in Section 5.
4. Results for DC plans
One of the primary goals of this paper is to compare the benefits provided by a TBP plan with those offered by a DC scheme. Members would prefer to join a TBP fund if it provides a more reliable and higher distribution of benefits than a DC plan. The study compares the performance of the two plans with respect to the replacement rate, which is the percentage of the final salary accounted for by benefit payments. In the case of a TBP fund, the objective function takes the form of a quadratic equation based on the benefit payments and terminal wealth. Conversely, in a DC fund, no benefit payments are made during the accumulation phase. Therefore, it is natural to express the problem in a targeted form, focusing only on the terminal wealth at retirement. In this section, we consider an individual employee who joins a DC fund at their first job. The terminal wealth at retirement is the sum of the accumulation from regular contributions and the investment income. To facilitate a comparison to that of TBP members, we express the DC objective in a targeted form for terminal wealth.
To maintain consistency with the notation used in Section 2 for TBP members, we adopt a similar notation for the DC structure, using a bar over the variable to indicate its DC counterpart. For instance,
 $\bar{y}_{k}$
represents the wage of a specific DC member. However, in contrast to a TBP fund where investment decisions and wealth accumulation are done collectively, a DC fund allows members to make individual investment decisions by selecting a portfolio mix. As a result, the formulation for a DC fund is based on an individual’s account balance (wealth) and follows the dynamics:
 \begin{align}\bar{x}_{k+1} & =(\bar{x}_{k}-\bar{u}_{k}^{\prime}\textrm{1})r_{k}+\bar{u}_{k}^{\prime}e_{k}+\bar{C}_{k+1}\nonumber\\\quad & =\bar{x}_{k}r_{k}+\bar{u}_{k}^{\prime}(e_{k}-r_{k}\textrm{1})+\bar{c}_{k+1}\bar{y}_{k+1}\\\quad & =\bar{x}_{k}r_{k}+{\theta}^{\prime}_{k}\bar{u}_{k}+\bar{c}_{k+1}\bar{p}_{k}\bar{y}_{k}.\nonumber\end{align}
Let
 $\bar{x}=\bar{x}_{k},\;\bar{y}=\bar{y}_{k}$
, define the objective function as:
 \begin{equation}\left\{ {\begin{array}{l}\bar{f}_{k}(\bar{y},\bar{x})=\mathop{\min}\limits _{\pi\in\Gamma_k(\bar{y},\bar{x})}E_{k}\left[{(\bar{x}_{T}-d)^{2}}\right]\quad s.t.\quad \bar{y}_{k+1}=\bar{p}_{k}\bar{y}_{k}\quad and\quad (4.1),\\[9pt]\bar{f}_{T}(\bar{y},\bar{x})=(\bar{x}-d)^{2},\end{array}}\right.\end{equation}
where d is the target wealth at terminal time T and
 $\Gamma_k(\bar{y},\bar{x})$
is the admissible set. To simplify the notation, we introduce a new state variable
 $\bar{\alpha}_{k}$
by defining
 $\bar{\alpha}_{k}=\bar{x}_{k}-d\mathord{\left/{\vphantom{d{\prod\limits_{i=k}^{T-1}{r_{i}}}}}\right.}{\prod\limits_{i=k}^{T-1}{r_{i}}}$
. Then, by (4.1), the dynamics of
 $\bar{\alpha}_{k}$
is expressed as follows:
 \begin{equation}\bar{\alpha}_{k+1}=\bar{\alpha}_{k}r_{k}+{\theta}^{\prime}_{k}u_{k}+\bar{c}_{k+1}\bar{p}_{k}\bar{y}_{k}.\end{equation}
By letting
 $\bar{y}=\bar{y}_{k}$
and
 $\bar{\alpha}=\bar{\alpha}_{k}$
, we can rewrite the optimization problem (4.2) as the following:
 \begin{equation}\left\{ {\begin{array}{l}\bar{V}_{k}(\bar{y},\bar{\alpha})=\mathop{\min}\limits _{u\in\Gamma_k(\bar{y},\bar{\alpha})}E_{k}\left[{\bar{\alpha}_{T}^{2}}\right],\quad s.t.\quad \bar{y}_{k+1}=\bar{p}_{k}\bar{y}_{k}\quad and\quad (4.3),\\[9pt]\bar{V}_{T}(\bar{y},\bar{\alpha})=\bar{\alpha}^{2}.\end{array}}\right.\end{equation}
Applying the dynamic programming principle, we can derive the Bellman equation for problem (4.4) as follows:
 \begin{equation}\left\{ {\begin{array}{l}\bar{V}_{k}(\bar{y},\bar{\alpha})=\mathop{\min}\limits _{u\in\Gamma_k(\bar{y},\bar{\alpha})}E_{k}\left[{\bar{V}_{k+1}(\bar{p}_{k}\bar{y},\bar{\alpha}r_{k}+{\theta}^{\prime}_{k}u_{k}+\bar{c}_{k+1}\bar{p}_{k}\bar{y})}\right],\quad s.t.\quad \bar{y}_{k+1}=\bar{p}_{k}\bar{y}_{k}\quad and\quad (4.3),\\[9pt]\bar{V}_{T}(\bar{y},\bar{\alpha})=\bar{\alpha}^{2}.\end{array}}\right.\end{equation}
To solve problem (4.5) analytically, we construct the series
 $w_{k}$
,
 $\phi_{k}$
, and
 $\psi_{k}$
for all
 $k=0,1,\;\cdots,\;T$
satisfying the following recurrence relation:
 \begin{equation}\left\{ {\begin{array}{l}w_{k}=w_{k+1}r_{k}^{2}\left({1-E_{k}[{\theta}^{\prime}_{k}]E_{k}^{-1}[\theta_{k}{\theta}^{\prime}_{k}]E_{k}[\theta_{k}]}\right),\\[5pt]\phi_{k}=\left({2w_{k+1}\bar{c}_{k+1}+\phi_{k+1}}\right)\left({E_{k}[\bar{p}_{k}]-E_{k}[{\theta}^{\prime}_{k}]E_{k}^{-1}[\theta_{k}{\theta}^{\prime}_{k}]E_{k}[\bar{p}_{k}\theta_{k}]}\right)r_{k},\\[5pt]\psi_{k}=\left({w_{k+1}\bar{c}_{k+1}^{2}+\phi_{k+1}\bar{c}_{k+1}+\psi_{k+1}}\right)E_{k}[\bar{p}_{k}^{2}]-\dfrac{\left({2w_{k+1}\bar{c}_{k+1}+\phi_{k+1}}\right)^{2}}{4w_{k+1}}E_{k}[\bar{p}_{k}{\theta}^{\prime}_{k}]E_{k}^{-1}[\theta_{k}{\theta}^{\prime}_{k}]E_{k}[\bar{p}_{k}\theta_{k}],\end{array}}\right.\end{equation}
with boundary conditions
 $w_{T}=1,\;\phi_{T}=0,\;\psi_{T}=0.$
Proposition 2.
 $w_{k}>0$
for
 $k=0,\;1,\;\cdots,\;T$
.
The proof of Proposition 2 uses mathematical induction and Lemma 3 (see Appendix E for details). Proposition 2 guarantees the existence of solutions to problem (4.4). Based on Proposition 2, we have the following theorem.
Theorem 3.
Let
 $\bar{\alpha}=\bar{\alpha}_{k},\;\bar{y}=\bar{y}_{k}$
, then for
 $k=0,1,\;\cdots,\;T$
, the solution to Bellman Equation (4.5), namely, the value function of problem (4.4) is given by:
 \begin{equation}\bar{V}_{k}(\bar{y},\bar{\alpha})=w_{k}\bar{\alpha}^{2}+\phi_{k}\bar{y}\bar{\alpha}+\psi_{k}\bar{y}^{2},\end{equation}
and the corresponding optimal strategy (for
 $k=0,1,\;\cdots,\;T-1$
) is given by:
 \begin{equation}u_{k}^{\ast}=-E_{k}^{-1}[\theta_{k}{\theta}^{\prime}_{k}]\left({r_{k}E_{k}[\theta_{k}]\bar{\alpha}+\frac{2w_{k+1}\bar{c}_{k+1}+\phi_{k+1}}{2w_{k+1}}E_{k}[\bar{p}_{k}\theta_{k}]\bar{y}}\right),\end{equation}
where
 $w_{k}$
,
 $\phi_{k}$
, and
 $\psi_{k}$
are determined by (4.6)
The proof of Theorem 3 follows a similar approach to that of Theorem 1 (refer to Appendix F for details). Notably, based on the expression
 $\bar{\alpha}_{k}=\bar{x}_{k}-d\mathord{\left/{\vphantom{d{\prod\limits_{i=k}^{T-1}{r_{i}}}}}\right.}{\prod\limits_{i=k}^{T-1}{r_{i}}}$
, Theorem 3 shows that the optimal value function of problem (4.4) for the DC plan is a quadratic function of the current average wage
 $\bar{y}_k$
and the current excess target wealth, that is, the difference between the current account balance
 $\bar{x}_{k}$
and the discounted value of the terminal target wealth d. Moreover, the optimal investment strategy is a linear feedback control that depends on the current average wage
 $\bar{y}_k$
and the current excess target wealth,
 $\bar{x}_{k}-d\mathord{\left/{\vphantom{d{\prod\limits_{i=k}^{T-1}{r_{i}}}}}\right.}{\prod\limits_{i=k}^{T-1}{r_{i}}}$
.
5. Empirical tests
This section provides a numerical example to illustrate the characteristics of our models’ operations. Specifically, we examine the effects of model parameters such as
 $\lambda_1$
,
 $\lambda_2$
, target benefit, and target wealth on the benefit distribution and investment strategy in the case of a TBP plan. We also investigate the long-term behavior of the wealth process and funding ratio process. Additionally, we introduce a target replacement ratio to define the target benefit in a TBP and the target accumulation in a DC plan. We compare the optimal benefit distribution and the resulting wealth process between a TBP and a DC plan.
Our findings reveal that the wealth process in a TBP plan exhibits smoother dynamics compared to a DC plan, particularly during the early accumulation phase. Moreover, by adjusting the model parameters, TBP members can expect higher and more stable benefits over time.
The demographic structure. Due to the lack of data on the age-structured working population and retiring population,Footnote 6 we utilize overlapping generation (OLG) models to describe the demographic structure. OLG models are widely used for analyzing macroeconomic dynamics (Galor, Reference Galor1992) and life cycle behavior such as saving for retirement (Fanti and Gori, Reference Fanti and Gori2012). A unique characteristic of OLG analysis is that individuals live for a finite period, long enough to overlap with at least one period of another member’s life. This paper employs a particular OLG model to characterize the age distribution, which is analogous to the one utilized in Gollier (Reference Gollier2008) to examine a CDC fund. The empirical analysis covers a span of 54 years from 1965 to 2018, denoted by
 $T=54$
. In each year
 $k=1,2,...,T$
, a new generation of workers aged 25 years starts contributing 10% of their salary, while another generation aged 65 years retires with an endogenously determined pension benefit
 $B_{k}$
. The benefit
 $B_k$
is distributed as a lump-sum payment to support each member surviving for 14 years after retirement, with the limiting age of 80 years. The replacement rate is calculated as follows:
 \begin{equation*}\frac{B_{k}}{14y_{k}^{f}}\end{equation*}
where
 $y_{k}^{f}$
represents the final salary per year of a member. This replacement rate indicates the percentage of the individual’ s final salary that is replaced by their retirement income, which reflects the extent to which a pension system effectively provides retirement income that can sustain the quality of life of its members. As per the latest data from the Organisation for Economic Co-operation and Development (OECD), this figure was only 41% in Australia in 2018.
Final salary
 $y_{k}^{f}$
. As the average earnings data from the Australian Bureau of Statistics (ABS) is segmented by age, the actual primary data
 $y_{k}^{f}$
cannot be accessed publicly. However, it is commonly observed that individuals tend to reduce their work commitments as their living expenses decrease, such as after paying off their home loans, in the years leading up to retirement. Hence, it is assumed in this paper that the final salary of an individual is a fraction, less than 1, of their average earnings. Specifically, it is assumed that the final salary is 80% of the average earnings.
5.1. Data structure and statistical estimation for the financial market and earnings
The equity market holds a prominent position among Australia’s investment markets. According to recent data, Australian listed shares account for over 22% of superannuation funds, while international stocks make up 25% of such funds.Footnote 7 Australian equities are known for offering higher dividends compared to other countries, which can be attributed to specific tax treatments as discussed in Bergmann et al. (Reference Bergmann2016). Therefore, when measuring the returns on Australian equities, it is essential to account for dividend payments. In this paper, equity returns refer to the total shareholder return (TSR), which is the sum of capital gains and dividends. To obtain the time series for TSR, we rely on a newly compiled dataset on the equity market that was published by the Reserve Bank of Australia (RBA) in August 2019. The dataset provides quarterly data from different types of companies, including the financial sector (especially banks), resources sector (mainly miners), and others (excluding financials and resources). We extract the time series from 1965 to 2018, totaling 54 years, to model the three risky assets (financial, resources, and others).
Regarding the risk-free rate, we use the deposit interest rate paid by commercial or similar banks for demand, time, or savings deposits. The International Monetary Fund collects and documents this rate, which is published in the International Financial Statistics. For earning data, we rely on the Average Weekly Earnings report published by the ABS. We extract annualized data from 1965 to 2018 to use in this study.
To obtain the conditional expectations and covariance matrices, we utilize an autoregressive vector structure of the time series data. The parameters for this model are estimated using the Bayesian method. There is an extensive body of literature on Bayesian vector autoregression and its associated estimation and forecasting techniques in macroeconomics. Detailed information on the Bayesian vector autoregressive model can be found in Kadiyala and Karlsson (Reference Kadiyala and Karlsson1997), while the appropriate choice of prior is discussed in Chan et al. (Reference Chan, Jacobi and Zhu2019). To avoid introducing additional mathematical notation in this section, we provide a brief description of the estimation procedure in Appendix G.
In this section, our focus is on the in-sample forecasts of the state variables. Using the Bayesian Markov chain Monte Carlo approach, we can conveniently generate in-sample forecasts for these variables conditional on the posterior draws. Therefore, we can easily compute the conditional mean and covariance, as used in Theorem 1.
5.2. Parameter settings
This subsection outlines the parameter values used in the model.
The initial wealth of TBP. It should be noted that retiring members are already accounted for in the TBP pension at the fund’s setup, as an initial fund is necessary in the TBP scheme to meet upcoming payment obligations. In line with Cui et al. (Reference Cui, De Jong and Ponds2011), this paper sets the initial fund value as the product of
 $f_0$
and the target benefit at the end of the first period
 $B^{*}_1$
, where
 $f_0$
can be adjusted to observe the impact of initial wealth. Specifically,
 $x_0=f_0 B^{*}_1$
, and the base value of
 $f_0$
is set to 1. Notably, compared to Cui et al. (Reference Cui, De Jong and Ponds2011), who use the fund liability (including the benefit for all the generations) as the initial wealth, our approach is conservative, as
 $B_{1}^{*}$
represents the benefit for only one generation. The optimal setting for initial wealth is beyond the scope of this paper, but we analyze the impacts of varying initial wealth in the next subsection. As noted by Gollier (Reference Gollier2008), this initial fund can be accumulated from existing individual accounts or raised through a privatization program.
The target benefit and target wealth. To simplify the presentation, we define the target benefit as a function of the target replacement rate denoted by
 $R_{tar}$
. Based on the demographic structure of OLG, the target benefit
 $B^{*}_k$
is computed as
 $R_{tar}\times 14 y^{f}_{k}$
. Additionally, we use
 ${x_{0}}\prod\limits _{i=0}^{T-1}{r_{i}}$
as the base value for the wealth target and adjust it by multiplying with
 $(W_{tar})^{T}$
to study the effects of different target wealth values. We set the base values as
 $R_{tar}=0.8$
and
 $W_{tar}=1.05$
.
The weights
 $\lambda_1$
and
 $\lambda_2$
. By choosing a higher value of
 $\lambda_{1}$
, the analyst places more emphasis on the well-being of members retiring before time T. To balance the welfare interests across generations, the parameter
 $\lambda_{2}$
represents the weight assigned to the fund surplus after deducting benefits. The goal of the trustee is to provide generous benefits to retired generations and accumulate large surpluses for active members. Thus,
 $\lambda_{1}$
and
 $\lambda_{2}$
can be viewed as the weights given to the interests of retiring and future generations, respectively. Since the benefit for a single retiring generation is much smaller than the total wealth of all active generations, the magnitude of
 $\lambda_2$
is typically much larger than
 $\lambda_1$
. We set the base values as
 $\lambda_1=1$
and
 $\lambda_2=10$
.
Other parameters. We set the discount factor to
 $\rho=0.95$
. The contribution rate remains constant at 10% throughout the period from 1965 to 2018. The number of active members is fixed at
 $A_k=40$
, while each generation has
 $R_k=1$
retired member staying with the fund, for
 $k=1,2,...,T$
.
The notations and base parameter values are summarized below.
-
Time span is from 1965 to 2018, that is,
$T=54$
. -
A member enters the TBP at the age of 25 years, retires at the age of 65 years, and leaves the fund with a lump-sum benefit payment. The survival time is 14 years until the limit age of 80 years.
-
The number of active members
$A_k=40$
. The number of retired members in the fund
$R_k=1$
. -
Final salary for members retiring at time k is
$y_k^f$
. -
Target benefit
$B_k^*=R_{tar}\times 14 y_k^f$
where
$R_{tar}=0.8$
. -
Target wealth
$(W_{tar})^{T}\times {x_{0}}\prod\limits _{i=0}^{T-1}{r_{i}}$
where
$W_{tar}=1.05$
. -
Initial wealth
$x_0=f_0 B_1^*$
where
$f_0=1$
. -
$\lambda_1=1$
and
$\lambda_2=10$
.
-
Discount factor
$\rho=0.95$
. -
Contribution rate 10%.
-
Three risky assets: Financial, Resources, and Others.


5.3. The features of TBP fund
TBP members are primarily concerned with the amount and stability of benefit payments distributed from the fund. On the other hand, the fund trustee focuses more on the investment strategy, the progression of the wealth process, and the corresponding funding ratio. In this subsection, we analyze how the model parameters in problem (2.2) affect these areas of interest.
The Effects of weights
 $\lambda_{1}$
and
 $\lambda_{2}$
.
The formulation of (2.2) suggests that parameter
 $\lambda_{1}$
controls the distribution of
 $B_{k}-B_{k}^{*}$
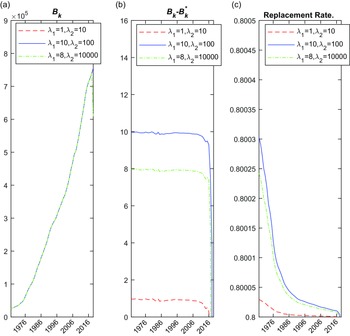
over time. This is confirmed by Figure 1, where we adopt three sets of
 $\lambda_{1}$
and
 $\lambda_{2}$
. Figure 1(a) shows the benefit payments
 $B_k$
plotted against time from 1966 to 2018, where the difference between the plots is not visible due to the large magnitude of the benefit payment. The excess benefit,
 $B_{k}-B_{k}^{*}$
, is mainly determined by the value of
 $\lambda_{1}$
, and the role of
 $\lambda_2$
is minimal, as shown in Figure 1(b). In other words, the benefit payment
 $B_k$
is primarily determined by
 $B_k^*$
and
 $\lambda_1$
, with minimal impact from
 $\lambda_2$
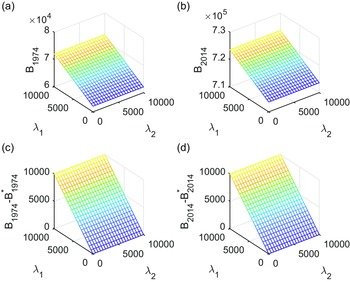
, which is further verified by Figure 2, where additional sets of
 $\lambda_1$
and
 $\lambda_2$
are plotted.
The effects of
 $\lambda_{1}$
and
 $\lambda_{2}$
on the benefit payments
 $B_k$
for
 $k=1966, 1967,..., 2018$
. (a) The value of
 $B_k$
. (b) gives the deviation of
 $B_k$
from the target benefit
 $B_k^*$
.(c) The value of benefit payment in terms of replacement ratio.

The joint effects of
 $\lambda_{1}\in[1, 10,000]$
and
 $\lambda_{2}\in[1, 10,000]$
on the benefit payments
 $B_k$
for 1974 and 2014. (a)
 $B_{1974}$
. (b)
 $B_{2014}$
. (c)
 $B_{1974}-B^*_{1974}$
. (d)
 $B_{2014}-B^*_{2014}$
.

Another notable observation is that the resulting benefit payment
 $B_k$
approaches
 $B_k^*$
as k approaches T. This trend is evident in Figure 1(c), where we plot the replacement rate against time. The replacement rate converges to 0.8, which can be attributed to the discount factor
 $\rho$
in (2.2). As we approach T under the mean-target framework, the level of stochastic randomness decreases, providing more certainty for the optimal control variable to attain the target.
Turning to investment strategies, Figure 3 shows how the
 $\lambda$
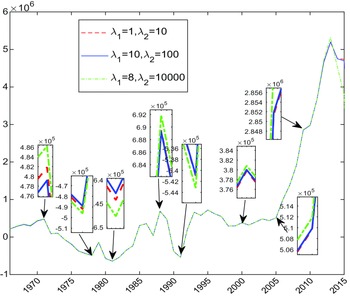
values affect the amount invested in the resources sector. Note that short-selling is allowed in the model formulation, and negative investment amounts around 1980 and 1990 can be attributed to two well-known economic recessions in Australia’s history, one caused by the 1973 oil crisis and the other by the early 1990s global recession that followed Black Monday in October 1987. It is reasonable for fund trustees to short-sell stock before prices drop and repurchase it at a lower price. Unlike the benefit payment,
 $\lambda_2$
plays a leading role in the investment behavior. When the investment amount is positive, the green line is the highest among the three scenarios, but when the amount is negative, it is the lowest. This means that the higher the emphasis on
 $\lambda_2$
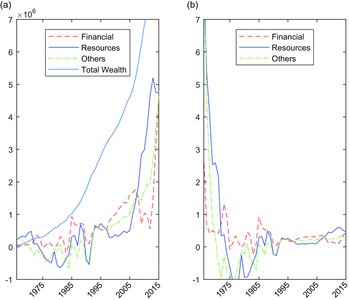
, that is, the greater the focus on the wealth target, the more aggressive the investment strategies, as observed in Figure 3. Figure 4 provides an overview of the investment allocation to three risky assets, where we see that the investment allocation to the resources sector has declined since the peak in 2012/2013, consistent with the practice observations from RBA.Footnote 8
The effects of
 $\lambda_{1}$
and
 $\lambda_{2}$
on the amount invested in the resources sector.

The allocations to three risky assets along with time with fixed
 $\lambda_1=1$
and
 $\lambda_2=10$
. (a) The investment amounts to three risky assets and the value of wealth process. (b) The percentage of wealth invested in the three risky assets.

The effects of the benefit target and final wealth target.
From the perspective of the fund trustee, how much flexibility is available in establishing the fund’s target benefits and wealth? This subsection aims to address this question by examining the impact of benefit targets and wealth targets on benefit payments and investment strategies. Setting appropriate benefit targets (
 $B^{*}_k$
) and wealth targets is crucial to achieving a balance between the benefits of retiring members and those of active members. However, when the fund is significantly in surplus and the initial wealth can support all generations financially, there may be less conflict between a high
 $B^{*}_k$
and a high wealth target. In such cases, higher
 $B^{*}_k$
would result in greater benefits for retiring members. Nevertheless, in other circumstances, the establishment of
 $B^{*}_k$
and the wealth target could lead to conflicting objectives.
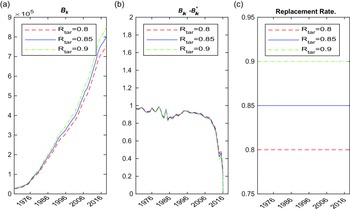
In Figure 5, we present the benefit payments for three target replacement rates
 $R_{tar}$
: 0.8, 0.85, and 0.9, using base values of
 $\lambda_{1}=1$
and
 $\lambda_{2}=10$
. As per our previous findings, we anticipate the difference between
 $B_k$
and
 $B^{*}_k$
to be approximately
 $\lambda_{1}$
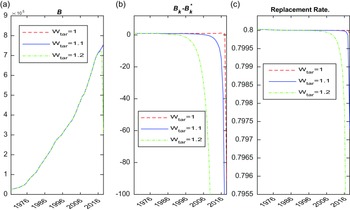
initially, gradually converging to 0 by 2018, as shown in Figure 5(b). The investment strategies proposed in this paper enable the achievement of the target replacement rate, as demonstrated in Figure 5(c), indicating adequate funding. Figure 6 displays the benefit payments for varying wealth targets
 $W_{tar}=$
1, 1.1, and 1.2, with a fixed benefit target of
 $R_{tar}=0.8$
. In cases where the wealth target is unrealistically high, such as
 $W_{tar}=1.2$
, the trustee must decrease benefits for members retiring between 0 and T. As time progresses toward T, the deviation between
 $B_k$
and
 $B^{*}_k$
in Figure 6(b) ultimately becomes negative, suggesting that achieving the target benefit may be unsustainable without jeopardizing the benefits of the current generation.
The effects of the benefit target
 $B_k^*$
on the benefit payments
 $B_k$
in terms of target replacement rate
 $R_{tar}$
. (a) The value of
 $B_k$
. (b) The deviation of
 $B_k$
from the target benefit
 $B_k^*$
. (c) The value of benefit payment in terms of replacement ratio.

The effects of the wealth target on the benefit payments
 $B_k$
. (a) The value of
 $B_k$
. (b) The deviation of
 $B_k$
from the target benefit
 $B_k^*$
. (c) The value of benefit payment in terms of replacement ratio.

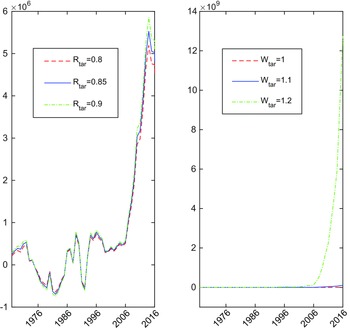
The effects of the benefit (left) and wealth (right) targets on the amount invested in the resources sector.

With regard to investment strategies, Figure 7 illustrates the amount invested in the resources sector for varying benefit targets (left) and wealth targets (right). Notably, both higher targets result in more significant investments in the long position (positive) for risky assets, and more selling in the short position (negative). The short positions observed around 1980 and 1990 could be attributed to economic recessions, consistent with the findings in Figures 3 and 4.
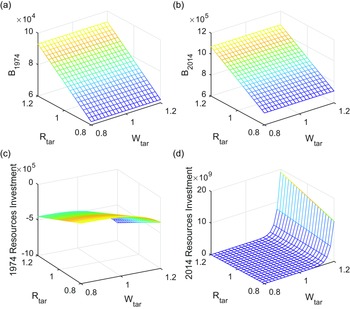
Figure 8 presents the joint impacts of benefit and wealth targets, showing the trends in benefit and investment strategies for 1974 and 2014. Figures 8(a) and (b) indicate that, with fixed values of
 $\lambda_1$
and
 $\lambda_2$
, the benefit distribution is mainly influenced by the target benefit, regardless of the wealth target. On the other hand, regarding investment strategies, Figures 8(c) and (d) suggest that the wealth target plays a more significant role and leads to a more aggressive strategy to achieve a higher wealth target.
The effects of the benefit and wealth targets in 1974 and 2014. (a) The impacts on benefit payment in 1974. (b) The benefit payment in 2014. (c) The investment amount in resources sector in 1974. (d) The investment amount in resources sector in 2014.

Is this structure sustainable over the long term?
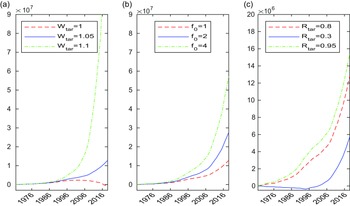
Figure 9 illustrates the progression of the TBP wealth process with varying wealth targets (see (a)), initial wealth
 $x_0=f_0 B^*_1$
(see (b)), and benefit targets (see (c)). Among these factors, the effect of initial wealth is most noticeable in Figure 9(b), as higher values of
 $x_{0}$
correspond to greater wealth for the fund.
The effects of the target wealth, initial wealth
 $x_0$
, and target benefit on the wealth process
 $x_k$
along with time.

Figure 9(a) depicts the impact of target wealth on the wealth process. As indicated in the previous analysis, an extremely ambitious target poses a challenge to the investment strategy across generations. However, setting an unreasonably low target is also inadequate. The red curve in Figure 9(a) represents a low target wealth at time T. With the results derived in this paper, the curve initially rises and then falls as the expiry date approaches. A low target wealth at T acts like a brake on wealth accumulation, and as time approaches T, the need to reach the low target wealth becomes more pressing. The investment strategy must react by forcing wealth decumulation, which can potentially result in negative values close to the expiry date.
Figure 9(c) illustrates the impact of target benefit on the wealth process. A low target replacement rate, such as 30%, which is significantly below the market average of 41% in Australia, can result in an unsatisfactory wealth process, as indicated by the blue curve. With each member’s retirement, the low target benefit undermines the wealth accumulation momentum in the early stages. As a result, the blue curve exhibits a declining trend, and even negative values, over the first several years, spanning about 20 years. As the deadline approaches, the pressure of the target benefit necessitates more aggressive strategies, resulting in an increasing trend as seen from 1995.
In summary, adjusting the model parameters carefully is crucial to establish a robust optimal strategy and to ensure the sustainability of the fund in the long run.
The funding ratio process.
The funding ratio expresses the ratio between a pension fund’s available assets and liabilities, reflecting its current financial position. In practice, fund managers often target the funding ratio at one. However, the empirical analysis of this paper, without considering rebalancing, implies a funding ratio that is purely determined by the market. The liability, defined as the total benefit payments for
 $A_k$
active members at
 $k=1,2,...,54$
, can be expressed as
 $A_k B_k$
, where
 $B_k$
denotes the lump-sum benefit to the retiring member at time k (with only one member). The asset is simply defined as the wealth
 $x_{k}$
, leading to the funding ratio process
 $x_k/(A_k B_k)$
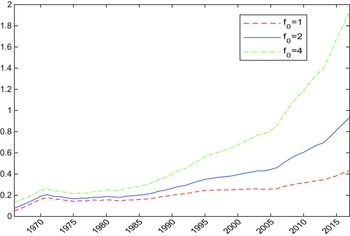
. Figure 10 illustrates the impact of initial wealth on the funding ratio process. As we explained in Section 5.2, when
 $f_0=1$
, the initial wealth
 $x_0=f_0 B^*_1=B^*_1$
represents the target benefit payment for only one retiree at each time k. Considering
 $A_k=40$
active members in the fund, this base value for
 $x_0$
is far from adequate to provide an adequate funding ratio. This explains the low values in the early stages of Figure 10. We then observe a small spike in growth until 1972. The subsequent relatively flat period from 1975 to 1985 corresponds to Australia’s economic recession. With the gradual improvement in the economy, the ratio climbs to the end of the planning horizon. Therefore, carefully managing the initial wealth is essential for maintaining an adequate funding ratio and ensuring the sustainability of the fund over the long term.
The effects of initial wealth
 $x_0$
on the funding ratio process along with time.

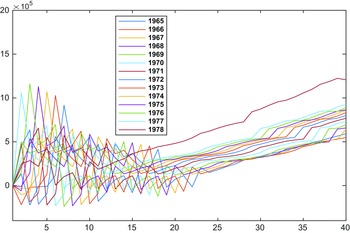
The wealth process of the DC account in 14 entry time scenarios.

5.4. The features of DC and comparison with TBP
In this subsection, we investigate the features of our optimal investment model for an individual DC account facing the same financial market as in Section 5.3. We assume that a member of the DC fund earns the average salary published by the ABS and contributes 10% of their salary to the fund for 40 years before retiring in 2005, 2006,…, 2018. We consider 14 scenarios in total. Unlike the TBP scenario, where the fund as a whole requires initial wealth, we assume that members of the DC fund have no savings at the beginning of their contribution period, that is,
 $\bar{{x}}_{0}=0$
. The 40 years of contributing and investing in the financial market lead to an accumulated value that will financially support their retirement. We adopt the investment strategy derived in Section 4 that corresponds to a target 100% replacement rate.
Static investment strategies.

The volatile wealth process.
Figure 11 illustrates the wealth processes for the 14 DC account entry time scenarios. Compared to the wealth processes in the TBP, the DC wealth processes are highly volatile, particularly in the first several years. Since the initial wealth is 0, the wealth processes are primarily driven by returns from the risky assets, which can fluctuate considerably. However, after 10–25 years of accumulation, the wealth processes smooth out and maintain an increasing trend over time. We also observe that late entry into the labor market can lead to higher earnings and salary inflation. However, due to the high volatility, it is still possible to retire with a low balance after 40 years of contribution. Furthermore, later generations require more financial support due to the effect of consumer inflation, which is the relative risk of DC pension schemes.
Additionally, it appears from Figure 11 that the entry time has a significant impact on achieving a desirable account balance at retirement. Those who start accumulating in 1978 have a much higher balance than those who start in other years. This higher balance could be attributed to the mining boom in Australia during the late 1970s and early 1980s, driven primarily by the energy market, particularly steaming coal, oil, and gas. Members who began accumulating around this period adopted an aggressive investment strategy and benefited from the booming financial market, especially in the resource sector, which left them with a substantial account balance by the late 1980s and the opportunity to switch dynamically to a more conservative direction.
Comparison with the static investment strategy.
The pension industry still favors static investment allocations due to their straightforward approach and strong historical performances. For instance, the Australian government’s MySuper initiative offers default products that are devoid of unnecessary features and charges. If employees do not choose their superannuation fund, they are automatically enrolled in the default MySuper product. The fund’s investment options have the same asset classes, but with varying weightings that match different risk appetites. We have utilized their weightings and titles from Table 1 for our static investment strategies.
The wealth processes resulting from the optimal strategy obtained in this study and four static strategies (cash, conservative, balanced, and growth) are compared in Figure 12. The DC account balance at retirement is shown on the y-axis for 14 scenarios, ranging from 2005 to 2018. Blue lines depict static investment cases, while red lines depict dynamic cases. As expected, the “growth” strategy has the highest balance among the four static options due to its high proportion of risky assets. However, a concerning observation for this strategy is its declining trend after 2015, which corresponds to workers who joined the DC fund in 1975. This trend could be due to the oil price shock that occurred during that period.
A comparison of the resulting wealth processes between the optimal investment strategy (with different target replacement rates) obtained in this paper and the four static investment strategies in Table 1.

While the dynamic cases exhibit slightly more volatility than the static cases, they often result in higher balances. We computed the account balance for four target levels, with higher targets indicating more aggressive dynamic investment strategies and consequently, greater accumulated account balances. To surpass static investment strategies, the critical adjustment required is to modify the target, which stimulates a steeper wealth accumulation trajectory.
DC versus TBP. Figure 13 compares the retirement benefits from a TBP plan and a DC account using optimal investment and benefit payment strategies. As expected, the TBP trustees provide a more stable benefit over time than a DC account. However, it is not guaranteed that retirees will receive a higher benefit from a TBP plan compared to a DC account. The two solid lines in the graph (red for DC and blue for TBP, with the same replacement rate target of 80%) demonstrate that a DC account can potentially yield a greater benefit amount than a TBP. To achieve a higher benefit payment, the TBP trustees must adjust either the
 $\lambda_1$
value or the target benefit, which aligns with our findings in Figures 1 and 2.
A comparison between the retirement benefit from a TBP (with different settings on
 $\lambda_1$
,
 $\lambda_2$
, and the target replacement rate) and a DC account.

6. Conclusion
In this paper, we conduct a multi-period analysis of the TBP pension scheme and compare it with the more conventional DC structure. Our approach utilizes a discrete-time stochastic framework to formally analyze and determine optimal investment and benefit payment decisions. Unlike traditional mean-variance and utility-based specifications, our objective function provides analysts with sufficient flexibility to adjust parameters in line with regulatory or administrative requirements. The joint modeling of the investment market and labor income market, along with collective decision-making regarding investment selection and replacement rates, allows our analysis to capture the impact of various factors and their interactions. While our empirical analysis is applied to Australian data, we identify several attractive features of the TBP pension scheme, such as a smoother benefit distribution over time and the flexibility brought by adjustable model parameters. However, we also uncover some alarming insights. As the TBP features stochastic dynamics and requires a more comprehensive set of model parameters, care is needed when setting up these parameters in practice. In cases where the target is inappropriate, the TBP can lead to disastrous performance, adversely affecting the current generation and resulting in long-term deterioration of members’ benefits. Our proposed stochastic modeling framework enables practitioners to analyze and identify key risk drivers in parameter settings.
Appendices
Appendix A. Formulas for some expectations
Our model involves some mathematical expectations, including random matrix or vector multiplication, such as,
 $E_{k}\left[{C_{k}}\right]$
,
 $E_{k}\left[{D_{k}}\right]$
,
 $E_{k}\left[{{C}^{\prime}_{k}\Omega_{k+1}C_{k}}\right]$
,
 $E_{k}\left[{{C}^{\prime}_{k}\Omega_{k+1}D_{k}}\right]$
,
 $E_{k}\left[{{D}^{\prime}_{k}\Omega_{k+1}D_{k}}\right]$
, etc. In the following, we give some of their formulas to facilitate the calculation.
Suppose that
 $\Omega_{k+1}=\left({\begin{array}{c@{\quad}c}{a_{k+1}^{11}}\quad & {a_{k+1}^{12}}\quad \\{a_{k+1}^{21}}\quad & {a_{k+1}^{22}}\quad \end{array}}\right)$
, then by (3.1), we have
 \begin{equation}E_{k}\left[{C_{k}}\right]=E_{k}\left[{\left({\begin{array}{l@{\quad}l}{p_{k}}\quad & {c_{k+1}A_{k+1}p_{k}}\quad \\[5pt]0\quad & {r_{k}}\quad \end{array}}\right)}\right]=\left({\begin{array}{l@{\quad}l}{E_{k}[p_{k}]}\quad & {c_{k+1}A_{k+1}E_{k}[p_{k}]}\quad \\[5pt]0\quad & {r_{k}}\quad \end{array}}\right),\quad E_{k}\left[{{C}^{\prime}_{k}}\right]=\left({E_{k}\left[{C_{k}}\right]}\right)^{\prime},\end{equation}
 \begin{equation}E_{k}\left[{D_{k}}\right]=E_{k}\left[{\left({\begin{array}{l@{\quad}l}{\textrm{0}^{\prime}_{n\times1}}\quad & 0\quad \\[5pt]{{\theta}^{\prime}_{k}}\quad & {-1}\quad \end{array}}\right)}\right]=\left({\begin{array}{l@{\quad}l}{\textrm{0}^{\prime}_{n\times1}}\quad & 0\quad \\[5pt]{E_{k}[{\theta}^{\prime}_{k}]}\quad & {-1}\quad \end{array}}\right),\quad E_{k}\left[{{D}^{\prime}_{k}}\right]=\left({E_{k}\left[{D_{k}}\right]}\right)^{\prime},\end{equation}
 \begin{equation}\begin{array}{l}\quad E_{k}\left[{{C}^{\prime}_{k}\Omega_{k+1}C_{k}}\right]=E_{k}\left[{\left({\begin{array}{l@{\quad}l}{p_{k}}\quad & {c_{k+1}A_{k+1}p_{k}}\quad \\[5pt]0\quad & {r_{k}}\quad \end{array}}\right)\left({\begin{array}{l@{\quad}l}{a_{k+1}^{11}}\quad & {a_{k+1}^{12}}\quad \\[5pt]{a_{k+1}^{21}}\quad & {a_{k+1}^{22}}\quad \end{array}}\right)\left({\begin{array}{l@{\quad}l}{p_{k}}\quad & 0\quad \\[5pt]{c_{k+1}A_{k+1}p_{k}}\quad & {r_{k}}\quad \end{array}}\right)}\right]\\[20pt]=\left({\begin{array}{l@{\quad}l}{\left({a_{k+1}^{11}+c_{k+1}A_{k+1}\left({a_{k+1}^{21}+a_{k+1}^{12}}\right)+c_{k+1}^{2}A_{k+1}^{2}a_{k+1}^{22}}\right)E[p_{k}^{2}]}\quad & {\left({a_{k+1}^{12}+a_{k+1}^{22}c_{k+1}A_{k+1}}\right)r_{k}E[p_{k}]}\quad \\[9pt]{\left({a_{k+1}^{21}+a_{k+1}^{22}c_{k+1}A_{k+1}}\right)r_{k}E[p_{k}]}\quad & {r_{k}^{2}a_{k+1}^{22}}\quad \end{array}}\right),\end{array}\end{equation}
 \begin{align} E_{k}\left[{{C}^{\prime}_{k}\Omega_{k+1}D_{k}}\right] & = E_{k}\left[{\left({\begin{array}{l@{\quad}l}{p_{k}}\quad & {c_{k+1}A_{k+1}p_{k}}\quad \\[5pt]0\quad & {r_{k}}\quad \end{array}}\right)\left({\begin{array}{l@{\quad}l}{a_{k+1}^{11}}\quad & {a_{k+1}^{12}}\quad \\[5pt]{a_{k+1}^{21}}\quad & {a_{k+1}^{22}}\quad \end{array}}\right)\left({\begin{array}{l@{\quad}l}{\textrm{0}^{\prime}_{n\times1}}\quad & 0\quad \\[5pt]{{\theta}^{\prime}_{k}}\quad & {-1}\quad \end{array}}\right)}\right]\nonumber\\[10pt]& =\left({\begin{array}{l@{\quad}l}{\left({a_{k+1}^{12}+a_{k+1}^{22}c_{k+1}A_{k+1}}\right)E_{k}[p_{k}{\theta}^{\prime}_{k}]}\quad & {-\left({a_{k+1}^{12}+a_{k+1}^{22}c_{k+1}A_{k+1}}\right)E_{k}[p_{k}]}\quad \\[5pt]{r_{k}a_{k+1}^{22}E_{k}[{\theta}^{\prime}_{k}]}\quad &{-r_{k}a_{k+1}^{22}}\quad \end{array}}\right),\end{align}
 \begin{equation}E_{k}\left[{{D}^{\prime}_{k}\Omega_{k+1}C_{k}}\right]=\left({E_{k}\left[{{C}^{\prime}_{k}\Omega_{k+1}D_{k}}\right]}\right)^{\prime}=\left({\begin{array}{c@{\quad}c}{\left({a_{k+1}^{12}+a_{k+1}^{22}c_{k+1}A_{k+1}}\right)E_{k}[p_{k}\theta_{k}]}\quad & {r_{k}a_{k+1}^{22}E_{k}[\theta_{k}]}\quad \\[5pt]{-\left({a_{k+1}^{12}+a_{k+1}^{22}c_{k+1}A_{k+1}}\right)E_{k}[p_{k}]}\quad & {-r_{k}a_{k+1}^{22}}\quad \end{array}}\right),\end{equation}
 \begin{align}{E_{k}}\left[{{{D^{\prime}}_{k}}{\Omega_{k+1}}{D_{k}}}\right] & ={E_{k}}\left[{\left({\begin{array}{c@{\quad}c}{{\bf {0}}_{n\times1}} & {\theta_{k}}\\[5pt]0 & {-1}\end{array}}\right)\left({\begin{array}{c@{\quad}c}{a_{k+1}^{11}} & {a_{k+1}^{12}}\\[5pt]{a_{k+1}^{21}} & {a_{k+1}^{22}}\end{array}}\right)\left({\begin{array}{c@{\quad}c}{{\bf {0^{\prime}}}_{n\times1}} & 0\\[5pt]{{\theta^{\prime}}_{k}} & {-1}\end{array}}\right)}\right]\nonumber\\[10pt]& =a_{k+1}^{22}\left({\begin{array}{c@{\quad}c}{{E_{k}}[{\theta_{k}}{{\theta^{\prime}}_{k}}]} & {-{E_{k}}[{\theta_{k}}]}\\[5pt]{-{E_{k}}[{{\theta^{\prime}}_{k}}]} & 1\end{array}}\right).\end{align}
These calculation formulas show that the relevant parameters can be calculated by the primary market parameters
 $E_{k}[p_{k}]$
,
 $E[p_{k}^{2}]$
,
 $E_{k}[p_{k}{\theta}^{\prime}_{k}]$
,
 $E_{k}[\theta_{k}]$
and
 $E_{k}[\theta_{k}{\theta}^{\prime}_{k}]$
.
Appendix B. Useful Lemmas
Lemma 1. (Yao et al., Reference Yao, Lai, Ma and Jian2014): Let
 $\varsigma=(\varsigma_{1,}\varsigma_{2,}\cdots,\varsigma_{N})^{\prime}$
be a random vector, then
 $\vert E[\varsigma{\varsigma}^{\prime}]\vert=0$
if only if (iff) there exists a nonzero vector
 $a=(a_{1},a_{2},\cdots,a_{N}{)}^{\prime}$
such that
 ${a}^{\prime}\varsigma=a_{1}\varsigma_{1}+a_{2}\varsigma_{2}+\cdots,a_{N}\varsigma_{N}=0$
hold with probability 1, where
 $\vert H\vert$
denotes the determinant for square matrix H.
Lemma 2.
Let
 $\varsigma=(\varsigma_{1},\;\varsigma_{2},\,\cdots,\varsigma_{N}{)}^{\prime}$
be a random vector. Then
 $\vert Var[\varsigma]\vert=0$
iff there exists a nonzero vector
 $a=(a_{1},a_{2},\cdots,a_{N}{)}^{\prime}$
and a constant g such that
 $\sum\limits _{i=1}^{n}{\alpha_{i}\varsigma_{i}}=g$
with probability 1.
Proof. Since
 $Var[\varsigma]$
is a semidefinite matrix, then
 $\vert Var[\varsigma]\vert=0$
is equivalent to the existence of a nonzero vector a and a constant g such that
 ${a}^{\prime}Var[\varsigma]a={a}^{\prime}E[(\varsigma-E[\varsigma])(\varsigma-E[\varsigma]{)}^{\prime}a=0$
. Let
 $\varsigma_{p}=\sum\limits _{i=1}^{N}{a_{i}\varsigma_{i}}={a}^{\prime}\varsigma$
, then we have
 \begin{equation*}\begin{array}{l}{a}^{\prime}E[(\varsigma-E[\varsigma])(\varsigma-E[\varsigma]{)}^{\prime}a=E[({a}^{\prime}\varsigma-E[{a}^{\prime}\varsigma])({a}^{\prime}\varsigma-E[{a}^{\prime}\varsigma]{)}^{\prime}\\[5pt]=E\left[{(\varsigma_{p}-E[\varsigma_{p}])(\varsigma_{p}-E[\varsigma_{p}]{)}^{\prime}}\right]=Var[\varsigma_{p}]=0.\end{array}\end{equation*}
According to the probability theory, there exists a constant g, such that
 $\varsigma_{p}=\sum\limits _{i=1}^{n}{\alpha_{i}\varsigma_{i}}=g$
with probability 1. This completes the proof.
Let H a symmetrical square matrix and be partitioned as
 $H=\left({\begin{array}{c@{\quad}c}{H_{11}}\quad & {H_{12}}\quad \\{{H}^{\prime}_{12}}\quad & {H_{22}}\quad \end{array}}\right)$
, where
 $H_{11}$
and
 $H_{22}$
are also symmetrical square matrices. Then the following lemmas hold.
Lemma 3 (Kreindler and Jameson, Reference Kreindler and Jameson1972):
 $H>0$
 $\Leftrightarrow$
 $H_{11}>0$
and
 $H_{22}-{H}^{\prime}_{12}H_{11}^{-1}H_{12}>0$
.
Appendix C. Proof of Proposition 1
Proof. We prove the proposition by mathematical induction. When
 $k=T-1$
, we first prove
 $E_{T-1}\left[{{D}^{\prime}_{T-1}MD_{T-1}}\right]>0$
. By (3.4), we have
 \begin{equation*}\begin{array}{l}E_{T-1}\left[{{D}^{\prime}_{T-1}MD_{T-1}}\right]=E_{T-1}\left[{\left({\begin{array}{c@{\quad}c}{\textrm{0}_{n}}\quad & {\theta_{T-1}}\quad \\[5pt]0\quad & {-1}\quad \end{array}}\right)\left({\begin{array}{c@{\quad}c}0\quad & 0\quad \\[5pt]0\quad & {\lambda_{2}}\quad \end{array}}\right)\left({\begin{array}{c@{\quad}c}{\textrm{0}^{\prime}_{n}}\quad & 0\quad \\[5pt]{{\theta}^{\prime}_{T-1}}\quad & {-1}\quad \end{array}}\right)}\right]\\[15pt]=E_{T-1}\left[{\left({\begin{array}{c@{\quad}c}{\textrm{0}_{n}}\quad & {\lambda_{2}\theta_{T-1}}\quad \\[5pt]0\quad & {-\lambda_{2}}\quad \end{array}}\right)\left({\begin{array}{c@{\quad}c}{\textrm{0}^{\prime}_{n}}\quad & 0\quad \\[5pt]{{\theta}^{\prime}_{T-1}}\quad & {-1}\quad \end{array}}\right)}\right]=\lambda_{2}E_{T-1}\left[{\left({\begin{array}{c}{\theta_{T-1}}\quad \\[5pt]{-1}\quad \end{array}}\right)\left({\begin{array}{c@{\quad}c}{{\theta}^{\prime}_{T-1}}\quad & {-1}\quad \end{array}}\right)}\right].\end{array}\end{equation*}
Since
 $M\ge0$
, we have
 $E_{T-1}\left[{{D}^{\prime}_{T-1}MD_{T-1}}\right]\ge0$
. If
 $E_{T-1}\left[{{D}^{\prime}_{T-1}MD_{T-1}}\right]>0$
is not true, it must have
 $\left|{E_{T-1}\left[{{D}^{\prime}_{T-1}MD_{T-1}}\right]}\right|=\lambda_{2}^{2}\left|{E_{T-1}\left[{\left({\begin{array}{c}{\theta_{T-1}}\quad \\{-1}\quad \end{array}}\right)\left({\begin{array}{c@{\quad}c}{{\theta}^{\prime}_{T-1}}\quad & {-1}\quad \end{array}}\right)}\right]}\right|=0$
. Because
 $\lambda_{2}>0$
, it follows that
 $$\left|{E_{T-1}\left[{\left({\begin{array}{c}{\theta_{T-1}}\quad \\{-1}\quad \end{array}}\right)\left({\begin{array}{c@{\quad}c}{{\theta}^{\prime}_{T-1}}\quad & {-1}\quad \end{array}}\right)}\right]}\right|=0.$$
By Lemma 1, there exists a nonzero vector
 $\bar{a}=({a}^{\prime},a_{0}{)}^{\prime}$
, where
 $a=(a_{1},a_{2},\cdots,a_{n}{)}^{\prime}$
such that
 ${a}^{\prime}\theta_{T-1}+a_{0}\times({-}1)=0$
, that is,
 ${a}^{\prime}\theta_{T-1}=a_{0}$
. If a is a nonzero vector, then by Lemma 2, we have
 $\left|{Var[\theta_{T-1}]}\right|=0$
, which contradicts to
 $Var[\theta_{T-1}]=Var[e_{T-1}-r_{T-1}]=Var[e_{T-1}]>0$
by Assumption 1. If a is a zero vector, then we also have
 $a_{0}={a}^{\prime}\theta_{T-1}=0$
, which contradicts to that
 $\bar{a}=(a,a_{0})^{\prime}$
is a nonzero vector. Therefore, we have
 $E_{T-1}\left[{{D}^{\prime}_{T-1}MD_{T-1}}\right]>0$
. Notice that
 $L\ge0$
and
 $\Omega_{T}=M$
, we further have
 $L+E_{T-1}\left[{{D}^{\prime}_{T-1}\Omega_{T}D_{T-1}}\right]=L+E_{T-1}\left[{{D}^{\prime}_{T-1}MD_{T-1}}\right]>0$
.
Let
 $\Upsilon_{T-1}=\left({c_{T}A_{T}p_{T-1},\;r_{T-1},\;\theta_{T-1}}\right)^{\prime}$
. In the following, we first prove that
 $E_{T-1}\left[{\Upsilon_{T-1}{\Upsilon}^{\prime}_{T-1}}\right]>0$
. It is obvious that
 $E_{T-1}\left[{\Upsilon_{T-1}{\Upsilon}^{\prime}_{T-1}}\right]\ge0$
. If
 $\left|{E_{T-1}\left[{\Upsilon_{T-1}{\Upsilon}^{\prime}_{T-1}}\right]}\right|=0$
, according to Lemma 1, there exists a nonzero vector
 $\bar{a}=(m_{1},m_{2},{a}^{\prime}{)}^{\prime}$
, where
 $a=(a_{1},a_{2},\cdots,a_{n}{)}^{\prime}$
, such that
 \begin{equation}m_{1}c_{T}A_{T}p_{T-1}+m_{2}\;r_{T-1}+{a}^{\prime}\theta_{T-1}=m_{1}c_{T}A_{T}p_{T-1}+m_{2}\;r_{T-1}+{a}^{\prime}(e_{T-1}-\textrm{1}r_{T-1})=0,\end{equation}
which gives
 $m_{1}c_{T}A_{T}p_{T-1}+{a}^{\prime}e_{T-1}=\left({{a}^{\prime}\textrm{1}-m_{2}}\right)\;r_{T-1}$
. Notice that
 $c_{T}A_{T}>0$
, if
 $(m_{1},{a}^{\prime}{)}^{\prime}$
is a nonzero vector, which means that
 $(m_{1}c_{T}A_{T},\;{a}^{\prime}{)}^{\prime}$
is also a nonzero vector. Then by Lemma 2, we have
 $\left|{Var[\eta_{T-1}]}\right|=0$
. This contradicts to
 $Var[\eta_{T-1}]>0$
by Assumption 1. If
 $(m_{1},{a}^{\prime}{)}^{\prime}$
is a zero vector, since
 $r_{T-1}>0$
, by (C1), it follows that
 $m_{2}=0$
, which contradicts to that
 $\bar{a}=(m_{1},m_{2},{a}^{\prime}{)}^{\prime}$
is a nonzero vector. Therefore, we must have
 $E_{T-1}\left[{\Upsilon_{T-1}{\Upsilon}^{\prime}_{T-1}}\right]>0$
.
Now, we prove that
 $E_{T-1}\left[{\left({\begin{array}{c@{\quad}c}{{C}^{\prime}_{T-1}MC_{T-1}}\quad & {{C}^{\prime}_{T-1}MD_{T-1}}\quad \\[5pt]{{D}^{\prime}_{T-1}MC_{T-1}}\quad & {L+{D}^{\prime}_{T-1}MD_{T-1}}\quad \end{array}}\right)}\right]>0$
. On one hand, since
 $\lambda_{2}>0$
,
 $M\ge0$
and
 $L\ge0$
, it is obvious that
 \begin{equation}\begin{array}{l}\quad {E_{T-1}}\left[{\left({\begin{array}{c@{\quad}c}{{{C^{\prime}}_{T-1}}M{C_{T-1}}} & {{{C^{\prime}}_{T-1}}M{D_{T-1}}}\\[5pt]{{{D^{\prime}}_{T-1}}M{C_{T-1}}} & {L+{{D^{\prime}}_{T-1}}M{D_{T-1}}}\end{array}}\right)}\right]\\[19pt]={E_{T-1}}\left[{\left({\begin{array}{c}{{C^{\prime}}_{T-1}}\\[5pt]{{D^{\prime}}_{T-1}}\end{array}}\right)M\left({\begin{array}{c@{\quad}c}{C_{T-1}} & {D_{T-1}}\end{array}}\right)+\left({\begin{array}{c@{\quad}c}{{\bf {0}}_{2\times2}} & {{\bf {0}}_{2\times(n+1)}}\\{{\bf {0^{\prime}}}_{2\times(n+1)}} & L\end{array}}\right)}\right]\ge0.\end{array}\end{equation}
On the other hand, notice that
 \begin{equation}\left\{ \begin{array}{l}\left({\begin{array}{c@{\quad}c}{{\bf {0}}_{2\times2}} & {{\bf {0}}_{2\times(n+1)}}\\[5pt]{{\bf {0^{\prime}}}_{2\times(n+1)}} & L\end{array}}\right)=\left({\begin{array}{c@{\quad}c}{{\bf {0}}_{(n+2)\times(n+2)}} & {{\bf {0}}_{(n+2)\times1}}\\[5pt]{{\bf {0^{\prime}}}_{(n+2)\times1}} & 1\end{array}}\right),\;\\[15pt]\left({\begin{array}{c}{{C^{\prime}}_{T-1}}\\[5pt]{{D^{\prime}}_{T-1}}\end{array}}\right)M\left({{C_{T-1}},\;{D_{T-1}}}\right)={\lambda_{2}}\left({\begin{array}{c}{\Upsilon_{T-1}}\\[5pt]{-1}\end{array}}\right)\left({\begin{array}{c@{\quad}c}{{\Upsilon^{\prime}}_{T-1}} & {-1}\end{array}}\right),\end{array}\right.\end{equation}
 \begin{equation*}\begin{array}{l}\quad \left|{{E_{T-1}}\left[{\left({\begin{array}{c@{\quad}c}{{{C^{\prime}}_{T-1}}M{C_{T-1}}} & {{{C^{\prime}}_{T-1}}M{D_{T-1}}}\\[5pt]{{{D^{\prime}}_{T-1}}M{C_{T-1}}} & {\bar{M}+{{D^{\prime}}_{T-1}}M{D_{T-1}}}\end{array}}\right)}\right]}\right|.\\[5pt]\end{array}\end{equation*}
The last inequality come from the fact that
 \begin{equation*}\lambda_{2}^{n+3}\left|{\left({\begin{array}{c@{\quad}c}{E_{T-1}\left[{\Upsilon_{T-1}{\Upsilon}^{\prime}_{T-1}}\right]}\quad & {-E_{T-1}\left[{\Upsilon_{T-1}}\right]}\quad \\[5pt]{-E_{T-1}\left[{{\Upsilon}^{\prime}_{T-1}}\right]}\quad & 1\quad \end{array}}\right)}\right|=\lambda_{2}^{n+3}\left|{E_{T-1}\left[{\left({\begin{array}{c}{\Upsilon_{T-1}}\quad \\[5pt]{-1}\quad \end{array}}\right)\left({\begin{array}{c@{\quad}c}{{\Upsilon}^{\prime}_{T-1}}\quad & {-1}\quad \end{array}}\right)}\right]}\right|\ge0,\end{equation*}
and
 $\lambda_{2}^{n+2}\left|{E_{T-1}\left[{\Upsilon_{T-1}{\Upsilon}^{\prime}_{T-1}}\right]}\right|>0$
as have been proved above. Therefore, we have
 \begin{equation*}E_{T-1}\left[{\left({\begin{array}{c@{\quad}c}{{C}^{\prime}_{T-1}MC_{T-1}}\quad & {{C}^{\prime}_{T-1}MD_{T-1}}\quad \\[5pt]{{D}^{\prime}_{T-1}MC_{T-1}}\quad & {L+{D}^{\prime}_{T-1}MD_{T-1}}\quad \end{array}}\right)}\right]>0.\end{equation*}
By Lemma 3 and notice that
 $\rho>0$
, we further have
 \begin{equation*}\begin{array}{l}{\Omega_{T-1}}=\rho\left({{E_{T-1}}\left[{{{C^{\prime}}_{T-1}}M{C_{T-1}}}\right]}\right.\\[5pt]\left.{\quad \quad -{E_{T-1}}\left[{{{C^{\prime}}_{T-1}}M{D_{T-1}}}\right]{{\left({L+{E_{T-1}}\left[{{{D^{\prime}}_{T-1}}M{D_{T-1}}}\right]}\right)}^{-1}}{E_{T-1}}\left[{{{D^{\prime}}_{T-1}}M{C_{T-1}}}\right]}\right)>0.\end{array}\end{equation*}
In summary, the proposition holds for
 $k=T-1$
.
Now suppose that the proposition is true for
 $k+1$
, that is,
 $\Omega_{k+1}>0$
and
 $L+E_{k+1}\left[{{D}^{\prime}_{k+1}\Omega_{k+2}D_{k+1}}\right]>0$
. We first prove that
 $L+E_{k}\left[{{D}^{\prime}_{k}\Omega_{k+1}D_{k}}\right]>0$
.
Since
 $\Omega_{k+1}$
is a
 $2\times2$
symmetrical matrix, we set
 $\Omega_{k+1}=\left({\begin{array}{c@{\quad}c}{a_{11}}\quad & {a_{12}}\quad \\[5pt]{a_{12}}\quad & {a_{22}}\quad \end{array}}\right)$
, where
 $a_{11}$
,
 $a_{12}$
and
 $a_{22}$
are scalars. Since
 $\Omega_{k+1}>0$
, we have
 $a_{11}>0$
,
 $a_{22}>0$
and
 $a_{11}a_{22}-a_{12}^{2}>0$
. By (3.4), it follows that
 \begin{align*}E_{k}\left[{{D}^{\prime}_{k}\Omega_{k+1}D_{k}}\right] & = E_{k}\left[{\left({\begin{array}{l@{\quad}l}\textrm{0}\quad & {\theta_{k}}\quad \\[5pt]0\quad & {-1}\quad \end{array}}\right)\left({\begin{array}{l@{\quad}l}{a_{11}}\quad & {a_{12}}\quad \\[5pt]{a_{12}}\quad & {a_{22}}\quad \end{array}}\right)\left({\begin{array}{l@{\quad}l}\textrm{0}^{\prime}\quad & 0\quad \\[5pt]{{\theta}^{\prime}_{k}}\quad & {-1}\quad \end{array}}\right)}\right]\\[10pt]& =E_{T-1}\left[{a_{22}\left({\begin{array}{l@{\quad}l}{\theta_{T-1}{\theta}^{\prime}_{T-1}}\quad & {-\theta_{T-1}}\quad \\[5pt]{-{\theta}^{\prime}_{T-1}}\quad & 1\quad \end{array}}\right)\left({\begin{array}{l@{\quad}l}\textrm{0}^{\prime}\quad & 0\quad \\[5pt]{{\theta}^{\prime}_{T-1}}\quad & {-1}\quad \end{array}}\right)}\right]=a_{22}E_{k}\left[{\left({\begin{array}{c}{\theta_{k}}\quad \\[5pt]{-1}\quad \end{array}}\right)\left({\begin{array}{l@{\quad}l}{{\theta}^{\prime}_{k}}\quad & {-1}\quad \end{array}}\right)}\right].\end{align*}
Following the proof of the
 $T-1$
case, we can prove that
 $E_{k}\left[{\left({\begin{array}{c}{\theta_{k}}\quad \\[5pt]{-1}\quad \end{array}}\right)\left({\begin{array}{c@{\quad}c}{{\theta}^{\prime}_{k}}\quad & {-1}\quad \end{array}}\right)}\right]>0$
under Assumption 1. Note that
 $a_{22}>0$
, so we have
 $E_{k}\left[{{D}^{\prime}_{k}\Omega_{k+1}D_{k}}\right]>0$
, which further gives
 \begin{equation*}L+E_{k}\left[{{D}^{\prime}_{k}\Omega_{k+1}D_{k}}\right]>0.\end{equation*}
Let
 $\phi=a_{22}-\frac{a_{12}^{2}}{a_{11}}>0$
, since
 $a_{11}>0$
and
 $a_{11}a_{22}-a_{12}^{2}>0$
, then
 $\phi>0$
. Then
 $\Omega_{k+1}$
can be decomposed into
 $\Omega_{k+1}=J_{1}+J_{2}$
, where
 \begin{equation*}J_{1}=\left({\begin{array}{c@{\quad}c}{a_{11}}\quad & {a_{12}}\quad \\[5pt]{a_{12}}\quad & {\frac{a_{12}^{2}}{a_{11}}}\quad \end{array}}\right)\ge0,\;J_{2}=\left({\begin{array}{c@{\quad}c}0\quad & 0\quad \\[5pt]0\quad & \phi\quad \end{array}}\right)\ge0.\end{equation*}
Let
 $\Upsilon_{k}=\left({c_{k+1}A_{k+1}p_{k},\;r_{k},\;\theta_{k}}\right)^{\prime}$
, also following the
 $T-1$
case, we have
 $E_{k}\left[{\Upsilon_{k}{\Upsilon}^{\prime}_{k}}\right]>0$
and
 $\left|{E_{k}\left[{\Upsilon_{k}{\Upsilon}^{\prime}_{k}}\right]}\right|>0$
. Then, it follows that
 \begin{equation*}\begin{array}{l}\quad \left|{{E_{k}}\left[{\left({\begin{array}{c}{{C^{\prime}}_{k}}\\[5pt]{{D^{\prime}}_{k}}\end{array}}\right){J_{2}}\left({\begin{array}{c@{\quad}c}{C_{k}} & {D_{k}}\end{array}}\right)}\right]+\left({\begin{array}{c@{\quad}c}{{\bf {0}}_{2\times2}} & {{\bf {0}}_{2\times(n+1)}}\\[5pt]{{\bf {0^{\prime}}}_{2\times(n+1)}} & L\end{array}}\right)}\right|\\[25pt]=\left|{\varphi{E_{k}}\left[{\left({\begin{array}{c}{\Upsilon_{k}}\\[5pt]{-1}\end{array}}\right)\left({\begin{array}{c@{\quad}c}{{\Upsilon^{\prime}}_{k}} & {-1}\end{array}}\right)}\right]+\left({\begin{array}{c@{\quad}c}{{\bf {0}}_{(n+2)\times(n+2)}} & {{\bf {0}}_{(n+2)\times1}}\\[5pt]{{\bf {0^{\prime}}}_{(n+2)\times1}} & 1\end{array}}\right)}\right|\\[25pt]=\left|{\left({\begin{array}{c@{\quad}c}{\varphi{E_{k}}\left[{{\Upsilon_{k}}{{\Upsilon^{\prime}}_{k}}}\right]} & {-\varphi{E_{T-1}}\left[{\Upsilon_{k}}\right]}\\[5pt]{-\varphi{E_{k}}\left[{{\Upsilon^{\prime}}_{k}}\right]+{{\bf {0^{\prime}}}_{(n+2)\times1}}} & {\varphi+1}\end{array}}\right)}\right|\\[25pt]=\left|{\left({\begin{array}{c@{\quad}c}{\varphi{E_{k}}\left[{{\Upsilon_{k}}{{\Upsilon^{\prime}}_{k}}}\right]} & {-\varphi{E_{k}}\left[{\Upsilon_{k}}\right]}\\[5pt]{-\varphi{E_{k}}\left[{{\Upsilon^{\prime}}_{k}}\right]} & \varphi\end{array}}\right)}\right|+\left|{\left({\begin{array}{c@{\quad}c}{\varphi{E_{k}}\left[{{\Upsilon_{k}}{{\Upsilon^{\prime}}_{k}}}\right]} & {-\varphi{E_{k}}\left[{\Upsilon_{k}}\right]}\\[5pt]{{\bf {0^{\prime}}}_{(n+2)\times1}} & 1\end{array}}\right)}\right|\\[25pt]={\varphi^{n+3}}\left|{\left({\begin{array}{c@{\quad}c}{{E_{k}}\left[{{\Upsilon_{k}}{{\Upsilon^{\prime}}_{k}}}\right]} & {-{E_{k}}\left[{\Upsilon_{k}}\right]}\\[5pt]{-{E_{k}}\left[{{\Upsilon^{\prime}}_{k}}\right]} & 1\end{array}}\right)}\right|+{\varphi^{n+2}}\left|{{E_{k}}\left[{{\Upsilon_{k}}{{\Upsilon^{\prime}}_{k}}}\right]}\right|>0,\end{array}\end{equation*}
where the last inequality come from the fact that
 \begin{equation*}\left\{ \begin{array}{l}{\varphi^{n+3}}\left|{\left({\begin{array}{c@{\quad}c}{{E_{k}}\left[{{\Upsilon_{k}}{{\Upsilon^{\prime}}_{k}}}\right]} & {-{E_{k}}\left[{\Upsilon_{k}}\right]}\\[5pt]{-{E_{k}}\left[{{\Upsilon^{\prime}}_{k}}\right]} & 1\end{array}}\right)}\right|={\varphi^{n+3}}\left|{{E_{k}}\left[{\left({\begin{array}{c}{\Upsilon_{k}}\\[5pt]{-1}\end{array}}\right)\left({\begin{array}{c@{\quad}c}{{\Upsilon^{\prime}}_{k}} & {-1}\end{array}}\right)}\right]}\right|\ge0,\\[15pt]{\varphi^{n+2}}\left|{{E_{k}}\left[{{\Upsilon_{k}}{{\Upsilon^{\prime}}_{k}}}\right]}\right|>0.\end{array}\right.\end{equation*}
It is obvious that
 $E_{k}\left[{\left({\begin{array}{c}{{C}^{\prime}_{k}}\quad \\[5pt]{{D}^{\prime}_{k}}\quad \end{array}}\right)J_{2}\left({\begin{array}{c@{\quad}c}{C_{k}}\quad & {D_{k}}\quad \end{array}}\right)}\right]+\left({\begin{array}{c@{\quad}c}{\textrm{0}_{2\times2}}\quad & {\textrm{0}_{2\times(n+1)}}\quad \\[5pt]{\textrm{0}^{\prime}_{2\times(n+1)}}\quad & L\quad \end{array}}\right)\ge0.$
Hence, we further have
 \begin{equation*}E_{k}\left[{\left({\begin{array}{c}{{C}^{\prime}_{k}}\quad \\[5pt]{{D}^{\prime}_{k}}\quad \end{array}}\right)J_{2}\left({\begin{array}{c@{\quad}c}{C_{k}}\quad & {D_{k}}\quad \end{array}}\right)}\right]+\left({\begin{array}{c@{\quad}c}{\textrm{0}_{2\times2}}\quad & {\textrm{0}_{2\times(n+1)}}\quad \\[5pt]{\textrm{0}^{\prime}_{2\times(n+1)}}\quad & L\quad \end{array}}\right)>0.\end{equation*}
Notice that
 $J_{1}\ge0$
, which gives
 $E_{k}\left[{\left({\begin{array}{c}{{C}^{\prime}_{k}}\quad \\[5pt]{{D}^{\prime}_{k}}\quad \end{array}}\right)J_{1}\left({\begin{array}{c@{\quad}c}{C_{k}}\quad & {D_{k}}\quad \end{array}}\right)}\right]\ge0$
. Therefore, it follows that
 \begin{equation*}\begin{array}{l}\quad {E_{k}}\left[{\left({\begin{array}{c@{\quad}c}{{{C^{\prime}}_{k}}{\Omega_{k+1}}{C_{k}}} & {{{C^{\prime}}_{k}}{\Omega_{k+1}}{D_{k}}}\\[5pt]{{{D^{\prime}}_{k}}{\Omega_{k+1}}{C_{k}}} & {L+{{D^{\prime}}_{k}}{\Omega_{k+1}}{D_{k}}}\end{array}}\right)}\right]\\[5pt]={E_{k}}\left[{\left({\begin{array}{c}{{C^{\prime}}_{k}}\\[20pt]{{D^{\prime}}_{k}}\end{array}}\right){\Omega_{k+1}}\left({\begin{array}{c@{\quad}c}{C_{k}} & {D_{k}}\end{array}}\right)+\left({\begin{array}{c@{\quad}c}{{\bf {0}}_{2\times2}} & {{\bf {0}}_{2\times(n+1)}}\\[5pt]{{\bf {0^{\prime}}}_{2\times(n+1)}} & L\end{array}}\right)}\right]\\[20pt]={E_{k}}\left[{\left({\begin{array}{c}{{C^{\prime}}_{k}}\\[5pt]{{D^{\prime}}_{k}}\end{array}}\right)({J_{1}}+{J_{2}})\left({\begin{array}{c@{\quad}c}{C_{k}} & {D_{k}}\end{array}}\right)+\left({\begin{array}{c@{\quad}c}{{\bf {0}}_{2\times2}} & {{\bf {0}}_{2\times(n+1)}}\\[5pt]{{\bf {0^{\prime}}}_{2\times(n+1)}} & L\end{array}}\right)}\right]\\[20pt]={E_{k}}\left[{\left({\begin{array}{c}{{C^{\prime}}_{k}}\\[5pt]{{D^{\prime}}_{k}}\end{array}}\right){J_{1}}\left({\begin{array}{c@{\quad}c}{C_{k}} & {D_{k}}\end{array}}\right)}\right]+\left({{E_{k}}\left[{\left({\begin{array}{c}{{C^{\prime}}_{k}}\\[5pt]{{D^{\prime}}_{k}}\end{array}}\right){J_{2}}\left({\begin{array}{c@{\quad}c}{C_{k}} & {D_{k}}\end{array}}\right)}\right]+\left({\begin{array}{c@{\quad}c}{{\bf {0}}_{2\times2}} & {{\bf {0}}_{2\times(n+1)}}\\[5pt]{{\bf {0^{\prime}}}_{2\times(n+1)}} & L\end{array}}\right)}\right)\\[5pt]>0\end{array}\end{equation*}
Notice that
 $\rho>0$
, by Lemma 3, we further have
 \begin{equation*}\Omega_{k}=\rho\left({E_{k}\left[{{C}^{\prime}_{k}\Omega_{k+1}C_{k}}\right]-E_{k}\left[{{C}^{\prime}_{k}\Omega_{k+1}D_{k}}\right]\left({L+E_{k}\left[{{D}^{\prime}_{k}\Omega_{k+1}D_{k}}\right]}\right)^{-1}E_{k}\left[{{D}^{\prime}_{k}\Omega_{k+1}C_{k}}\right]}\right)>0.\end{equation*}
Therefore, the proposition holds for k. By the principle of mathematical induction, this completes the proof.
Appendix D. Proof of Theorem 1
Proof. We also prove this theorem by mathematical induction on k. For
 $k=T-1$
, by the Bellman Equation (3.3), it follows that
 \begin{align} & {\rho^{-1}}{V_{T-1}}(z)\nonumber\\[5pt]& =\mathop{\min}\limits _{{\pi_{k}}}{E_{T-1}}\left[{{{\pi^{\prime}}_{T-1}}L{\pi_{T-1}}+{V_{T}}({C_{T-1}}{z}+{D_{T-1}}{\pi_{T-1}}+{N_{T-1}})}\right]\nonumber\\[5pt]& =\mathop{\min}\limits _{{\pi_{T-1}}}{E_{T-1}}\left[{{{\pi^{\prime}}_{T-1}}L{\pi_{T-1}}+({C_{T-1}}{z}+{D_{T-1}}{\pi_{T-1}}+{N_{T-1}})^{\prime}M({C_{T-1}}{z}+{D_{T-1}}{\pi_{T-1}}+{N_{T-1}})}\right]\nonumber\\[5pt]& ={z^{\prime}}{E_{T-1}}\left[{{{C^{\prime}}_{T-1}}M{C_{T-1}}}\right]{z}+2{{N^{\prime}}_{T-1}}M{E_{T-1}}\left[{C_{T-1}}\right]{z}+{{N^{\prime}}_{T-1}}M{N_{T-1}}\\[5pt]& \quad +\mathop{\min}\limits _{{\pi_{T-1}}}\left\{ {{{\pi^{\prime}}_{T-1}}\left({L+{E_{T-1}}\left[{{{D^{\prime}}_{T-1}}M{D_{T-1}}}\right]}\right){\pi_{T-1}}}\right.\nonumber\\[5pt]& \left.{\quad +2{{\pi^{\prime}}_{T-1}}\left({{E_{T-1}}\left[{{{D^{\prime}}_{T-1}}M{C_{T-1}}}\right]{z}+{E_{T-1}}\left[{{D^{\prime}}_{T-1}}\right]M{N_{T-1}}}\right)}\right\} .\nonumber\end{align}
By Proposition 1,
 $L+E_{T-1}\left[{{D}^{\prime}_{T-1}MD_{T-1}}\right]>0$
. Then, the first-order condition (which is also sufficient) about
 $\pi_{T-1}$
in Equation (D1) yields
 \begin{equation}\pi_{T-1}=-\left({L+E_{T-1}\left[{{D}^{\prime}_{T-1}MD_{T-1}}\right]}\right)^{-1}\left({E_{T-1}\left[{{D}^{\prime}_{T-1}MC_{T-1}}\right]z+E_{T-1}\left[{{D}^{\prime}_{T-1}}\right]MN_{T-1}}\right).\end{equation}
Substituting (D2) into (D1) and simplifying it, we obtain
 \begin{equation*}\begin{array}{l}\quad {\rho^{-1}}{V_{T-1}}(z)\\[5pt]=z^{\prime}{E_{T-1}}\left[{{{C^{\prime}}_{T-1}}M{C_{T-1}}}\right]z+2{{N^{\prime}}_{T-1}}M{E_{T-1}}\left[{C_{T-1}}\right]z+{{N^{\prime}}_{T-1}}M{N_{T-1}}\\[5pt]\quad -\left({z^{\prime}{E_{T-1}}\left[{{{C^{\prime}}_{T-1}}M{D_{T-1}}}\right]+{{N^{\prime}}_{T-1}}M{E_{T-1}}\left[{D_{T-1}}\right]}\right){\left({L+{E_{T-1}}\left[{{{D^{\prime}}_{T-1}}M{D_{T-1}}}\right]}\right)^{-1}}\\[5pt]\quad \times\left({{E_{T-1}}\left[{{{D^{\prime}}_{T-1}}M{C_{T-1}}}\right]z+{E_{T-1}}\left[{{D^{\prime}}_{T-1}}\right]M{N_{T-1}}}\right)\\[5pt]=z^{\prime}{E_{T-1}}\left[{{{C^{\prime}}_{T-1}}M{C_{T-1}}}\right]z+2{{N^{\prime}}_{T-1}}M{E_{T-1}}\left[{C_{T-1}}\right]z+{{N^{\prime}}_{T-1}}M{N_{T-1}}\\[5pt]\quad -z^{\prime}{E_{T-1}}\left[{{{C^{\prime}}_{T-1}}M{D_{T-1}}}\right]{\left({L+{E_{T-1}}\left[{{{D^{\prime}}_{T-1}}M{D_{T-1}}}\right]}\right)^{-1}}{E_{T-1}}\left[{{{D^{\prime}}_{T-1}}M{C_{T-1}}}\right]z\\[5pt]\quad -{{N^{\prime}}_{T-1}}M{E_{T-1}}\left[{D_{T-1}}\right]{\left({L+{E_{T-1}}\left[{{{D^{\prime}}_{T-1}}M{D_{T-1}}}\right]}\right)^{-1}}{E_{T-1}}\left[{{D^{\prime}}_{T-1}}\right]M{N_{T-1}}\\[5pt]\quad -2{{N^{\prime}}_{T-1}}M{E_{T-1}}\left[{D_{T-1}}\right]{\left({L+{E_{T-1}}\left[{{{D^{\prime}}_{T-1}}M{D_{T-1}}}\right]}\right)^{-1}}{E_{T-1}}\left[{{{D^{\prime}}_{T-1}}M{C_{T-1}}}\right]z\\[5pt]=z^{\prime}\left({{E_{T-1}}\left[{{{C^{\prime}}_{T-1}}M{C_{T-1}}}\right]-{E_{T-1}}\left[{{{C^{\prime}}_{T-1}}M{D_{T-1}}}\right]{{\left({L+{E_{T-1}}\left[{{{D^{\prime}}_{T-1}}M{D_{T-1}}}\right]}\right)}^{-1}}{E_{T-1}}\left[{{{D^{\prime}}_{T-1}}M{C_{T-1}}}\right]}\right)z\\[5pt]\quad +2{{N^{\prime}}_{T-1}}M\left({{E_{T-1}}\left[{C_{T-1}}\right]-{E_{T-1}}\left[{D_{T-1}}\right]{{\left({L+{E_{T-1}}\left[{{{D^{\prime}}_{T-1}}M{D_{T-1}}}\right]}\right)}^{-1}}{E_{T-1}}\left[{{{D^{\prime}}_{T-1}}M{C_{T-1}}}\right]}\right)z\\[5pt]\quad +{{N^{\prime}}_{T-1}}M{N_{T-1}}-{{N^{\prime}}_{T-1}}M{E_{T-1}}\left[{D_{T-1}}\right]{\left({L+{E_{T-1}}\left[{{{D^{\prime}}_{T-1}}M{D_{T-1}}}\right]}\right)^{-1}}{E_{T-1}}\left[{{D^{\prime}}_{T-1}}\right]M{N_{T-1}}.\end{array}\end{equation*}
By (3.4) and (3.5), it follows that
 \begin{equation*}\left\{ \begin{array}{l}{\Omega_{T-1}}=\rho\left({{E_{T-1}}\left[{{{C^{\prime}}_{T-1}}M{C_{T-1}}}\right]-{E_{T-1}}\left[{{{C^{\prime}}_{T-1}}M{D_{T-1}}}\right]}\right.\\[5pt]\quad \quad \quad \times\left.{{{\left({L+{E_{T-1}}\left[{{{D^{\prime}}_{T-1}}M{D_{T-1}}}\right]}\right)}^{-1}}{E_{T-1}}\left[{{{D^{\prime}}_{T-1}}M{C_{T-1}}}\right]}\right),\\[5pt]{{G^{\prime}}_{T-1}}=\rho{{N^{\prime}}_{T-1}}M\left({{E_{T-1}}\left[{C_{T-1}}\right]-{E_{T-1}}\left[{D_{T-1}}\right]{{\left({L+{E_{T-1}}\left[{{{D^{\prime}}_{T-1}}M{D_{T-1}}}\right]}\right)}^{-1}}{E_{T-1}}\left[{{{D^{\prime}}_{T-1}}M{C_{T-1}}}\right]}\right),\\[5pt]{F_{T-1}}=\rho\left({{{N^{\prime}}_{T-1}}M{N_{T-1}}-{{N^{\prime}}_{T-1}}M{E_{T-1}}\left[{D_{T-1}}\right]{{\left({L+{E_{T-1}}\left[{{{D^{\prime}}_{T-1}}M{D_{T-1}}}\right]}\right)}^{-1}}{E_{T-1}}\left[{{D^{\prime}}_{T-1}}\right]M{N_{k}}}\right).\end{array}\right.\end{equation*}
Hence, we further have
 $V_{T-1}(z)={z}^{\prime}_{T-1}\Omega_{T-1}z_{T-1}+2{G}^{\prime}_{T-1}z_{T-1}+F_{T-1}.$
Notice that
 $\Omega_{T}=M$
, by (D2), (3.7) holds for
 $k=T-1$
. Therefore, the theorem holds for
 $k=T-1$
.
Now suppose that the theorem is true for
 $k+1$
, namely we have
 \begin{equation*}V_{k+1}(z)={z}^{\prime}\Omega_{k+1}z+2{G}^{\prime}_{k+1}z+F_{k+1}.\end{equation*}
Then according to Bellman Equation (3.3) and by the fact that
 $\Omega_{k+1}$
is a symmetric matrix, it follows that
 \begin{equation}\begin{array}{l}\quad \rho^{-1}V_{k}(z)\\[8pt]=\mathop{\min}\limits _{\pi_{k}}E_{k}\left[{{\pi}^{\prime}_{k}L\pi_{k}+({z}^{\prime}{C}^{\prime}_{k}+{\pi}^{\prime}_{k}{D}^{\prime}_{k}+{N}^{\prime}_{k})\Omega_{k+1}(C_{k}z+D_{k}\pi_{k}+N_{k})+2{G}^{\prime}_{k+1}(C_{k}z+D_{k}\pi_{k}+N_{k})+F_{k+1}}\right]\\[8pt]={z}^{\prime}E_{k}\left[{{C}^{\prime}_{k}\Omega_{k+1}C_{k}}\right]z+{N}^{\prime}_{k}\Omega_{k+1}N_{k}+2{N}^{\prime}_{k}\Omega_{k+1}E_{k}\left[{C_{k}}\right]z+2{G}^{\prime}_{k+1}E_{k}\left[{C_{k}}\right]z+2{G}^{\prime}_{k+1}N_{k}+F_{k+1}\\[8pt]\quad +\mathop{\min}\limits _{\pi_{k}}\left\{ {{\pi}^{\prime}_{k}\left({L+E_{k}\left[{{D}^{\prime}_{k}\Omega_{k+1}D_{k}}\right]}\right)\pi_{k}+2{\pi}^{\prime}_{k}\left({E_{k}\left[{{D}^{\prime}_{k}\Omega_{k+1}C_{k}}\right]z+E_{k}\left[{{D}^{\prime}_{k}}\right]\Omega_{k+1}N_{k}+E_{k}\left[{{D}^{\prime}_{k}}\right]G_{k+1}}\right)}\right\}.\end{array}\end{equation}
By Proposition 1,
 $L+E_{k}\left[{{D}^{\prime}_{k}\Omega_{k+1}D_{k}}\right]>0$
. Then, the first-order condition (which is also sufficient) about
 $\pi_{k}$
in Equation (D3) yields
 \begin{equation}\pi_{k}=-\left({L+E_{k}\left[{{D}^{\prime}_{k}\Omega_{k+1}D_{k}}\right]}\right)^{-1}\left({E_{k}\left[{{D}^{\prime}_{k}\Omega_{k+1}C_{k}}\right]z+E_{k}\left[{{D}^{\prime}_{k}}\right]\Omega_{k+1}N_{k}+E_{k}\left[{{D}^{\prime}_{k}}\right]G_{k+1}}\right).\end{equation}
Substituting (D4) into (D3) and simplifying it, we obtain
 \begin{equation*}\begin{array}{l}\quad \rho^{-1}V_{k}(z)\\[5pt]={z}^{\prime}E_{k}\left[{{C}^{\prime}_{k}\Omega_{k+1}C_{k}}\right]z+{N}^{\prime}_{k}\Omega_{k+1}N_{k}+2{N}^{\prime}_{k}\Omega_{k+1}E_{k}\left[{C_{k}}\right]z+2{G}^{\prime}_{k+1}E_{k}\left[{C_{k}}\right]z+2{G}^{\prime}_{k+1}N_{k}+F_{k+1}\\[5pt]\quad -\left({{z}^{\prime}E_{k}\left[{{C}^{\prime}_{k}\Omega_{k+1}D_{k}}\right]+{N}^{\prime}_{k}\Omega_{k+1}E_{k}\left[{D_{k}}\right]+{G}^{\prime}_{k+1}E_{k}\left[{D_{k}}\right]}\right)\left({L+E_{k}\left[{{D}^{\prime}_{k}\Omega_{k+1}D_{k}}\right]}\right)^{-1}\\[5pt]\quad \times\left({E_{k}\left[{{D}^{\prime}_{k}\Omega_{k+1}C_{k}}\right]z+E_{k}\left[{{D}^{\prime}_{k}}\right]\Omega_{k+1}N_{k}+E_{k}\left[{{D}^{\prime}_{k}}\right]G_{k+1}}\right)\\[5pt]={z}^{\prime}E_{k}\left[{{C}^{\prime}_{k}\Omega_{k+1}C_{k}}\right]z+{N}^{\prime}_{k}\Omega_{k+1}N_{k}+2{N}^{\prime}_{k}\Omega_{k+1}E_{k}\left[{C_{k}}\right]z+2{G}^{\prime}_{k+1}E_{k}\left[{C_{k}}\right]z+2{G}^{\prime}_{k+1}N_{k}+F_{k+1}\\[5pt]\quad -{z}^{\prime}E_{k}\left[{{C}^{\prime}_{k}\Omega_{k+1}D_{k}}\right]\left({L+E_{k}\left[{{D}^{\prime}_{k}\Omega_{k+1}D_{k}}\right]}\right)^{-1}E_{k}\left[{{D}^{\prime}_{k}\Omega_{k+1}C_{k}}\right]z\\[5pt]\quad -{N}^{\prime}_{k}\Omega_{k+1}E_{k}\left[{D_{k}}\right]\left({L+E_{k}\left[{{D}^{\prime}_{k}\Omega_{k+1}D_{k}}\right]}\right)^{-1}E_{k}\left[{{D}^{\prime}_{k}}\right]\Omega_{k+1}N_{k}\\[5pt]\quad -{G}^{\prime}_{k+1}E_{k}\left[{D_{k}}\right]\left({L+E_{k}\left[{{D}^{\prime}_{k}\Omega_{k+1}D_{k}}\right]}\right)^{-1}E_{k}\left[{{D}^{\prime}_{k}}\right]G_{k+1}\\[5pt]\quad -2{N}^{\prime}_{k}\Omega_{k+1}E_{k}\left[{D_{k}}\right]\left({L+E_{k}\left[{{D}^{\prime}_{k}\Omega_{k+1}D_{k}}\right]}\right)^{-1}E_{k}\left[{{D}^{\prime}_{k}\Omega_{k+1}C_{k}}\right]z\\[5pt]\quad -2{G}^{\prime}_{k+1}E_{k}\left[{D_{k}}\right]\left({L+E_{k}\left[{{D}^{\prime}_{k}\Omega_{k+1}D_{k}}\right]}\right)^{-1}E_{k}\left[{{D}^{\prime}_{k}\Omega_{k+1}C_{k}}\right]z\\[5pt]\quad -2{G}^{\prime}_{k+1}E_{k}\left[{D_{k}}\right]\left({L+E_{k}\left[{{D}^{\prime}_{k}\Omega_{k+1}D_{k}}\right]}\right)^{-1}E_{k}\left[{{D}^{\prime}_{k}}\right]\Omega_{k+1}N_{k}\\[5pt]={z}^{\prime}\left({E_{k}\left[{{C}^{\prime}_{k}\Omega_{k+1}C_{k}}\right]-E_{k}\left[{{C}^{\prime}_{k}\Omega_{k+1}D_{k}}\right]\left({L+E_{k}\left[{{D}^{\prime}_{k}\Omega_{k+1}D_{k}}\right]}\right)^{-1}E_{k}\left[{{D}^{\prime}_{k}\Omega_{k+1}C_{k}}\right]}\right)z\\[5pt]\;\;+2\left({{N}^{\prime}_{k}\Omega_{k+1}E_{k}\left[{C_{k}}\right]+{G}^{\prime}_{k+1}E_{k}\left[{C_{k}}\right]-{N}^{\prime}_{k}\Omega_{k+1}E_{k}\left[{D_{k}}\right]\left({L+E_{k}\left[{{D}^{\prime}_{k}\Omega_{k+1}D_{k}}\right]}\right)^{-1}}\right.\\[5pt]\quad \left.{\times E_{k}\left[{{D}^{\prime}_{k}\Omega_{k+1}C_{k}}\right]-{G}^{\prime}_{k+1}E_{k}\left[{D_{k}}\right]\left({L+E_{k}\left[{{D}^{\prime}_{k}\Omega_{k+1}D_{k}}\right]}\right)^{-1}E_{k}\left[{{D}^{\prime}_{k}\Omega_{k+1}C_{k}}\right]}\right)z\\[5pt]\;\;+\left({F_{k+1}+{N}^{\prime}_{k}\Omega_{k+1}N_{k}+2{G}^{\prime}_{k+1}N_{k}-{N}^{\prime}_{k}\Omega_{k+1}E_{k}\left[{D_{k}}\right]\left({L+E_{k}\left[{{D}^{\prime}_{k}\Omega_{k+1}D_{k}}\right]}\right)^{-1}}\right.\\[5pt]\;\;\times E_{k}\left[{{D}^{\prime}_{k}}\right]\Omega_{k+1}N_{k}-{G}^{\prime}_{k+1}E_{k}\left[{D_{k}}\right]\left({L+E_{k}\left[{{D}^{\prime}_{k}\Omega_{k+1}D_{k}}\right]}\right)^{-1}E_{k}\left[{{D}^{\prime}_{k}}\right]G_{k+1}\\[5pt]\;\;\left.{-2{G}^{\prime}_{k+1}E_{k}\left[{D_{k}}\right]\left({L+E_{k}\left[{{D}^{\prime}_{k}\Omega_{k+1}D_{k}}\right]}\right)^{-1}E_{k}\left[{{D}^{\prime}_{k}}\right]\Omega_{k+1}N_{k}}\right).\end{array}\end{equation*}
By (3.4), we further have
 $V_{k}(z)={z}^{\prime}\Omega_{k}z+2{G}^{\prime}_{k}z+F_{k}$
. Therefore, the theorem holds for k.
Therefore, (3.6) and (3.7) holds for
 $k=0,1,\;\cdots,\;T-1$
. By the principle of mathematical induction, we complete the proof.
Appendix E. Proof of Proposition 2
Proof. For
 $k=T$
, then, by boundary condition of Equation (4.6) we have
 $w_{T}=1>0$
, that is, the proposition is true at time T.
Assume
 $w_{k+1}>0$
, it is known from the proof of Proposition 1 that that
 \begin{equation*}\left({\begin{array}{l@{\quad}l}{E_{k}[\theta_{k}{\theta}^{\prime}_{k}]}\quad & {-E_{k}[\theta_{k}]}\quad \\[5pt]{-E_{k}[{\theta}^{\prime}_{k}]}\quad & 1\quad \end{array}}\right)=E_{k}\left[{\left({\begin{array}{c}{\theta_{k}}\quad \\[5pt]{-1}\quad \end{array}}\right)\left({\begin{array}{l@{\quad}l}{{\theta}^{\prime}_{k}}\quad & {-1}\quad \end{array}}\right)}\right]>0\end{equation*}
under Assumption 1. Then by Lemma 3, we have
 \begin{equation*}1-({-}E_{k}[{\theta}^{\prime}_{k}])E_{k}^{-1}[\theta_{k}{\theta}^{\prime}_{k}]({-}E_{k}[\theta_{k}])=1-E_{k}[{\theta}^{\prime}_{k}]E_{k}^{-1}[\theta_{k}{\theta}^{\prime}_{k}]E_{k}[\theta_{k}]>0.\end{equation*}
Notice that
 $r_{k}>0$
, then according to (4.6), we have
 $w_{k}=w_{k+1}r_{k}^{2}\left({1-E_{k}[{\theta}^{\prime}_{k}]E_{k}^{-1}[\theta_{k}{\theta}^{\prime}_{k}]E_{k}[\theta_{k}]}\right)>0$
.
By the principle of mathematical induction, the proposition is proved.
Appendix F. Proof of Theorem 3
Proof. We first prove (4.7) by mathematical induction on k. For
 $k=T$
, by the boundary conditions of (4.6), we have
 $w_{T}\bar{\alpha}^{2}+\phi_{T}\bar{y}\bar{\alpha}+\psi_{T}\bar{y}^{2}=\bar{\alpha}^{2}$
. On the other hand, it is known from the boundary condition of Bellman Equation (4.5) that
 $\bar{V}_{T}(\bar{y},\bar{\alpha})=\bar{\alpha}^{2}$
. Therefore, (4.7) holds for
 $k=T$
.
Now suppose that (4.7) is true for
 $k+1$
, namely we have
 \begin{equation*}\bar{V}_{k+1}(\bar{y},\bar{\alpha})=w_{k+1}\bar{\alpha}^{2}+\phi_{k+1}\bar{y}\bar{\alpha}+\psi_{k+1}\bar{y}^{2}.\end{equation*}
Then according to Bellman Equation (4.5), it follows that
 \begin{align} & \quad {{\bar{V}}_{k}}(y,\alpha)\nonumber\\[5pt]& =\mathop{\min}\limits _{{u_{k}}}{E_{k}}\left[{{w_{k+1}}{{(\bar{\alpha}{r_{k}}+{{\theta^{\prime}}_{k}}{u_{k}}+{{\bar{c}}_{k+1}}{{\bar{p}}_{k}}\bar{y})}^{2}}+{\varphi_{k+1}}{{\bar{p}}_{k}}\bar{y}(\bar{\alpha}{r_{k}}+{{\theta^{\prime}}_{k}}{u_{k}}+{{\bar{c}}_{k+1}}{{\bar{p}}_{k}}\bar{y})+{\psi_{k+1}}{{({{\bar{p}}_{k}}\bar{y})}^{2}}}\right]\nonumber\\[5pt]& =\mathop{\min}\limits _{{u_{k}}}\left\{ {{w_{k+1}}{{\bar{\alpha}}^{2}}r_{k}^{2}+{w_{k+1}}{{u^{\prime}}_{k}}{E_{k}}[{\theta_{k}}{{\theta^{\prime}}_{k}}]{u_{k}}+{w_{k+1}}\bar{c}_{k+1}^{2}{E_{k}}[\bar{p}_{k}^{2}]{{\bar{y}}^{2}}+2{w_{k+1}}\bar{\alpha}{r_{k}}{E_{k}}[{{\theta^{\prime}}_{k}}]{u_{k}}}\right.\nonumber\\[5pt]& \quad +2{w_{k+1}}\bar{\alpha}{r_{k}}{{\bar{c}}_{k+1}}{E_{k}}[{{\bar{p}}_{k}}]\bar{y}+2{w_{k+1}}{{\bar{c}}_{k+1}}{E_{k}}[{{\bar{p}}_{k}}{{\theta^{\prime}}_{k}}]{u_{k}}\bar{y}+{\varphi_{k+1}}{E_{k}}[{{\bar{p}}_{k}}]\bar{y}\alpha{r_{k}}\\[5pt]& \quad \left.{+{\varphi_{k+1}}\bar{y}{E_{k}}[{{\bar{p}}_{k}}{{\theta^{\prime}}_{k}}]{u_{k}}+\left({{\varphi_{k+1}}{{\bar{c}}_{k+1}}+{\psi_{k+1}}}\right){E_{k}}[\bar{p}_{k}^{2}]{{\bar{y}}^{2}}}\right\} \nonumber\\[5pt]& ={w_{k+1}}r_{k}^{2}{{\bar{\alpha}}^{2}}+{w_{k+1}}\bar{c}_{k+1}^{2}{E_{k}}[\bar{p}_{k}^{2}]{{\bar{y}}^{2}}+\left({2{w_{k+1}}{{\bar{c}}_{k+1}}+{\varphi_{k+1}}}\right){E_{k}}[{{\bar{p}}_{k}}]{r_{k}}\bar{\alpha}\bar{y}+\left({{\varphi_{k+1}}{{\bar{c}}_{k+1}}+{\psi_{k+1}}}\right){E_{k}}[\bar{p}_{k}^{2}]{{\bar{y}}^{2}}\nonumber\\[5pt]& \quad +\mathop{\min}\limits _{{u_{k}}}\left\{ {{{u^{\prime}}_{k}}{w_{k+1}}{E_{k}}[{\theta_{k}}{{\theta^{\prime}}_{k}}]{u_{k}}+\left({2{w_{k+1}}\bar{\alpha}{r_{k}}{E_{k}}[{{\theta^{\prime}}_{k}}]+\left({2{w_{k+1}}{{\bar{c}}_{k+1}}+{\varphi_{k+1}}}\right)\bar{y}{E_{k}}[{{\bar{p}}_{k}}{{\theta^{\prime}}_{k}}]}\right){u_{k}}}\right\} .\nonumber\end{align}
By Assumption 1 and Proposition 2, we have
 $E_{k}[\theta_{k}{\theta}^{\prime}_{k}]>0$
and
 $w_{k+1}>0$
, which implies
 $w_{k+1}E_{k}[\theta_{k}{\theta}^{\prime}_{k}]>0$
. Then, the first-order condition (which is also sufficient) about
 $u_{k}$
in (F1) yields
 \begin{equation}u_{k}^{\ast}=-E_{k}^{-1}[\theta_{k}{\theta}^{\prime}_{k}]\left({r_{k}E_{k}[\theta_{k}]\bar{\alpha}+\frac{2w_{k+1}\bar{c}_{k+1}+\phi_{k+1}}{2w_{k+1}}E_{k}[\bar{p}_{k}\theta_{k}]\bar{y}}\right).\end{equation}
Substituting (F2) into (F1) and simplifying it, we obtain
 \begin{equation*}\begin{array}{l}\quad \bar{V}_{k}(y,\alpha)\\[9pt]=w_{k+1}r_{k}^{2}\bar{\alpha}^{2}+w_{k+1}\bar{c}_{k+1}^{2}E_{k}[\bar{p}_{k}^{2}]\bar{y}^{2}+\left({2w_{k+1}\bar{c}_{k+1}+\phi_{k+1}}\right)E_{k}[\bar{p}_{k}]r_{k}\bar{\alpha}\bar{y}\\[9pt]\quad +\left({\phi_{k+1}\bar{c}_{k+1}+\psi_{k+1}}\right)E_{k}[\bar{p}_{k}^{2}]\bar{y}^{2}-\dfrac{1}{2}\left({2w_{k+1}\bar{\alpha}r_{k}E_{k}[{\theta}^{\prime}_{k}]+\left({2w_{k+1}\bar{c}_{k+1}+\phi_{k+1}}\right)\bar{y}E_{k}[\bar{p}_{k}{\theta}^{\prime}_{k}]}\right)\\[9pt]\quad \times E_{k}^{-1}[\theta_{k}{\theta}^{\prime}_{k}]\left({r_{k}E_{k}[\theta_{k}]\bar{\alpha}+\dfrac{2w_{k+1}\bar{c}_{k+1}+\phi_{k+1}}{2w_{k+1}}E_{k}[\bar{p}_{k}\theta_{k}]\bar{y}}\right)\\[9pt]=w_{k+1}r_{k}^{2}\bar{\alpha}^{2}\left({1-E_{k}[{\theta}^{\prime}_{k}]E_{k}^{-1}[\theta_{k}{\theta}^{\prime}_{k}]E_{k}[\theta_{k}]}\right)+\left({2w_{k+1}\bar{c}_{k+1}+\phi_{k+1}}\right)\left({E_{k}[\bar{p}_{k}]-E_{k}[{\theta}^{\prime}_{k}]E_{k}^{-1}[\theta_{k}{\theta}^{\prime}_{k}]E_{k}[\bar{p}_{k}\theta_{k}]}\right)r_{k}\bar{\alpha}\bar{y}\\[9pt]\quad +\left({\left({w_{k+1}\bar{c}_{k+1}^{2}+\phi_{k+1}\bar{c}_{k+1}+\psi_{k+1}}\right)E_{k}[\bar{p}_{k}^{2}]}\right.\left.{-\dfrac{\left({2w_{k+1}\bar{c}_{k+1}+\phi_{k+1}}\right)^{2}}{4w_{k+1}}E_{k}[\bar{p}_{k}{\theta}^{\prime}_{k}]E_{k}^{-1}[\theta_{k}{\theta}^{\prime}_{k}]E_{k}[\bar{p}_{k}\theta_{k}]}\right)\bar{y}^{2}.\end{array}\end{equation*}
By (4.6), we further have
 $\bar{V}_{k}(\bar{y},\bar{\alpha})=w_{k}\bar{\alpha}^{2}+\phi_{k}\bar{y}\bar{\alpha}+\psi_{k}\bar{y}^{2}$
. Therefore, (4.7) holds for k. By applying mathematical induction, (4.7) holds for
 $k=0,1,\;\cdots,\;T$
. By the proof of (4.7) above (see (F2)), the optimal strategy follows for
 $k=0,1,\;\cdots,\;T-1$
. This completes the proof.
Appendix G. A Brief Introduction of Vector Autoregressive Structure Estimation
To obtain the conditional expectations and conditional covariance matrices, we consider a vector autoregressive structure of the underlying dynamic process that
 \begin{equation*}\tilde{\eta}_k=b_0+B\tilde{\eta}_{k-1}+\epsilon_k \mbox{ where } \epsilon_k\sim N(0,\Sigma)\end{equation*}
with
 $\tilde{\eta}_k=[e_k,\log(p_k)]$
and the autoregressive coefficients
 $b_0\in \mathbb{R}^5, B\in \mathbb{R}^{5\times 5}$
. We rewrite this in its matrix form as:
 \begin{equation*}\boldsymbol{Y}=\boldsymbol{X}\beta+\boldsymbol{\epsilon}\end{equation*}
where
 $\boldsymbol{Y}=[\tilde{\eta}_2,.....,\tilde{\eta}_T]^{\prime}$
,
 $\boldsymbol{X}=[[1,\tilde{\eta}_2^{\prime}]^{\prime},...,[1,\tilde{\eta}_{T-1}^{\prime}]^{\prime}]^{\prime}$
,
 $\beta=[b_0,B]^{\prime}$
and
 $\boldsymbol{\epsilon}=[\epsilon_2,.....,\epsilon_T]^{\prime}$
. The model is highly parameterized; the standard approach is to use the Bayesian method for parameter estimation. The model parameters in this case are
 $\beta=vec([b_0,B])$
and
 $\Sigma$
. We consider the following independent prior that
 \begin{equation*}\beta \sim N(\mu_0, \Sigma_0) \mbox{ and } \Sigma\sim IW(\nu_0,S_0).\end{equation*}
As the posterior distribution in this case is unknown analytically, we employ the Bayesian Gibbs sampler to obtain the posterior coefficients as well as the in-sample forecasts used in this paper. Here, we set
 $\mu_0$
as a zero vector,
 $\Sigma_0$
as an identity matrix,
 $\nu_0=10$
and
 $S_0=0.01\mathbb{I}_5$
.