Milk quality is primarily described by somatic cell count and by protein and fat content (Swaisgood, Reference Swaisgood and Fennema1996), which determine the milk nutritional values and its suitability for manufacturing processes such as cheese production (O'Farrell et al. Reference O'Farrell, Sheehan, Wilkinson, Harrington and Kelly2002; Chevanan & Muthukumarappan, Reference Chevanan and Muthukumarappan2007; Hallab et al. Reference Hallab, Kohen, Grandison, Lewis and Grandison2007). There is strong motivation to develop real-time tools for estimating these parameters during the milking process, as such information could be used at several levels. First, it could be used for automatic tracking of the composition of the milk produced by each cow, which could be used for detecting sudden unexpected changes in the animal's milk and thus serve as a warning system for disease or stress. Second, since farmers' payments are directly related to the milk composition and most markets are quota-regulated, real-time determination of milk composition would help with more efficient farm management (Reinemann & Helgren, Reference Reinemann and Helgren2004). For instance, it would enable storing milk in different tanks according to its composition.
Milk production is tightly regulated, and in order to be marketable milk must not be altered in any way. From a quality-monitoring point of view, this precludes any technique that would require the addition of reagents, heating, homogenisation, fractionization, or any other disturbing manipulation. Such constraints greatly limit the type of monitoring methods that could potentially be used in-line. Spectroscopy, being rapid and non-invasive, meets these requirements, and its use for milk analysis has been investigated in several studies. In particular, Schmilovitch et al. (Reference Schmilovitch, Notea and Maltz2000) and Woo et al. (Reference Woo, Terazawa, Chen, Iyo, Terada and Kawano2002) showed that near-infrared (NIR) spectroscopy could be used to estimate milk's fat content accurately (standard errors of prediction (SEP) 7 g/kg and 0·06% (w/v) respectively), and NIR-based systems for in-line estimation of fat content are commercially available. Woo et al. (Reference Woo, Terazawa, Chen, Iyo, Terada and Kawano2002) also provided accurate estimates of protein and lactose content (0·10% SEP). However extracting information from NIR spectra of raw milk is restricted to analysing overtones of molecular vibrations and suffers from large baseline variations resulting from light scattering, mainly by fat globules. By comparison, mid-infrared spectra (2·5–25 μm or 400–4000 cm−1) express fundamental modes of molecular vibrations (e.g. Stuart, Reference Stuart1997) and thus contain information that is much more compound-specific. Numerous comparative studies related to the analysis of a wide variety of materials and in particular food products have shown the superiority of the mid-infrared over near-infrared range. With respect to milk analysis, mid-infrared spectrometers are routinely used in laboratories that provide quality-control services to farmers. Such laboratory analyses are conducted using transmittance cells with a very short optic path (a few microns) to minimise the very strong absorbance of water (e.g. Hewavitharana & van Brakel, Reference Hewavitharana and van Brakel1997; Dousseau et al. Reference Dousseau, Therrien and Pezolet1989). Such transmittance cells are prone to blocking and are not suitable for in-situ measurements. An alternative approach consists of measuring the sample reflectance, using either the diffuse reflectance (DRIFT) or the attenuated total reflectance (ATR) methods. DRIFT is based on reflections in random directions and its main drawback is that it is very sensitive to particle size and shape. By comparison, ATR spectroscopy relies on a crystal in which the radiation propagates and the measured spectrum is that of a very thin layer that forms at the interface between the ATR crystal and the sample (0·25–5 μm for water solutions, depending on the crystal type, the incidence angle and the radiation wave-number). Although ATR spectroscopy can be used with virtually any liquid sample, the limited penetration depth of the radiation into the sample may be a major limitation for samples that are not homogeneous at the micron scale. For non-homogenised milk, the size of fat globules ranges from 0·1 to 15 μm (more than the radiation penetration depth), so that these globule may ‘hide’ the much smaller protein molecules. In our previous paper (Etzion et al. Reference Etzion, Linker, Cogan and Shmulevich2004) we showed that ATR spectroscopy could be used to determine protein concentration in milk standards prepared from un-homogenised milk fractions, and showed promising results for raw milk samples. The objectives of the present study were to extend our previous work (Etzion et al. Reference Etzion, Linker, Cogan and Shmulevich2004), whose raw milk results were based only on ten cows, and to determine whether mid-infrared ATR spectroscopy could be used for in-line estimation of protein and fat content in non-homogenized milk.
Materials and Methods
Milk sampling and spectral measurements
Milk samples were obtained from Kfar Galim farm (Northern Israel) during three time periods: Summer 2005, 122 samples from 56 cows; Winter 2005, 33 samples from 25 cows; Summer 2006, 34 samples from 26 cows. The samples were obtained from a by-pass of the milking line during the automated milking process. For each cow, a set of three 40 ml bottles was collected, a stabiliser tablet 2-bromo-2 nitropropane-1,3-diol and Natamicin was immediately put in each bottle, and the samples were stored at 4°C. One bottle from each set was randomly selected for reference analysis at the Central Laboratory for Milk Analysis (Park Caesarea).
The spectroscopic measurements took place within one week of milking itself. The samples were slowly heated up to 39°C and were maintained at this temperature during the entire measurement using a water-bath and continuous magnetic stirring, which ensured conditions similar to that of a milking line (liquefied fat and milk flowing around the sensor). The measurements were conducted with a VECTOR 22 FTIR spectrophotometer (Bruker Inc.) equipped with a mercury cadmium telluride (MCT) detector and an immersed ZnSe ATR crystal (Axiom Inc.). This device was preferred over the standard horizontal ATR crystal used in our previous work (Etzion et al. Reference Etzion, Linker, Cogan and Shmulevich2004) since this immersed crystal could be easily inserted into a milking line. In order to minimise the interference due to water vapour, dry air was constantly circulated though the spectrophotometer and the ATR assembly, maintaining the relative humidity below 10%. Each measurement involved 32 background scans (air) and 32 scans of the samples, with a 2 cm−1 resolution. The sample interferogram was transformed into an ATR spectrum using the Norton Bear weak apodization method and the Mertz phase-correction method.
Each sample was analysed three times. Between measurements, the ATR dipper was cleaned using warm distilled water (45°C) and a 5% ES-7X cleaning solution (ICN Biomedicals, Inc.), followed by rinsing with acetone and water and thorough drying.
Mathematical analysis
Due to the high dimensionality of mid-infrared spectra, quantitative analysis of such spectra typically involves two stages: data reduction and regression between the reduced-dimension data and the concentrations of interest. In the present study, two methods were investigated for data reduction, namely principal component analysis and wavelet decomposition. In both cases a sigmoid feedforward neural network (Haykin, Reference Haykin1999) was used for the regression stage.
Data reduction
Principal component analysis (PCA), which is commonly used in spectroscopic studies, performs a linear decomposition of the spectra and yields a small number of principal components and the associated coefficients, so-called PCA scores (Hastie et al. Reference Hastie, Tibshirani and Friedman2001). A convenient of feature of PCA decomposition is that the principal components are ordered according to decreasing contribution (i. e. most of the information is contained in the first principal components), and data reduction is achieved in a straightforward manner by retaining only the N first components.
Wavelet decomposition is very efficient for decomposing or compressing infrared spectra (Walczak & Massart, Reference Walczak and Massart1997; Trygg & Wold, Reference Trygg and Wold1998; Ehrentreich, Reference Ehrentreich2002; Liu & Brown, Reference Liu and Brown2004; Figueiredo dos Santos et al. Reference Figueiredo dos Santos, Galvao, Araujo and Cirino da Silva2007). The main feature of wavelet decomposition is that the resulting coefficients contain information about both the location and shape (sharpness) of the spectral bands. With respect to chemometrics, various types of wavelets have been investigated, and details relative to each method can be found in the literature (Walczak & Massart, Reference Walczak and Massart1997; Leung et al. Reference Leung, Chau, Gao and Shih1998; Jahn et al. Reference Jahn, Linker, Upadhyaya, Shaviv, Slaughter and Shmulevich2006; Figueiredo dos Santos et al. Reference Figueiredo dos Santos, Galvao, Araujo and Cirino da Silva2007). In the present study, discrete wavelet decomposition was performed to level ten with a coiflet3 mother-wavelet. Data reduction was achieved by retaining only the coefficients with the highest variance (Linker, Reference Linker2007; Trygg & Wold, Reference Trygg and Wold1998) and using them as inputs to the neural network.
Separate sets of models were developed for protein and fat, so that the size and architecture of each model could be optimized and the analysis could be restricted to the spectral intervals most relevant to the property of interest. For protein, the following intervals were included in the analysis based on our previous study (Etzion et al. Reference Etzion, Linker, Cogan and Shmulevich2004): the Amide II (1480–1600 cm−1) and Amide III (1200–1280 cm−1) bands; the O=P−O stretching band (1060–1100 cm−1), which is characteristic of casein phospho-seryl groups; and the 2500–2700 cm−1 interval, where O-H stretching in carboxylic acids occurs. Determination of fat concentration was attempted using three spectral intervals that correspond to bending and stretching vibrations of C-H bonds and C=O stretching in the ester groups in glycerides (900–1800 cm−1, 1200–1400 cm−1 and 2700–3000 cm−1) (Coates, Reference Coates and Meyers2000).
Neural network models
Feedforward neural networks (NN) with sigmoid activation functions were used as non-linear regression models (Haykin, Reference Haykin1999). In order to determine the degree to which interactions between protein and fat affected protein determination, two types of protein NN models were tested: models based on spectral information only (PCA scores or wavelet coefficients) (Chalus et al. Reference Chalus, Walter and Ulmschneider2007), and models that included fat concentration as additional input (Etzion et al. Reference Etzion, Linker, Cogan and Shmulevich2004). The number of PCA scores or wavelet coefficients used as inputs was varied from two to six and 10 to 25, respectively, and the number of nodes in the NN hidden layer was varied between two and six. Only the results of the models with the lowest validation errors are reported below.
Separate models were calibrated and validated for each season, and models were also calibrated and validated using all the data. In each case, the models were calibrated using two-third of the samples (selected randomly), and the remaining samples were used as validation set. As mentioned above, three spectra were obtained for each sample, and these were considered individually both at the calibration and validation stage, so that it was possible to estimate the standard deviation of the prediction of each sample. The root mean square (RMS) of the determination errors was used to estimate the models' performance:
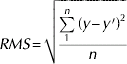
where y and y′ denote the mean predictions and the actual values, and n is the number of samples.
Results
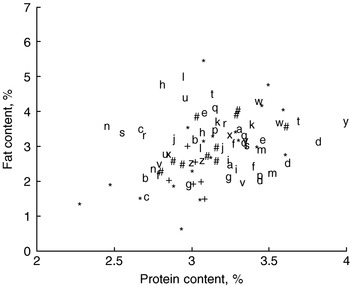
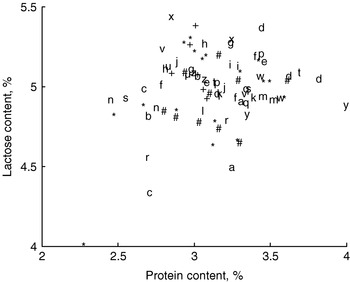
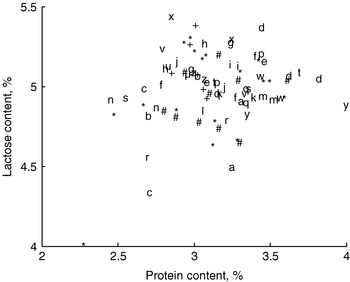
The results of the reference analysis are presented graphically in Figs 1 & 2. In order to show temporal variations, cows that were sampled during more than one season are identified by letters, while animals that were sampled only during one season are indicated by symbols. It can be seen that for some animals the temporal variations were large (for instance, Cow t (~0·5% protein), Cow l (~2% fat), Cow c (~2% fat and 0·7% lactose)). It can also be seen that there were only very weak correlations between the different constituents, which is mandatory for the type of quantitative analysis performed in this work.
Protein and fat contents of the samples. The cows that that were sampled more than once are indicated by letters. The cows that were sampled only once are indicated by * - Summer 2005; # - Winter 2005; +- Summer 2006. Correlation coefficient R2=0·33.

Protein and lactose contents of the samples. Symbols as in Fig 1. Correlation coefficient R2=0·10.
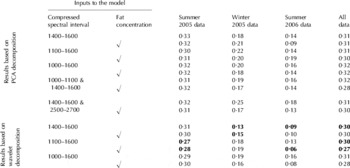
ATR determination of protein
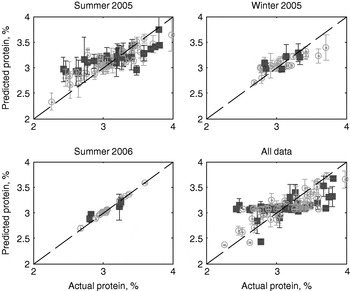
The RMS errors for protein determination are summarised in Table 1 (validation sets only), in which results of the best model for each dataset are indicated in bold. It must be noted that non-connected intervals could be concatenated and used for analysis only when using PCA decomposition (fourth and fifth models). The determination errors vary between approximately 0·1–0·3% protein, and the lowest determination errors are consistently obtained using wavelet decomposition rather than PCA. In most cases, including the fat concentration in the input reduces the determination error, which agrees with the results reported in our previous work (Etzion et al. Reference Etzion, Linker, Cogan and Shmulevich2004) and indicates that either fat globules or fat biofilms introduce variations at the protein–ATR interface and thus alter the ATR signal of the protein. The much lower determination errors obtained for the Summer 2006 dataset can be explained both by the smaller size of the dataset and by the smaller range of protein concentrations (Fig 3).
Actual vs. predicted protein concentration. For each dataset the predictions are those of the best model (Table 1). The ‘o’ and ‘■’ symbols correspond to calibration and validation data, respectively. The error bars indicates the prediction standard deviation (based on three spectra).

Protein determination errors (root mean square (RMS) of the validation data only)

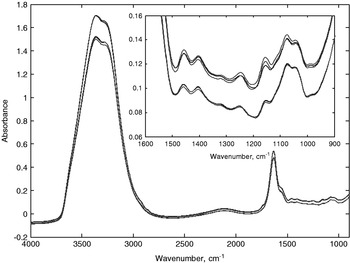
The results of the best model for each dataset are also presented graphically in Fig 3, which for each sample shows the average prediction and its standard deviation (based on the three repeated measurements). The standard deviation ranges from 0·05% protein (Summer 2006) to 0·14% protein (Summer 2005), which indicates that the repeatability of the measurements is satisfactory. This can be confirmed by visual inspections of typical spectra, as shown in Fig 4.
Typical spectra of two samples. The spectra of the second sample were shifted vertically for clarity. The insert shows a zoom of the ‘fingerprint’ region that is most relevant to protein determination.

ATR determination of fat
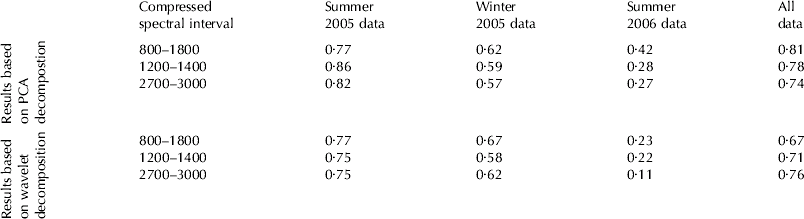
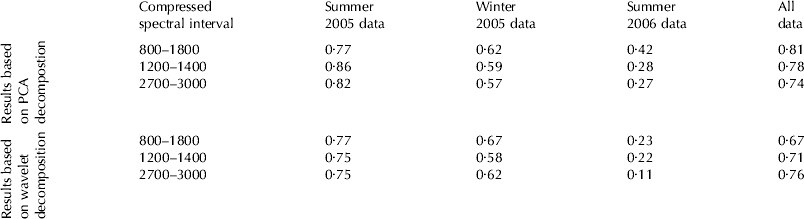
The RMS errors for fat predictions are summarised in Table 2 (validation sets only). The prediction errors range from 0·1–0·8% fat, which is far from acceptable. Overall, these results are not surprising since the size of the fat globules (diameter: 0·1–15 μm) exceeds the expected penetration depths of the mid-IR radiation for a ZnSe crystal such as the one used for this study (0·4–1·5 μm for the 1000–4000 cm−1 spectral range and an incidence angle of 45°). Complimentary measurements that were conducted with a variable-angle ATR element (Pike Technologies) equipped with a Germanium crystal showed no significant and consistent differences between the spectra recorded at 30°, 45°, and 60° incidence angles (details not reported). With respect to protein determination, these results demonstrate that the approach suggested by us (Etzion et al. Reference Etzion, Linker, Cogan and Shmulevich2004) to replace the fat concentration (non spectral) input by spectral information obtained by attenuated total reflectance (for instance the 2700–3000 cm−1 region) is in fact not feasible.
Fat determination errors (root mean square (RMS) of the validation data only)
Discussion
Contrary to our previous work (Etzion et al. Reference Etzion, Linker, Cogan and Shmulevich2004) in which we reported encouraging results for FTIR-ATR determination of protein in un-homogenised milk (with typical errors of 0·12% protein), the present study showed that FTIR-ATR spectroscopy in the mid-infrared range would not be suitable for accurate in-line monitoring of raw milk. The contradictory conclusions of these two studies can be explained by the much larger dataset used in the present study, which included over 70 cows and spanned 18 months. Although satisfying results were obtained for two relatively small datasets, the much poorer results obtained for the larger datasets cast serious doubts concerning robustness of the method. Based on these results, it is very unlikely that predictive models accurate and robust enough for practical applications could be developed.
The inadequacy of mid-IR ATR spectroscopy for in-line raw milk analysis can be explained most likely by the limited penetration depth of the radiation that causes the spectra to be very sensitive to the presence of fat globules or fat biofilms at the milk-ATR interface. Milk manipulations such as homogenisation can improve the measurement accuracy significantly (e.g. Hewavitharana & van Brakel, Reference Hewavitharana and van Brakel1997; Iñón et al. Reference Iñón, Garrigues and de la Guardia2004), but such preprocessing is permissible only for by-pass (or off-line) sampling and analysis.
This study was supported by the Israeli Cattle Breeders Association (Grant 702937).