Introduction
Cadmium telluride (CdTe) is a leading mature photovoltaic (PV) technology with a market share of around 5%. The efficiency of CdTe solar cells depends on intrinsic defects in bulk materials and at the front and back interfaces. At the front interface, cadmium sulfide (CdS), band gap 2.42 eV, is the most conventionally used material as a window layer to fabricate CdTe solar cells. CdS absorbs photons of wavelength <512 nm but does not contribute to the current density of the device due to high defect density and the formation of photo-inactive CdS1−yTey alloy [Reference Duffy, Peter and Wang1]. Recently, other materials including CdSe and magnesium zinc oxide (MgZnO, band gap 3.3 eV) have also been applied as window layers to increase current density by collecting blue photons [Reference Munshi, Kephart, Abbas, Raguse, Beaudry, Barth, Sites, Walls and Sampath2, Reference Paudel and Yan3]. Compared with the front contact interface, the rear interface is challenging due to the deep valence band edge of CdTe (≃5.9 eV) and formation of Schottky junction with a metal at the back interface [Reference Freeouf and Woodall4, Reference Simonds, Palekis, Van Devener, Ferekides and Scarpulla5, Reference Liyanage, Phillips, Alfadhili, Ellingson and Heben6].
The barrier height at the Schottky junction between CdTe and a metal, usually nickel (Ni) or gold (Au), limits the hole transport and increases the contact resistance, limiting the maximum photovoltage expected [Reference Kumar and Rao7]. Doping the CdTe absorbing layer, which increases the carrier concentration, localizes band bending and lowers the barrier height. Copper/gold (Cu/Au) has been used as a rear contact material in our laboratory [Reference Janik and Triboulet8, Reference Corwine, Pudov, Gloeckler, Demtsu and Sites9]. Deposition and diffusion of Cu atoms increase carrier concentration and enhance device performance. However, the Cu/Au back contact does not facilitate the transport of the photo-generated charge carriers due to a potential barrier between CdTe and Au. Based on the previous report, the barrier height in between CdTe and Cu/Au when CdTe (3.5 μm) is doped with 3 nm Cu is ∼0.33 eV [Reference Bhandari, Tan, Zereshki, Alfadhili, Phillips, Koirala, Heben, Collins and Ellingson10]. To further reduce the potential barrier, a material with suitable band edges is applied for the extraction of holes and repel of electrons at the rear contact of CdTe PVs. Materials such as carbon nanotubes [Reference Phillips, Khanal, Song, Zartman, DeWitt, Stone, Roland, Plotnikov, Carter and Stayancho11], copper thiocyanate (CuSCN) [Reference Paudel and Yan12], nanocrystals and nanocomposites [Reference Bhandari, Koirala, Paudel, Khanal, Phillips, Yan, Collins, Heben and Ellingson13, Reference Bastola, Bhandari and Ellingson14, Reference Bastola, Bhandari and Ellingson15, Reference Bastola, Bhandari, Subedi, Podraza and Ellingson16, Reference Subedi, Bastola, Subedi, Song, Bhandari, Phillips, Podraza, Heben and Ellingson17], zinc telluride (ZnTe) [Reference Li, Diercks, Ohno, Warren, Lonergan, Beach and Wolden18], and antimony telluride (Sb2Te3) [Reference Kurley, Panthani, Crisp, Nanayakkara, Pach, Reese, Hudson, Dolzhnikov, Tanygin, Luther and Talapin19], prepared by various methods, have been used in an attempt to reduce the back barrier height and facilitate hole transport toward the back electrode. Alternatively, formation of tellurium (Te)-rich surface/layer through thermal evaporation, sputtering or chemical etching at the back interface led to improved device efficiency and back barrier height [Reference Ochoa-Landín, Vigil-Galan, Vorobiev and Ramírez-Bon20, Reference Song, Moore and Sites21]. Niles et al. reported the reduction of Schottky barrier to 0.26 eV for >5 nm Te layer on CdTe improving the hole transport compared to Au only contact (0.80 eV) [Reference Niles, Li, Sheldon and Höchst22] and Watthage et al. also found reduced back barrier (0.20 eV) due to etching [Reference Watthage, Phillips, Liyanage, Song, Gibbs, Alfadhili, Alkhayat, Ahangharnejhad, Almutawah and Bhandari23].
The wet chemical etching of CdTe usually includes the use of an alcoholic bromine (Br2) solution or an acidic solution that creates a Te-rich surface. Previously reported common acidic etchants are mixture of HNO3–HPO4–H2O (NP) [Reference Sarlund, Ritala, Leskelä, Siponmaa and Zilliacus24], H2O2–HI–tartaric/citric acid [Reference Ivanits’Ka, Moravec, Franc, Tomashik, Feychuk, Tomashik, Shcherbak, Mašek and Höschl25, Reference Moravec, Ivanits’ka, Franc, Tomashik, Tomashik, Mašek, Feychuk, Shcherbak, Höschl and Grill26], KIO3–KI–citric acid [Reference Moravec, Tomashik, Ivanits’Ka, Tomashik, Franc, Mašek and Höschl27], and K2Cr2O7–HNO3–H2O [Reference Ricco, White and Wrighton28]. Other alcoholic solutions applied for etching are bromine methanol (Br2–MeOH) [Reference Bensouici, Carcelen, Plaza, De Dios, Vijayan, Crocco, Bensalah, Dieguez and Elaatmani29], iodine methanol (I2–MeOH) [Reference Ivanits’ka, Moravec, Franc, Tomashik, Tomashik, Mašek, Chukhnenko, Höschl and Ulrych30], methylammonium iodide (MAI) [Reference Watthage, Phillips, Liyanage, Song, Gibbs, Alfadhili, Alkhayat, Ahangharnejhad, Almutawah and Bhandari23], and hydroiodic acid [Reference Awni, Li, Grice, Song, Razooqi, Phillips, Bista, Roland, Alfadhili and Ellingson31]. For MAI selective etching, authors have reported the average power conversion efficiency of 13.8% (V OC 834 mV, FF 77.2%) for 20 cells with 2 nm evaporated Cu, while the unetched devices had the average power conversion efficiency of 12.5% (V OC 796 mV, FF 74.6%)[Reference Watthage, Phillips, Liyanage, Song, Gibbs, Alfadhili, Alkhayat, Ahangharnejhad, Almutawah and Bhandari23]. The Br2–MeOH etch is very corrosive to metals and may penetrate the entire CdTe film and damage the front interface. Similarly, K2Cr2O7–HNO3 etch produces TeO2 on the surface and the film that needs to be further treated with alkaline etch (KOH–MeOH). Ivanits’ka et al. have reported the effect of I2–MeOH etching on the CdTe single crystals and found the dissolution is diffusion controlled [Reference Ivanits’ka, Moravec, Franc, Tomashik, Tomashik, Mašek, Chukhnenko, Höschl and Ulrych30]. However, the authors did not report the effect of etching on polycrystalline CdTe thin film and device performance after etching. The etching of CdTe with iodine (or iodine compounds) is beneficial over Br2–MeOH due to its less corrosive and less toxic nature. Additionally, iodine has a lower redox potential (I2 → 2I−, 0.54 V) than bromine (Br2 → 2Br−, 1.09 V), which leads to controllable etching of CdTe surface [Reference Ivanits’Ka, Moravec, Franc, Tomashik, Feychuk, Tomashik, Shcherbak, Mašek and Höschl25].
Here, we investigate wet chemical treatment of CdTe back surface using various iodine compounds. The various iodine compounds include elemental iodine (I2), ammonium iodide (NH4I), a mixture of I2 and NH4I (I−/I3− etching), and formamidinium iodide (FAI). The CdTe surface was treated with these etchant solutions and annealed in ambient environment. The treated CdTe surfaces were characterized using Raman spectroscopy, X-ray diffraction (XRD), scanning electron microscopy (SEM), and energy-dispersive spectroscopy (EDS). The CdTe devices were completed with or without treatments, and devices were measured to determine the effect of treatment on device performance. The Raman spectra, XRD patterns, and surface morphology of CdTe surface revealed a Te-rich surface when treated with iodine compounds. Based on current–voltage (J–V) characteristics of the device, the treatment enhanced open-circuit voltage (V OC), fill factor (FF), and photoconversion efficiency (PCE) compared with standard unetched devices with a Cu/Au back contact.
Results and discussion
Etching with iodine (I2), ammonium iodide (NH4I), and mixed I−/I3− solutions
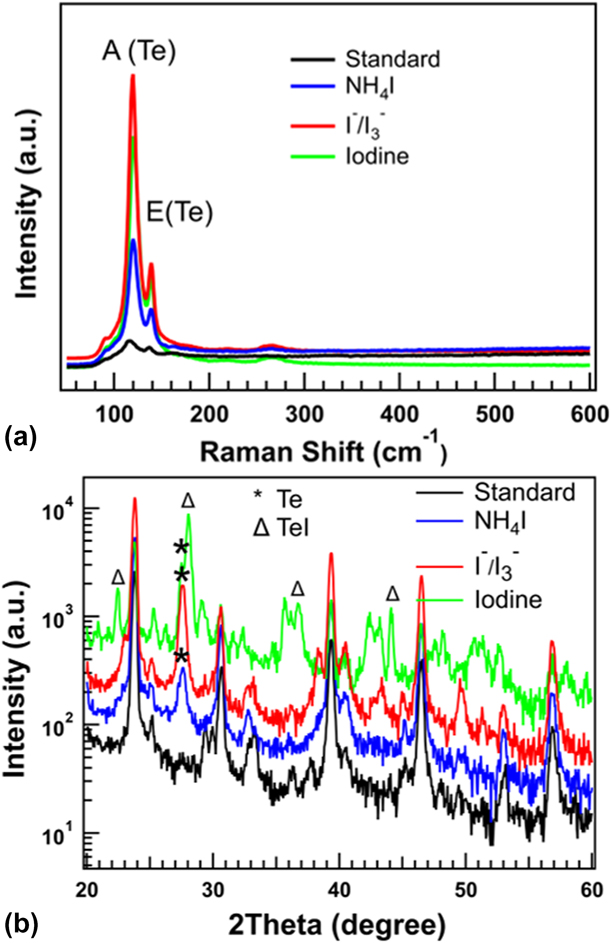
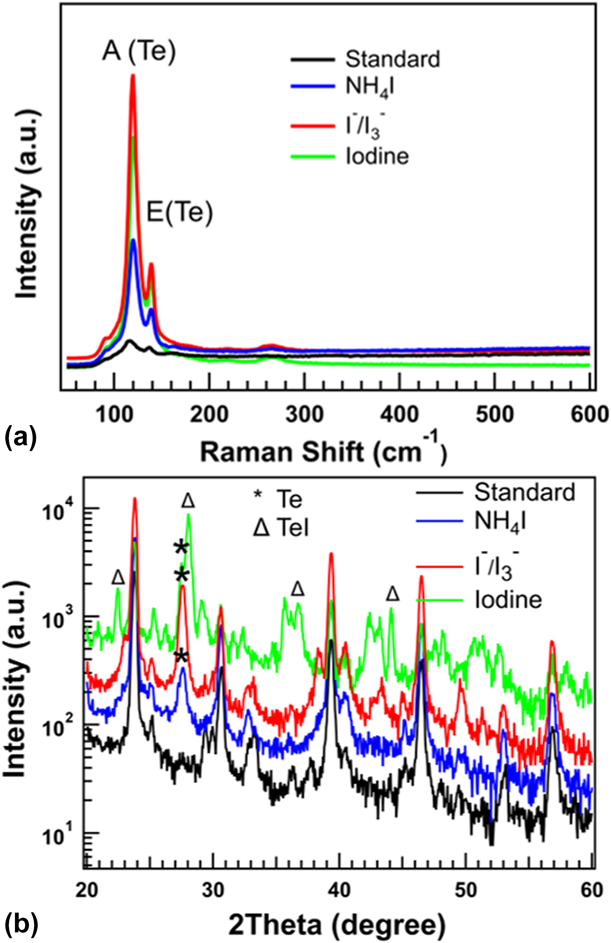
Figure 1 shows the Raman spectra and XRD patterns of CdTe films treated with I2, NH4I, and mixture of I2 and NH4I (I−/I3−) solutions. During the Raman measurement, the CdTe samples were exposed to laser for 30 s to minimize the laser effect [Reference Simonds, Meadows, Misra, Ferekides, Dale and Scarpulla32]. Here, in the Raman spectra, the active vibrational peaks of Te–Te atoms observed at 119.7, 139.0, and 266.6 cm−1 are stronger for the etched samples than for the untreated (standard) CdTe film. The strong vibrational modes of treated films suggest the selective etching of the CdTe films to produce Te surface after the treatment. Furthermore, the treated CdTe films show a diffraction peak at 27.6°, which is assigned to diffraction due to the elemental Te. We observed this diffraction peak at 27.6° for all three etchants, elemental iodine, NH4I, and I−/I3−. Previously, authors have reported a diffraction peak at 27.6° for Te-rich surface after etching CdTe surface with various etchants [Reference Watthage, Phillips, Liyanage, Song, Gibbs, Alfadhili, Alkhayat, Ahangharnejhad, Almutawah and Bhandari23, Reference Koll, Taha and Giolando33]. Interestingly, in the case of elemental iodine, TeI peaks were also observed at various “2θ” positions (22.45°, 28.05°, 36.70°, 44.10°) marked by ∆ in Fig. 1(b). The diffraction pattern analysis showed that these peaks are produced due to the presence of tellurium iodide (TeI) β-phase compound on the surface. The XRD patterns were analyzed by MDI ZADE software, and these peaks were assigned to Te and TeI based on comparison with standard diffraction patterns of Te (PDF #97-002-3060) and TeI-β (PDF #97-000-0108) phase.
(a) Raman spectra and (b) XRD patterns of CdTe thin films after etching with iodine (I2), ammonium iodide (NH4I), and mixed I−/I3− solutions. The peaks marked by * at 27.6° are for Te (101) (PDF #97-002-3060) and peaks marked by ∆ indicate TeI β-phase (PDF #97-000-0108).
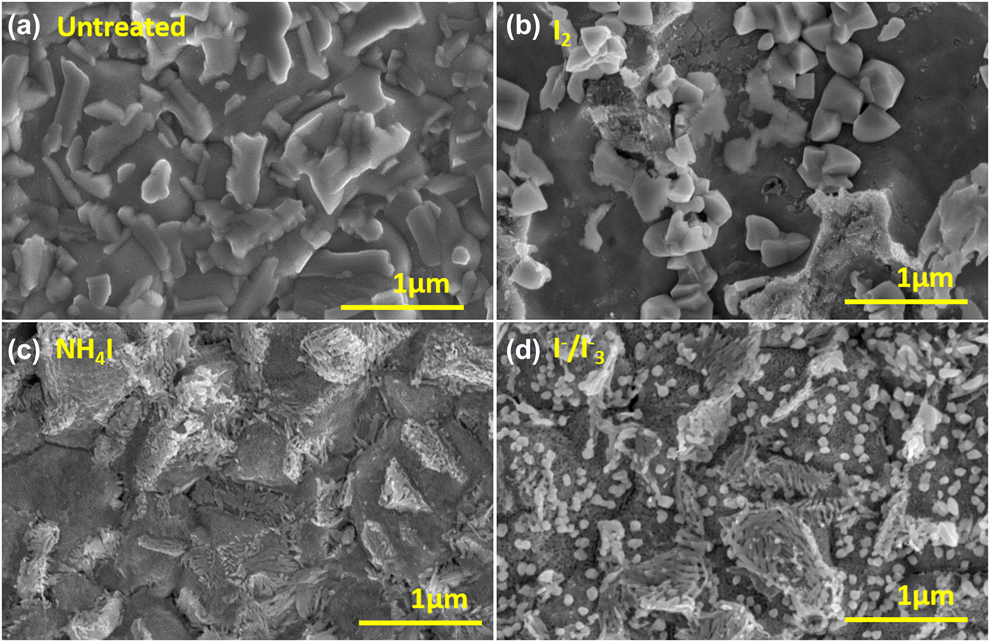
Similarly, the surface topography of the standard and treated films was studied by SEM, and elemental compositions were determined using EDS. Figure 2 shows the SEM images and surface topography of CdTe surface after chemical treatment in all three cases. The surface topography looks very different compared with unetched standard CdTe. In the iodine etching (0.21 M) shown in Fig. 2(b), the treatment produced a significant number of bulky particles as evident. NH4I etching (0.42 M) produced somewhat uniform surface topography, and in case of I−/I3−, etching produced some tiny particles on the surface in addition to the rough surface. Here, based on the Raman and XRD patterns of these etched CdTe films, we concluded that these etchants have significant impact on the CdTe surface. To confirm the elemental composition, EDS spectra were acquired and tabulated in Table SI (Supporting information, SI) for standard (unetched) and etched CdTe films. In case of standard CdTe, the ratio of Cd to Te is about 1.14. After the treatment, Cd to Te ratio became 0.74 for 0.21 M I2 etching, and 0.95 and 0.88 for 0.42 M NH4I and I−/I3− (0.375% I2 solution (0.21 M) in 0.42 M NH4I solution), respectively, indicating modified surface composition. A previous study shows the treatment of CdTe using polyaniline produced Cd to Te ratio close to 0.72, which is beneficial for fabrication of efficient devices [Reference Tessema and Giolando34]. In CdTe PVs, a Te-rich material, which has pronounced p-type characteristics on the surface, is more suitable for forming a low-barrier back contact [Reference Ochoa-Landín, Vigil-Galan, Vorobiev and Ramírez-Bon20]. Note that EDS measurements were carried out at an accelerating voltage of 20 kV and current of 10 μA, and hence, the information obtained is not limited to the surface. Instead, this value refers to the average obtained from the interaction volume during the measurement. Based on these Raman spectra, diffraction patterns, surface topography, and EDS analysis, we confirm that these treatments produced selective etching to Cd, leaving a Te-rich surface.
SEM images of CdTe thin films after etching with various iodine compounds: (a) untreated, (b) iodine (I2), (c) ammonium iodide (NH4I), and (d) mixed I−/I3− solutions.

Based on elemental compositions presented in Table SI, Reactions (1) and (2) can be considered for dissolution of cadmium into iodine solutions [Reference Kurley, Panthani, Crisp, Nanayakkara, Pach, Reese, Hudson, Dolzhnikov, Tanygin, Luther and Talapin19]. The tellurium oxide (TeO2) and CdTe react with iodine (or triiodide) ions and Cd gets dissolved in the solution. The dissolution of CdTe film in the etchant solutions depends on the time and concentration of iodine ions in the etchant solution. In the Raman spectra (Fig. 1), the intensity of active mode at 119.7 cm−1 for Te–Te atoms is significantly higher in case of I−/I3− etch than in the I2 and NH4I. I2 and NH4I solutions have the same atomic concentration of iodine atoms, indicating I−/I3− etching solution is more effective at producing Te-rich surface compared with pure I2 or NH4I solution.
 $${\rm{Te}}{{\rm{O}}_2}\;\left( {\rm{s}} \right) + {\rm{4N}}{{\rm{H}}_4}^ + + 6{{\rm{I}}^ - } \to {\rm{Te}}\;\left( {\rm{s}} \right) + 2{{\rm{H}}_2}{\rm{O}} + 2{{\rm{I}}_3}^ - + 4{\rm{N}}{{\rm{H}}_3}\quad$$
 $${\rm{CdTe}}\;\left( {\rm{s}} \right) + {{\rm{I}}^ - }\left( {{\rm{or}}\;{{\rm{I}}_3}^ - } \right) \to {\rm{Te}}\;\left( {\rm{s}} \right) + {\rm{C}}{{\rm{d}}^{2 + }} + {{\rm{I}}^ - }\left( {{\rm{or}}\;3{{\rm{I}}^ - }} \right)\quad$$
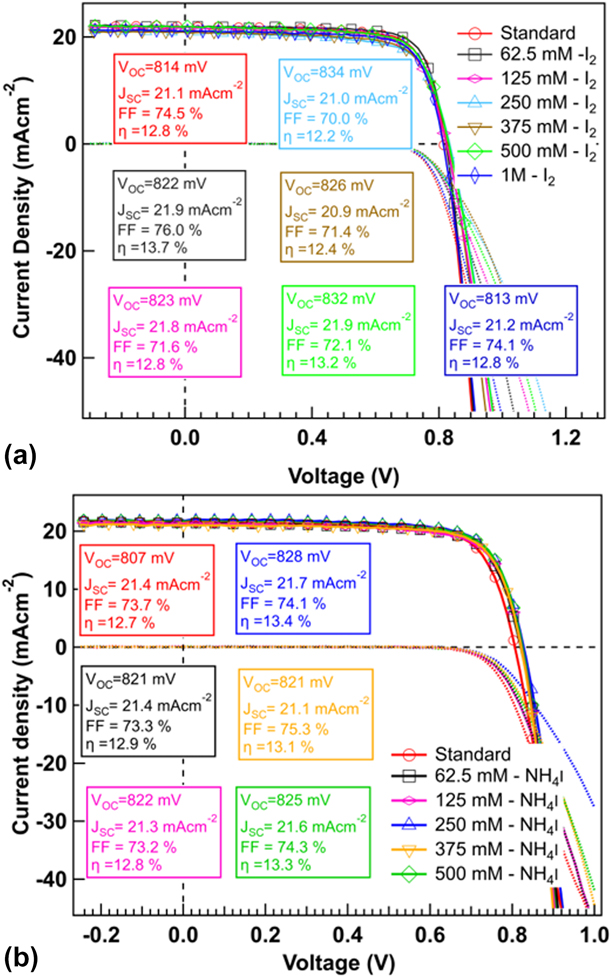
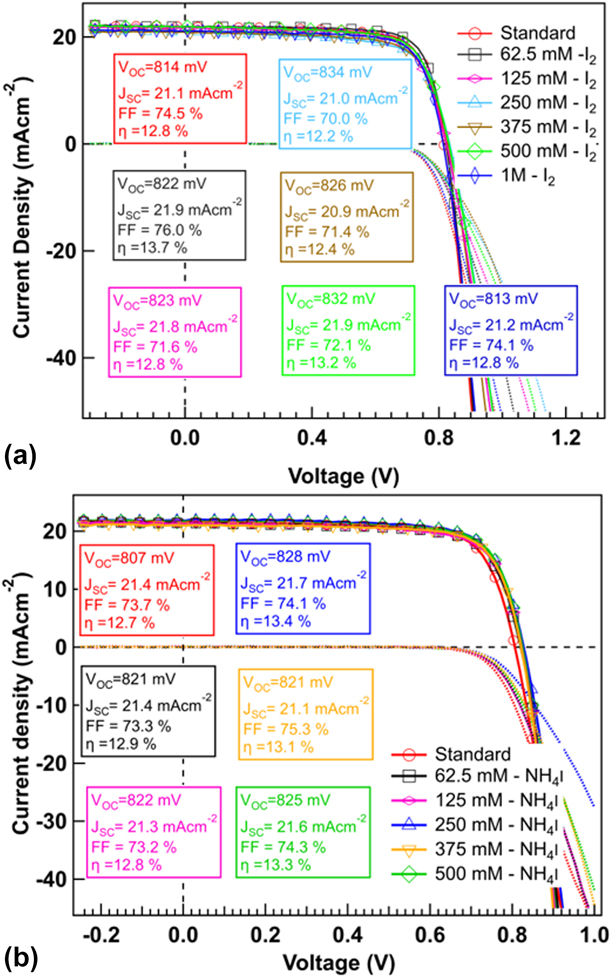
Since a Te-rich surface is beneficial for fabrication of efficient devices, we tested the effect of these treatments on CdTe devices with various concentrations of etchant solution. Figure 3(a) displays J–V characteristics of the best cells completed after etching CdTe films with various concentrations of iodine (I2) solution. After etching, the best cells show higher or comparable efficiency compared with the standard cells. However, the average device performance of the 20 cells after etching is slightly low except for 62.5 mM iodine solution (see Table SII). In case of 62.5 mM iodine solution, the best cell has V OC of 822 mV, J SC of 21.9 mA/cm2, and FF of 76.0% with the PCE of 13.7%, with average PCE of 12.5%. In case of standard device, the best cell has V OC of 814 mV, J SC of 21.1 mA/cm2, and FF of 74.5% with PCE of 12.8%, with average PCE of 12.3%.
Typical J–V characteristics of CdTe solar cells with (a) iodine and (b) NH4I etching of various concentrations.
We further analyzed the CdTe surfaces after etching with higher I2 concentration. Based on SEM images (Fig. S1, Supporting information), the CdTe surface shows a significant number of larger particles. As the concentration of iodine solution increased, the density of these particles increased with rod-like structures. EDS measurement of a particle on CdTe surface treated with 250 mM iodine solution revealed atomic ratio of Cd:Te:I to be 1:7:6 (Fig. S2). This ratio and the diffraction peaks marked by ∆ in Fig. 1 indicate the formation of TeI on the CdTe surface. The devices with higher concentration of iodine solution (≥125 mM) showed decrease in FF due to the increase in series resistance of the device (presented in Table SII). Thus, these TeI particles formed due to the iodine treatment are detrimental to fabricating highly efficient devices after etching.
Similarly, J–V characteristics and average parameters of devices treated with NH4I solution are presented in Fig. 3(b) and Table SIII. The device performance was slightly enhanced after NH4I etching. The average PCE for devices treated with 250 mM and higher concentration of NH4I solution is same (12.7%) and the best cell for 250 mM NH4I has the higher efficiency compared with other NH4I concentration. The device treated with 250 mM NH4I has V OC of 828 mV, J SC of 21.7%, and FF of 74.1% with the PCE of 13.4%, which is about 10% higher than average performance (12.1%) of untreated CdTe devices.
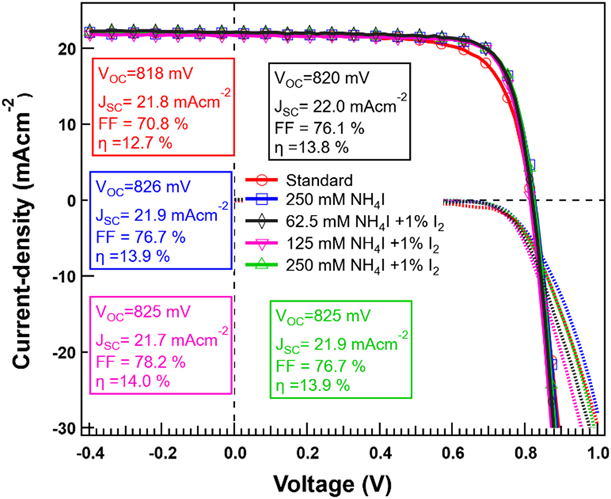
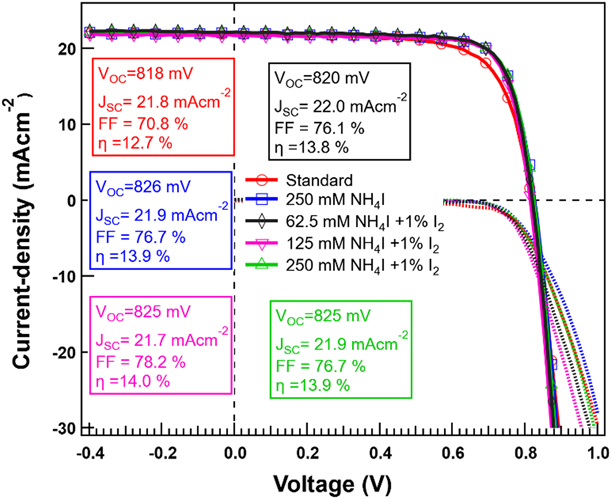
Furthermore, we tested the effect of I−/I3− etching on device performance of CdTe solar cells. For this, I−/I3− solution with varying concentrations of NH4I was prepared by mixing 1% of I2 solution of same concentration. For example, 250 mM NH4I (1000 μL) solution was mixed with 1% 250 mM (10 μL) I2 solution to make 250 mM NH4I + 1% I2 solution. Figure 4 shows the J–V characteristics of the best cells of the devices etched with I−/I3− and Fig. S3 shows the external quantum efficiencies (EQEs). Here, the devices etched with 125 mM NH4I and 1% I2 have FF of 78.2% with a device efficiency of 14.0% with average PCE of 13.5% for 20 cells. The etching increased the average device efficiency by 8% compared with the unetched devices (PCE of 12.5%). The average device parameters for 20 cells for various etching concentrations are presented in Table I. The average device performances of etched devices are better than those of the unetched devices. During this process, annealing of the CdTe film is essential to produce visible Te grains on the surface (Fig. S4). Thus, we conclude that the etching of CdTe devices with I−/I3− solution helps to remove the oxide layer, dissolves cadmium atoms, and creates a Te-rich layer on the surface, enhancing the device performance.
Typical J–V characteristics of CdTe solar cells with I−/I3− etching of various concentration.
Summary of average J–V characteristics of CdTe solar cells with iodine etching of various concentration.

Etching with FAI
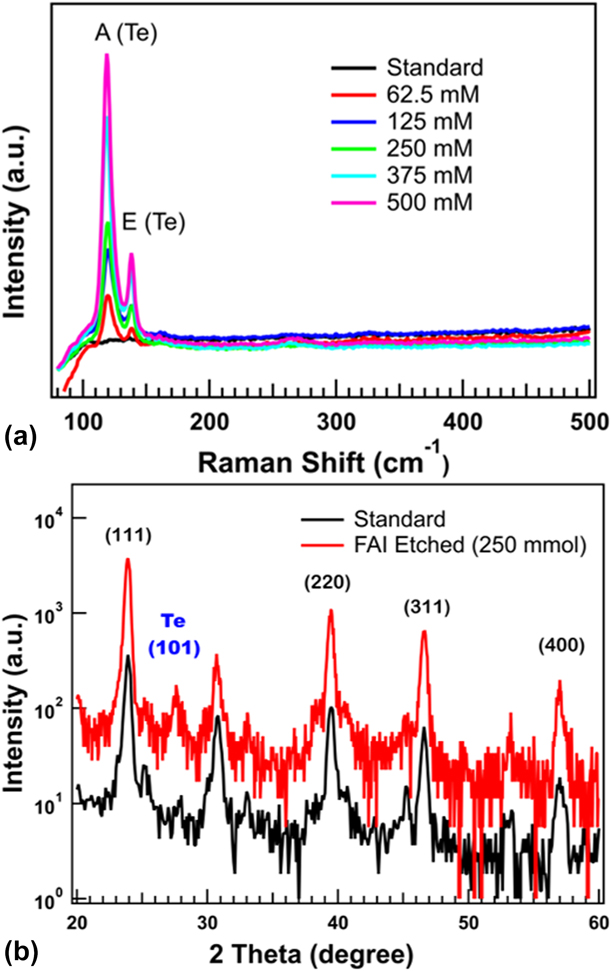
The Raman spectra of the standard and FAI-treated CdTe films are shown in Fig. 5(a). Based on these spectra, no vibrational peaks of Te were observed for a standard CdTe film, whereas very strong peaks were observed at 120 and 139 cm−1 for FAI-treated CdTe surface. As the concentration of the FAI solution increases, the intensity of the vibrational peak also increases, indicating higher Te content in the etched CdTe surface. The XRD patterns measured for standard and etched CdTe samples with 250 mM FAI solution are presented in Fig. 5(b). The major diffraction peaks are same for standard and etched CdTe films; however, an additional diffraction peak is observed at 2θ angle 27.6° for FAI-etched CdTe film. The observed peak at 27.6° is assigned to elemental Te (101). This Te peak is same as the peak observed on the CdTe film treated with iodine, NH4I, and I−/I3− solutions (Fig. 1).
(a) Raman spectra of CdTe surface etched with various concentrations of FAI solution and (b) XRD patterns of standard and FAI-etched CdTe films.
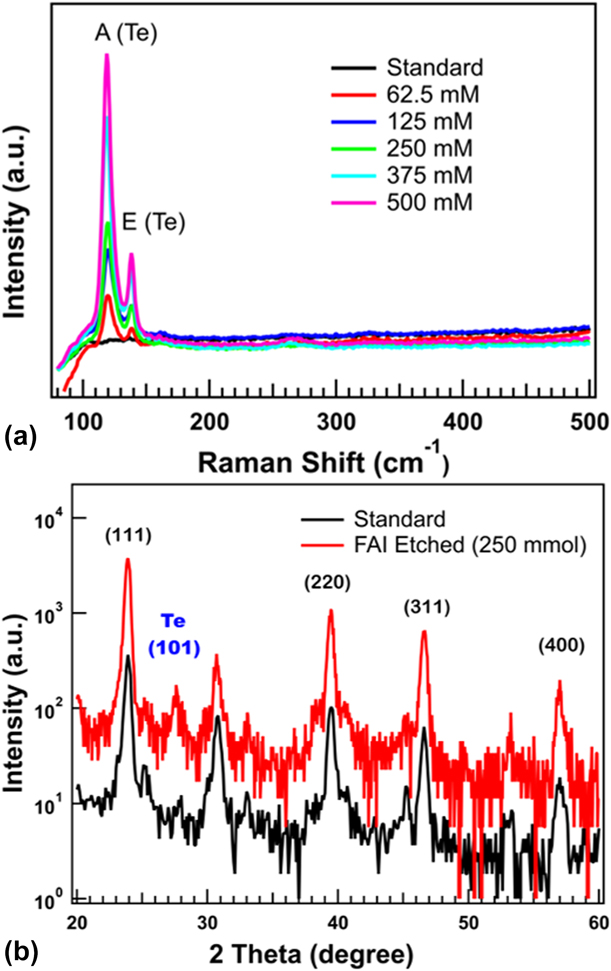
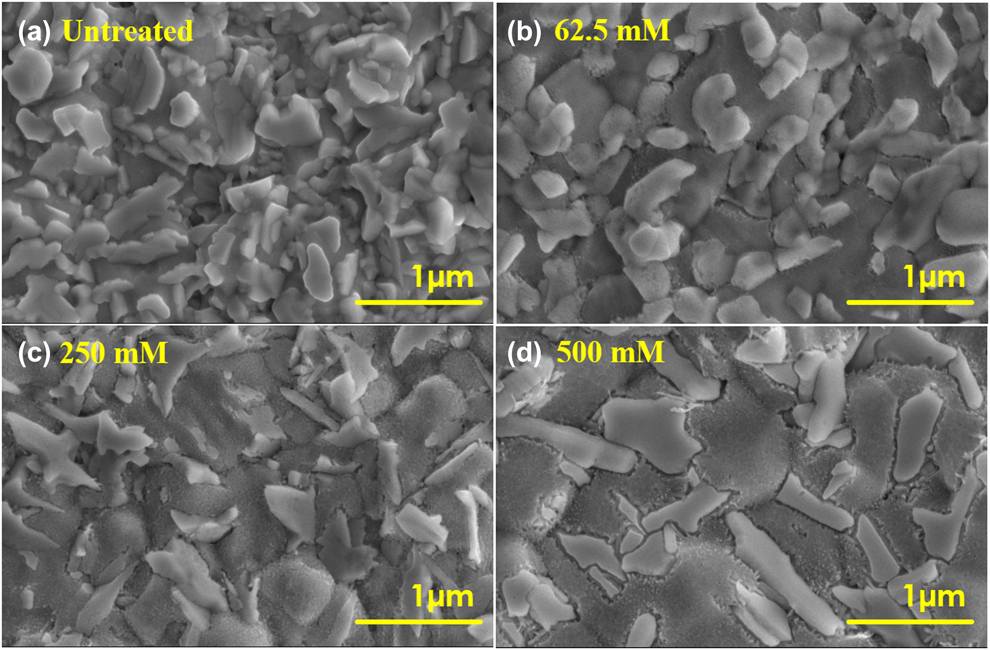
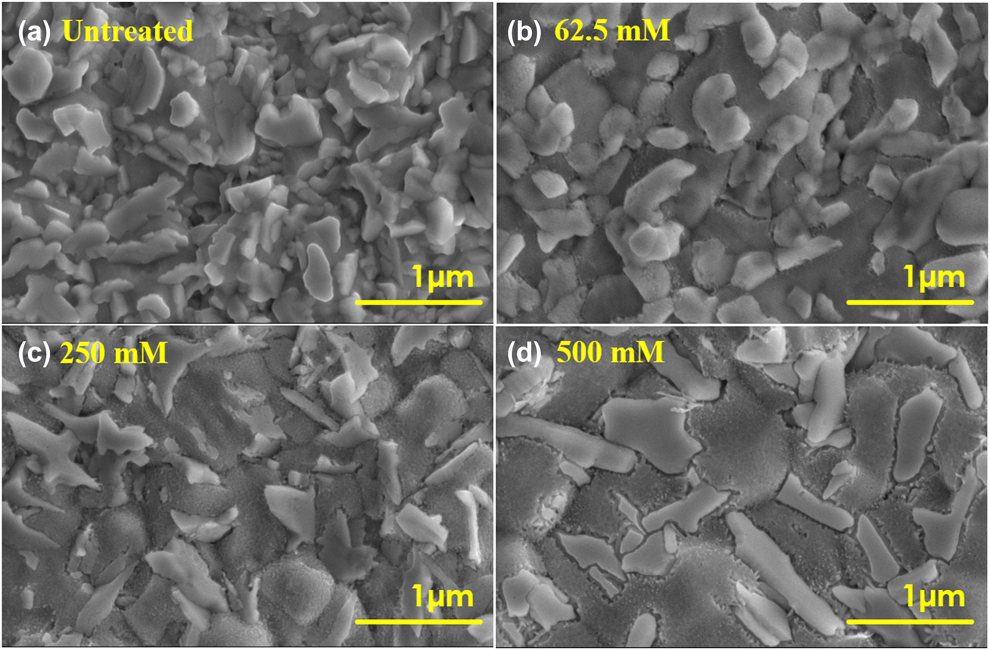
Figure 6 displays the SEM images of the standard and FAI-treated CdTe films. The FAI treatment clearly changes the surface topography of the CdTe surface. As the surface was treated with higher concentration of FAI solution, the more Te grains become visible. Here, Cd2+ ions react with I− ions forming other compounds, possibly FACdI3 perovskites leaving Te atoms on the surface.
Surface topography of (a) standard CdTe surface and CdTe surface etched with FAI solution of concentrations: (b) 62.5 mM, (c) 250 mM, and (d) 500 mM. The CdTe films were annealed for 10 min at 150 °C before rinsing with 2-propanol in air environment.
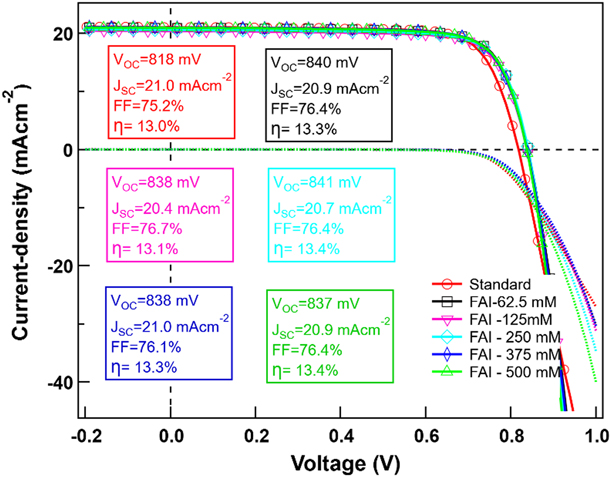
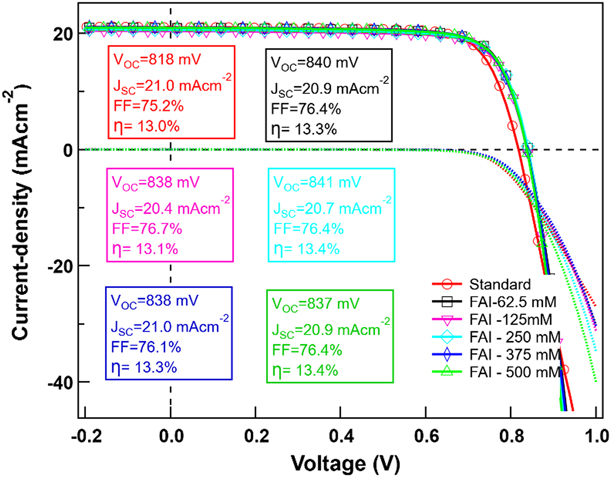
J–V characteristics of best cells of standard and FAI-treated CdTe devices are shown in Fig. 7 and EQEs are shown in Fig. S5. The back contact was fabricated with and without FAI etching using Cu/Au. The FAI treatment was carried out using various concentrations of FAI solution at ambient environment. The J–V curve indicates that performance of the device is enhanced by etching the CdTe surface with FAI solution. The V OC and FF increase in the etched CdTe compared with standard CdTe devices is shown in Table II. For the standard cells without FAI etching, the average PCE is 12.6% with V OC of 814 mV and FF of 74.7% for 20 cells and the best cell has an efficiency of 13.0% with V OC of 818 mV and FF of 75.2%. In all the cases when treated with FAI, the V OC and FF improved for etched devices. Here, 250 mM FAI-etched devices were found to have the highest average PCE of 13.1% with average V OC of 839 mV and FF of 76.2% and the best cell has PCE of 13.4% with V OC of 841 mV.
Current density versus voltage (J–V) characteristics of standard and FAI-treated cells.
Summary of average J–V characteristics of CdTe solar cells with FAI treatments.

Temperature-dependent current–voltage characteristics
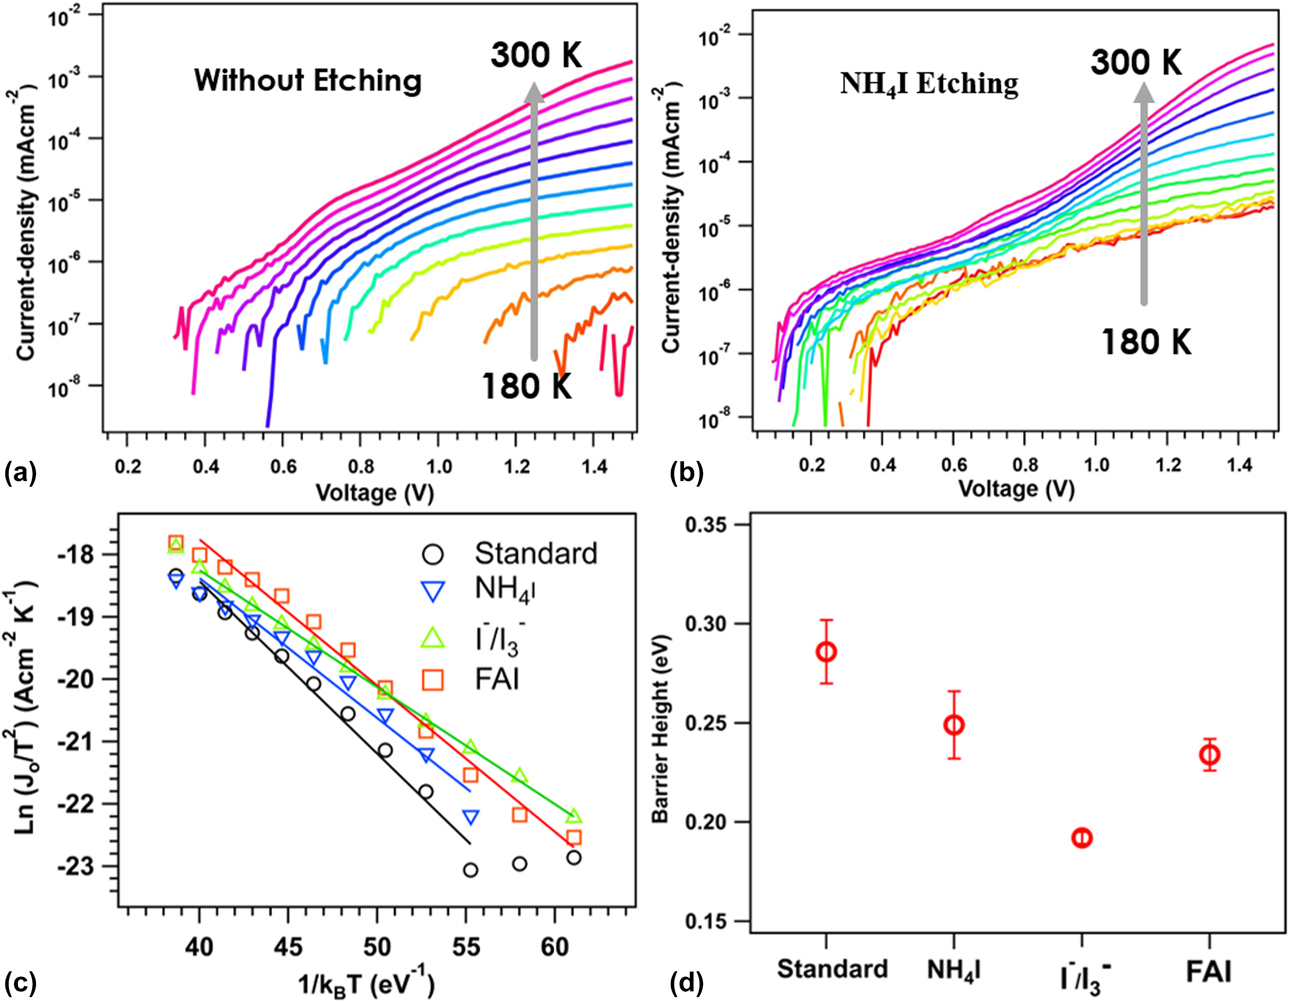
To study the effect of chemical etching on the back barrier height of CdTe devices, temperature-dependent current–voltage (J–V–T) characteristics were measured and analyzed using the model described by Niemegeers and Burgelman [Reference Niemegeers and Burgelman35] to obtain back barrier heights. The back barrier height (ϕb) was obtained, assuming thermionic emission model as given by:
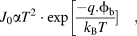 $${J_0}\alpha {T^2} \cdot \exp \left[ {{{ - q.{\phi _{\rm{b}}}} \over {{<italic>k</italic>_{\rm{B}}}T}}} \right]\quad ,$$
where J 0 is the saturation current, q is electronic charge, and k B is the Boltzmann constant. The back barrier heights were obtained by fitting Arrhenius plots of Ln (J 0/T 2) versus 1/k BT.
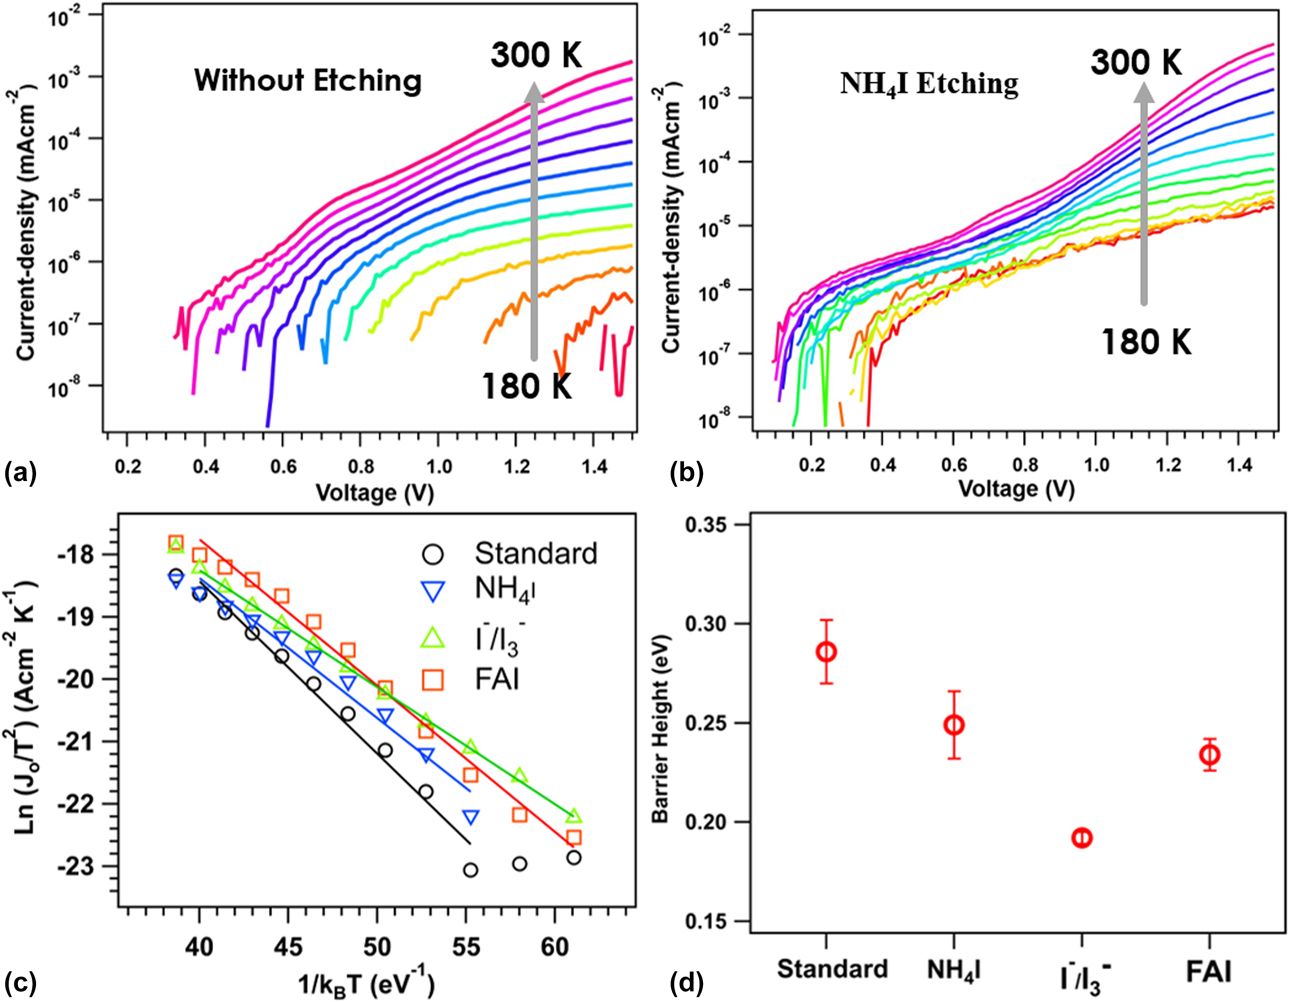
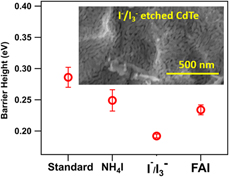
Figures 8(a) and 8(b) show the J–V–T characteristics of CdTe devices measured under dark conditions without etching and with NH4I etching, respectively. Figure 8(c) shows the plots of Ln (J 0/T 2) versus 1/k BT and the solid lines represent linear fit of the corresponding data to extract back barrier height. For the standard CdTe device without etching, the barrier height is 0.286 ± 0.016 eV, which is close to the values reported previously for CdTe devices with Cu/Au back contact [Reference Bhandari, Tan, Zereshki, Alfadhili, Phillips, Koirala, Heben, Collins and Ellingson10]. In the case of NH4I etching, the barrier height was reduced to 0.249 ± 0.017 eV and further reduced to 0.192 ± 0.003 eV with I−/I3− etching. Similarly, the barrier height of the CdTe devices etched with 250 mM FAI solution was 0.234 ± 0.008 eV. Based on these reduced back barrier heights, we conclude that etching of CdTe films with iodine solutions helps to lower the back barrier height and improve the device performance.
Temperature-dependent current–voltage (J–V–T) characteristics of CdTe devices (a) without etching and (b) etching with NH4I solution. (c) Plots of Ln (J o/T 2) versus 1/k BT for standard and NH4I, I−/I3−, and FAI etching and (d) values of back barrier height for standard and etched devices.
Conclusions
Here, we have successfully investigated etching of CdTe film using iodine compounds to produce Te-rich surface. The treatment of CdTe surface with elemental iodine (I2), ammonium iodide (NH4I), I−/I3−, and FAI resulted in very strong vibrational peaks of Te–Te at 120 and 139 cm−1 in the Raman spectra. Similarly, the study of surface topography shows Te grains on the surface compared with untreated standard CdTe sample. In the XRD pattern analysis, an additional peak of elemental Te (101) was observed at 2θ angle equal to 27.6°. In case of treatment with elemental iodine, iodine atoms react with Te to produce TeI in β-phase. The device performance of CdTe after etching was improved mainly due to the improvement in open-circuit voltage and FF of the device due to the formation of Te-rich layer. For etched device, the highest open-circuit voltage observed was 841 mV and FF was 78.2% with PCE of 14.0%, while untreated devices have open-circuit voltage of 814 mV FF of 74.0% with PCE of 12.7%. The J–V–T characteristics showed reduced back barrier heights for etched devices compared with standard CdTe devices. Thus, this study shows that efficient CdTe devices can be fabricated by etching the CdTe surface with iodine solution.
Experimental methods
Iodine (I2, 99.8%) and ammonium iodide (NH4I, 99.995%) were purchased from Fisher Scientific. FAI (99%), cadmium chloride (CdCl2, 99.999%), anhydrous methanol (CH3OH, 99.8%), and anhydrous 2-propanol [isopropanol alcohol (IPA), 99.5%] were obtained from Sigma-Aldrich. All the chemicals were used as obtained without further purification. The CdS/CdTe device stacks were fabricated by vapor transport deposit method onto TEC™-15 M glass substrates by Willard & Kelsey Solar Group. The wet CdCl2 treatment was carried out at 390 °C for 30 min using saturated CdCl2 solution in methanol in a dry air environment, washed with methanol and dried under nitrogen flow.
Procedure
Etching with iodine (I2), ammonium iodide (NH4I), and mixed I−/I3− solution
The etching procedure was carried out similar to the work of Kurley et al. [Reference Kurley, Panthani, Crisp, Nanayakkara, Pach, Reese, Hudson, Dolzhnikov, Tanygin, Luther and Talapin19]. A saturated solution of NH4I in IPA (60 mg/mL, 0.42 M) was prepared by stirring overnight. To keep the same atomic concentration, a 54 mg/mL (0.21 M) solution of I2 in IPA was also stirred overnight. I−/I3− etching solution was prepared by mixing 94 μL of 0.21 M I2 in IPA with ∼25 mL of 0.42 M NH4I in IPA. For each etching treatment, around 200 μL of etching solution was placed in CdTe films, kept for 10 s, and spun for 30 s at 4000 rpm. The treated CdTe films were annealed at 150 °C in an air environment for 10 min and rinsed twice with IPA (each 250 μL) and spun for 30 s at 4000 rpm to dry. Similarly, during the device fabrication, the concentrations were varied but time and annealing temperature were held constant.
Etching with FAI solution
FAI solution in IPA was prepared with varying concentrations (50, 125, 250, 375, and 500 mM). The FAI solution was kept at 110 °C for about 1 h with continuous stirring. The CdTe surface was treated with FAI solution for 30 s, then spun at 4000 rpm for 30 s at ambient environment. Then, the films were annealed at 150 °C for 10 min and rinsed twice with IPA. The FAI-treated samples were stored in a nitrogen ambient glove box for further characterization and device fabrication.
Characterization, device fabrication, and testing
The Raman spectroscopy measurement was carried using a Jobin Yvon Horiba confocal Raman spectrometer fitted with HeNe laser source of wavelength 632.8 nm. The XRD patterns were obtained from Rigaku Ultima III X-ray Diffractometer at 40 kV accelerating voltage and 44 mA current. The surface morphology and chemical composition were studied using Hitachi S-4800 UHR SEM fitted with EDS. To complete CdS/CdTe solar cells, 3 nm copper (Cu) and 40 nm gold (Au) were thermally evaporated on the CdTe films. The samples were annealed at 150 °C for 35 min for Cu diffusion at ambient environment. The devices were laser scribed [Reference Phillips, Song, DeWitt, Stone, Krantz, Royston, Zeller, Mapes, Roland, Dorogi, Zafar, Faykosh, Ellingson and Heben36] with active device area 0.06 cm2, and current density versus voltage (J–V) characteristics were measured using standard simulated AM1.5 solar irradiance. EQE was measured as a function of incident light wavelength using a commercial QE system (Model IVQE8-C; PV Measurements Inc.), the monochromatic light intensity of which was calibrated with a reference silicon diode at each wavelength.
Supplementary material
To view supplementary material for this article, please visit https://doi.org/10.1557/jmr.2019.363.
Acknowledgments
This material is based on research sponsored by Air Force Research Laboratory under agreement number FA9453-18-2-0037. The U.S. Government is authorized to reproduce and distribute reprints for Governmental purposes notwithstanding any copyright notation thereon. We also thank Willard & Kelsey Solar Group for providing CdS/CdTe device stacks.
Disclaimer: The views and conclusions contained herein are those of the authors and should not be interpreted as necessarily representing the official policies or endorsements, either expressed or implied, of Air Force Research Laboratory or the U.S. Government.