


Introduction
During the past decade, new ice cores have become available from Greenland and Antarctica, and analytical techniques have been improved. Analyses of the concentration of the three greenhouse gases CO2, CH4 and N2O have provided more reliable results which have confirmed the general features of earlier findings: the industrial increase of all three components, and significant changes in the concentration of all three gases parallel to the large climatic cycles.
This paper focuses mainly on smaller variations. Several of these were published many years ago and some have been called tentative and questionable. We will discuss their likelihood by comparing them with recently published records and present state-of-the-art records of the atmospheric composition of the three air components for the last millennium, the Holocene, the transition from the last glacial epoch to the Holocene and part of the last glacial epoch (<60 000 years BP).
One way of testing the validity of ice-core results is to compare them with mixing ratios measured directly in atmospheric air, but this is applicable only to the last 10–50years at most. for older periods the main measure of the reliability of ice-core results is their consistency between ice cores from different drilling sites with different temperatures, accumulation rates and impurity concentrations. Such tests have shown that CO2 and N2O, andpossibly to a lesser extent also CH4, can be produced or depleted in the ice by chemical reactions between impurities or biological activities even at very low temperature (Reference Anklin, Barnola, Schwander, Stauffer and RaynaudAnklin and others, 1995; Reference FlückigerFlückiger and others, 1999; Reference Tschumi and StaufferTschumi and Stauffer, 2000; Reference SowersSowers, 2001). Such artefacts may affect smaller, short-term variations, rather than the general trend. Uncertainties in the age scales of different ice cores make it difficult to verify short-term variations by testing the consistency between different cores. Also the consistency of results with values measured in atmospheric air in the short overlapping interval loses some of its power, since chemical reactions take time, and the reaction products may not yet be observed in relatively young ice.
Only ice cores from very cold locations where summer melting can be excluded are suitable for CO2 analyses, due to the high solubility of CO2 in water. An enhancement of CO2 is not necessarily confined to visible melt layers. CO2 is also enriched due to high solubility in snow crystals and firn grains. the air dissolved in these grains is gradually expelled due to recrystallization within the firn, but some air may remain, especially if the interval between snowfall and firn– ice transition is relatively short (Reference Stauffer, Oeschger and SiegenthalerStauffer and others, 1984). CO2 can be modified in the ice by acid–carbonate reactions if carbonate particulates are present (Reference DelmasDelmas, 1993; Reference SmithSmith and others, 1997) or produced by the oxidation of organic compounds (Reference Tschumi and StaufferTschumi and Stauffer, 2000). It is generally assumed that Antarctic ice cores are better suited for CO2 analyses due to the lower impurity concentrations compared to Greenland. However, impurity concentrations are generally higher during ice ages, and Antarctic ice representing glacial epochs has more soluble impurities than Greenland ice cores representing the Holocene (Reference Legrand and MayewskiLegrand and Mayewski, 1997). CO2 depletion can occur due to fractionation during the extraction procedure, especially in ice from the transition zone of ice sheets where the air is partly enclosed in clathrates, as bubble air is more easily extracted and is slightly depleted in CO2 relative to air in clathrates (Reference Stauffer, Tschumi and HondohStauffer and Tschumi, 2000). the analytical reproducibility of CO2 analyses on ice cores, including the extraction procedure, is reported to be 1.2 (Reference Etheridge, Steele, Langenfelds, Francey and Morgan.Etheridge and others, 1996) to 3 ppm (Reference Barnola, Anklin, Raynaud, Schwander and StaufferBarnola and others, 1995) (1σ scatter). If we assume that the analytical reproducibility is well constrained and that Antarctic ice cores from cold sites with low impurity content contain undisturbed atmospheric air, replicate measurements on neighbouring ice samples should lead to a scatter comparable to the analytical reproducibility. However, recent high-resolution records along short ice-core sections representing a few annual layers on Dome Concordia and Kohnen station ice cores reveal a higher scatter than the analytical reproducibility (2–3.5 ppmv compared to analytical reproducibility of 1.5 ppmv).
The consistency between CH4 mixing ratios measured on different polar ice cores is much better than for CO2. the solubility is much smaller, although air dissolved in water at equilibrium contains twice as much methane as the equilibrated atmosphere. There is some evidence that at least in mid-latitude glaciers, CH4 can be enriched in the ice by a solubility effect. the production or depletion of CH4 due to chemical reactions is less probable than in the case of CO2. Reduction of organic compounds to CH4 or combustion of CH4 are high-temperature processes, requiring in most cases a catalyst. Low- temperature processes only include reactions with radicals such as OH or Cl. These radicals are unlikely to exist in polar ice. on the other hand, CH4 might be produced by bacterial activity. Bacteria are known to be present in polar ice. the analytical reproducibility of CH4 analyses (1σ scatter) is between 5 ppbv (Reference Etheridge, Steele and Langenfelds.Etheridge and others, 1998) and 10 ppbv (Reference ChappellazChappellaz and others, 1997; Reference SowersSowers and others, 1997).
N2O is almost as soluble in water as CO2. Therefore, the same strong criteria concerning melting–refreezing processes as for CO2 are valid for reliable results. There is no obvious chemical reaction which could produce N2O between impurities in the ice. the reaction of ammonium and nitrate to N2O and water is an endothermic reaction. Whether small amounts of N2O can be produced under special circumstances (catalysis) by this reaction is not known. on the other hand, N2O can be produced by bacterial activity in the ice (Reference SowersSowers, 2001). the mean analytical reproducibility (1σ scatter) of the data presented is between 2 ppbv (Reference Machida, Nakazawa, Fujii and AokiMachida and others, 1995) and 4 ppbv (Reference FlückigerFlückiger and others, 1999).
The Last Millennium
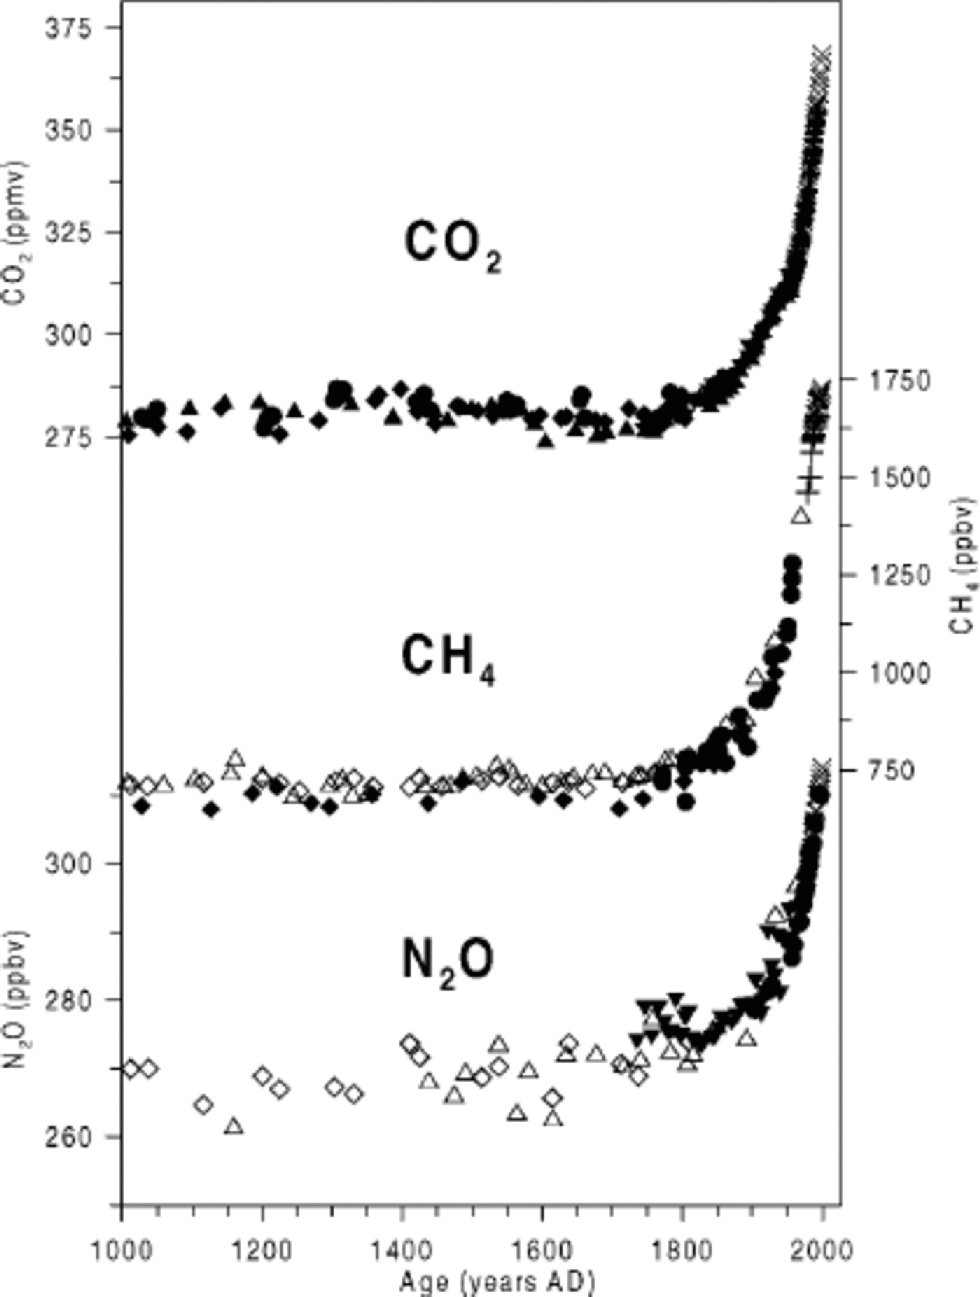
The general trend of the atmospheric concentration of the three greenhouse gases reconstructed based on ice-core analyses gives a consistent picture of an almost constant level during the last millennium, terminated by the dramatic anthropogenic increase during about the last 250 years. the records using the results published by the Intergovernmental Panel on Climate Change (Reference Prather, Ehalt and HoughtonPrather and others, 2001; Reference Prentice and HoughtonPrentice and others, 2001) and additional measurements of the three components are shown in Figure 1.
Evolution of the three greenhouse gases CO2, CH4 and N2O during the last millennium. Top: CO2record. ▴, Law Dome (Reference Etheridge, Steele, Langenfelds, Francey and Morgan.Etheridge and others, 1996); ♦, D47 and D57 (Barnola, 1995, No. 153); •, South Pole (Reference SiegenthalerSiegenthaler and others, 1988); +, Law Dome firn (Reference Etheridge, Steele, Langenfelds, Francey and Morgan.Etheridge and others, 1996); ×, Mauna Loa (Hawaii) atmospheric measurements (http://cdiac.esd.ornl.gov/trends/trends.htm). Middle: CH4 record (filled symbols: Antarctica; open symbols: Greenland). ♦, D47 and D57 (Reference ChappellazChappellaz and others, 1997); ◊, Greenland Icecore Project (GRIP) (Reference Dällenbach, Blunier, Stauffer, Chappellaz and RaynaudDällenbach and others, 2000), and new measurements); ▵, (Reference BlunierBlunier and others, 1993, and new measurements); •, Siple (Reference Stauffer, Fischer, Neftel and OeschgerStauffer and others, 1985); +, Law Dome firn (Reference Etheridge, Steele and Langenfelds.Etheridge and others, 1998);×, atmospheric measurements from Cape Grim, Tasmania (Reference PrinnPrinn and others, 2000). Bottom: N2O record (filled symbols: Antarctica; open symbols: Greenland). •, South Pole firn (Reference BattleBattle and others, 1996); ▾, H15 (Reference Machida, Nakazawa, Fujii and AokiMachida and others, 1995); ◊, GRIP (Reference FlückigerFlückiger and others, 1999); ▵, EUROCORE (Reference FlückigerFlückiger and others, 1999).
high accumulation at Law Dome. However, this is a single record from one drilling site and awaits confirmation from other ice cores. It can be compared with older records from less suited Antarctic drill sites with smaller annual accumulation rates. In order to compare the Law Dome record with other results with a higher uncertainty and a larger age distribution of individual measurements, we used a spline with a cut-off time of 200 years to the Law Dome results and results from D47 (67˚23’ S, 138˚43’ E; Ta = –25.8˚C, a = 290mm ice a–1), D57 (68˚11’S,137˚33’ E; Ta =–32˚C, a =190mm ice a–1) (Reference Barnola, Anklin, Raynaud, Schwander and StaufferBarnola and others, 1995) and South Pole (90˚S; Ta = –51˚C, a = 90 mmice a–1) (Reference SiegenthalerSiegenthaler and others, 1988). Both records show variations in the order of 5–10 ppmv, which are significant for both datasets. However, the time evolutions of the two smoothed records do not agree. New, very detailed measurements along well-suited ice cores are needed to verify and improve the record from Reference Etheridge, Steele, Langenfelds, Francey and Morgan.Etheridge and others (1996).
CO2and CH4results covering the first 800 years of the last millennium. (a) CO2results from Antarctic ice cores. •, Law Dome (Reference Etheridge, Steele, Langenfelds, Francey and Morgan.Etheridge and others, 1996); ×, D47 (Reference Barnola, Anklin, Raynaud, Schwander and StaufferBarnola and others, 1995); +, D57 (Reference Barnola, Anklin, Raynaud, Schwander and StaufferBarnola and others, 1995); ▽, South Pole (Reference SiegenthalerSiegenthaler and others, 1988). Solid line: spline through all results from D47, D57 and South Pole; dashed line: spline through all results from Law Dome; both with a cut-off period of 200 years (Reference EntingEnting, 1987). (b) CH4results from Antarctic and Greenland ice cores. •, Law Dome (Reference Etheridge, Steele and Langenfelds.Etheridge and others, 1998); □, EUROCORE (Reference Etheridge, Steele and Langenfelds.Etheridge and others, 1998); ○, EUROCORE (Reference BlunierBlunier and others, 1993); ▵, new published and unpublished results from EUROCORE and GRIP ice core. the solid lines are spline fits through all individual results from GRIP and EURO-CORE (upper) and through the results from Law Dome (lower) with a cut-off period of 200 years.
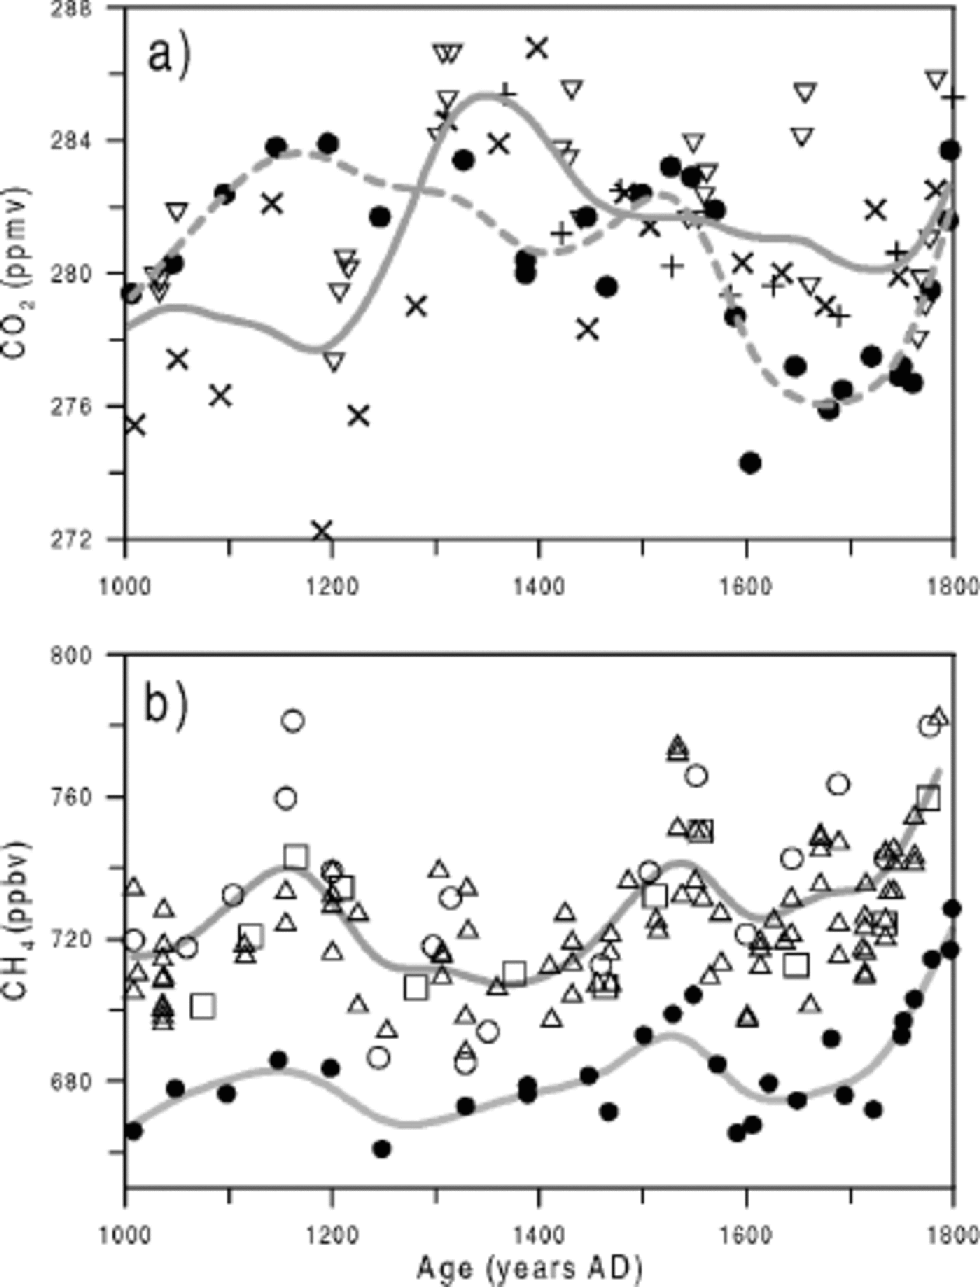
There are several CH4 records from various ice cores covering substantial parts of the last millennium (Reference BlunierBlunier and others, 1993; Reference Nakazawa, Machida, Tanaka, Aoki and WatanabeNakazawa and others, 1993; Reference Etheridge, Steele and Langenfelds.Etheridge and others, 1998). Two records show detailed short-term variations. the first eight centuries of these two records from Reference BlunierBlunier and others (1993) and Reference Etheridge, Steele and Langenfelds.Etheridge and others (1998) are shown in Figure 2b. Reference BlunierBlunier and others’ (1993) record is from the EUROCORE drilled at Summit, Greenland (72˚34’N, 37˚37’W; Ta = –32˚C, a = 230 mm ice a–1), Reference Etheridge, Steele and Langenfelds.Etheridge and others’ (1998) record is from the Law Dome ice core. Reference BlunierBlunier and others (1993) give a reproducibility of about 18 ppbv for the samples measured in Grenoble, France, and about 14 ppbv for the ones measured in Bern, Switzerland (1σ). the original results from Bern were obtained by a dry-extraction method. Based on a later calibration, they all had to be corrected to 30 ppbv lower values, which is done in Figure 2b. the triangles represent new unpublished data from the EUROCORE, and the squares published and new results from the GRIP ice core from Summit. the new EUROCORE and GRIP results have an uncertainty of 10 ppbv (1σ). Reference Etheridge, Steele and Langenfelds.Etheridge and others (1998) give a reproducibility of 5 ppbv (1σ). Because CH4 sources are concentrated in the Northern Hemisphere and the CH4 residence time in the atmosphere is only ten times longer than the interhemispheric exchange time, there is already in pre-industrial times a substantial concentration difference between the two hemispheres. This was estimated by Reference ChappellazChappellaz and others (1997) to be on average 35±7 ppbv over the pre-industrial part of the last millennium, while Reference Etheridge, Steele and Langenfelds.Etheridge and others (1998) give a difference varying between 24 and 58±10 ppbv. A salient feature of Reference BlunierBlunier and others’ (1993) record is a maximum around 1150 AD. This maximum is confirmed by Etheridge and others (1998) but with a smaller amplitude. New measurements performed in Bern (1σ accuracy 10 ppbv) on ice cores from Summit confirm an attenuated maximum. Reference BlunierBlunier and others’ (1993) record shows a minimum around 1350, and already increasing values around 1500, long before the end of the Little Ice Age, while Reference Etheridge, Steele and Langenfelds.Etheridge and others (1998) claim that their results reflect the Little Ice Age quite well. However, if we apply the same spline fitting through the latter’s results and all available results from Summit (results from Reference BlunierBlunier and others (1993) and Reference ChappellazChappellaz and others, (1997) and new unpublished results), two almost parallel smoothed records are obtained. Based on the two records from two different ice cores showing synchronous variations with similar amplitudes, we conclude that these variations very likely represent variations of the atmospheric CH4 mixing ratio.
Figure 2a shows CO2 results for the first eight centuries of the last millennium. the most recent and most reliable record has been obtained from samples from Law Dome, Antarctica (Dome Summit South: 66˚46’ S, 112˚48’ E; Ta = –22˚C, a = 650 mmice a–1) (Reference Etheridge, Steele, Langenfelds, Francey and Morgan.Etheridge and others, 1996). the reproducibility of these CO2 results is 1.2 ppmv, and the individual results represent a small time interval due to the
For N2O there are only two records covering with a small scatter substantial parts of the last millennium. Figure 1 shows the records of Reference Machida, Nakazawa, Fujii and AokiMachida and others (1995) and Reference FlückigerFlückiger and others (1999). the comparison with new measurements from Dome Concordia, Antarctica, is discussed by Reference FlückigerFlückiger and others (2002). With the available records no significant concentration variations are observed during the first seven centuries. to obtain the same accuracy and reliability for the N2O record as for CO2 and CH4 the analytical precision must be improved, and higher-resolution records from different ice cores are needed to interpret possible short-term variations.
The Holocene
Records of the three greenhouse gases covering the entire Holocene are shown in Figure 3. There are two CO2 records from Taylor Dome, Antarctica (diagonal crosses) (77˚48’ S, 158˚43’ E; Ta =–42˚C, a =70mm ice a–1) (Reference IndermühleIndermühle and others, 1999) and from Dome Concordia (open triangles) (75˚06’ S, 158˚43’ E; Ta = –54˚C, a = 27mm ice a–1) (Reference FlückigerFlückiger and others, 2002), both plotted on their original published time-scales. the two CH4 records, one from Summit (diagonal crosses) (Reference Blunier, Chappellaz, Stauffer and RaynaudBlunier and others, 1995; Reference ChappellazChappellaz and others, 1997), the other from Dome Concordia (open triangles) (Flückiger and others, 2001), and a first N2O record covering the Holocene from Dome Concordia (Reference FlückigerFlückiger and others, 2002) are also plotted on the original unmatched time-scales.
CO2, CH4 and N2O records covering the Holocene (11 000–250 years BP). Top: CO2 concentration. ×, Taylor Dome (Reference IndermühleIndermühle and others, 1999); ▵, Dome Concordia (Reference FlückigerFlückiger and others, 2002). Middle: CH4 concentration in Greenland and Antarctica. ×, GRIP (Reference ChappellazChappellaz and others, 1997); ▵, Dome Concordia (Reference FlückigerFlückiger and others, 2002). Bottom: N2O concentration measured on samples from Dome Concordia (Reference FlückigerFlückiger and others, 2002). the grey solid line is a spline through all N2O results with a cut-off period of 3000 years.
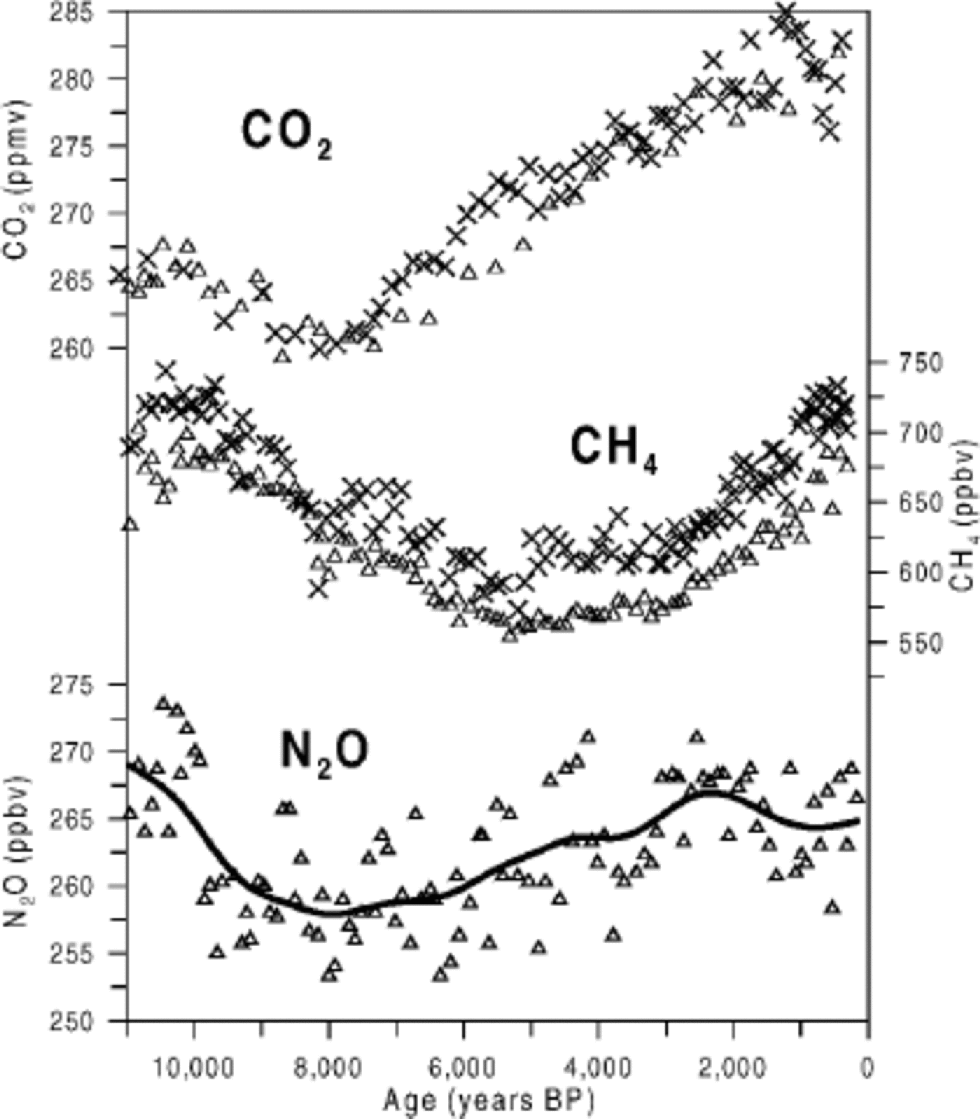
The two CO2 records agree in general, but there are significant differences in the time window 7500–5000 years BP. There are two possibile explanations for these differences, which are far above experimental uncertainties. Either one of the ice cores is affected by an artefact that changes the CO2 concentration in the bubbles of the ice, or the two age scales deviate substantially from each other. A production of CO2 in Antarctic ice corresponding to a concentration increase of 5 ppmv cannot be excluded in principle. the time period during which the difference occurs coincides with the climatic optimum (about 6000 years BP). However, even at the lower location, at Taylor Dome, the mean annual temperature is –42˚C at present, so summer melting can be excluded for the climatic optimum. Further, if chemical reactions between impurities were responsible for a CO2 enhancement, we would expect large differences between neighbouring samples. Each result shown in Figure 3 is the mean value of six measurements (mean 1σ scatter ±1.5 ppmv) over a core segment of about 0.1m depth. We have not observed any larger scatter of the individual measurements in the corresponding depth interval either in the Dome Concordia or in the Taylor Dome ice core. to explain the observed differences by a discrepancy of the age scales would imply shifting one of the scales by as much as 1500 years. It seems unlikely that an estimated time-scale could deviate in the Holocene to this extent. However, we constructed a time-scale matching the two CO2 records as well as possible and plotted the two CH4 records fromTaylor Dome (Reference Brook and HarderBrook and others, 2000) and Dome Concordia on this time-scale, matched with CO2, and found that the two records still fit quite well with each other over this period in which fast CH4 variations are missing. We conclude that the differences between the two CO2 records are more likely to be due to deviations of the time-scales. However, we cannot exclude that the differences are caused by an artefact in one or both records, especially since differences of a similar magnitude are observed around 2000 years BP which cannot be explained by a deviation of the two time-scales.
The general trends of the GRIP and Dome Concordia CH4 records are in good agreement. They confirm the previous estimate of the interhemispheric difference of 33– 50 ppbv (with an average over the Holocene of 44±7 ppbv) (Reference ChappellazChappellaz and others, 1997).With the depth resolution of the two records, it will even be possible to reconstruct a continuous record of the interhemispheric CH4 concentration difference for the Holocene. A very exciting feature in the Greenland CH4 record is the narrow but distinct minimum at about 8200 years BP. We have not found any firm indication of this event in the Dome Concordia ice core. However, the detailed results concerning the 8200 year event will be discussed in another paper.
The N2O record from Dome Concordia, shown in Figure 3, is the first covering the Holocene (Reference FlückigerFlückiger and others, 2002). Samples from 110 different depth levels were measured. the scatter of the measurements is slightly higher than the analytical uncertainty on single measurements, and the question arises to what extent observed variations of the trend represent actual variations of the atmospheric N2O concentration. Given the absence of any correlation of impurities in the ice with changes observed in the N2O record, it was concluded that the smoothed record shown in Figure 3 very likely represents the atmospheric N2O concentration. However, the record is less reliable than those of CO2 and CH4 until it is verified by measurements along other ice cores.
Last-Glacial to Holocene Transition
The transition from the last glacial epoch to the Holocene, with the large global temperature increase accompanied by an increase in atmospheric greenhouse-gas concentrations, is a key epoch for the understanding of mechanisms of global climatic change. Analyses along the new Dome Concordia ice core allowed reconstruction of the increase of the CO2 concentration with an excellent time resolution and a small scatter (Reference MonninMonnin and others, 2001). the results agree well with earlier measurements on Antarctic ice cores within the error limits (Reference Fischer, Smith, Mastroianni and DeckFischer and others, 1999). However, a serious problem is the age scale. If we compare the Dome Concordia CH4 record (time-scale EDC1 (Reference Schwander, Jouzel, Hammer, Petit, Udisti and WolffSchwander and others, 2001)) with the GRIP CH4 record (time-scale SS09 (Reference Schwander, Barnola, Blunier and FuchsSchwander and others, 1997)) we observe, for example, for the transition from the Younger Dryas to the Holocene an age difference of 500 years, which makes any comparisons difficult. Therefore, we matched the two time-scales using the two CH4 records, assuming that fast CH4 variations occur simultaneously in both hemispheres due to the fast atmospheric mixing time of CH4, and refer all results to the GRIP time-scale. the records of the three greenhouse gases are shown in Figure 4 together with the δD (Reference JouzelJouzel and others, 2001) and δ18O (Reference DansgaardDansgaard and others, 1993) records of Dome Concordia and GRIP, respectively, which are proxies for the local temperature. for the age scale of the two isotope records measured on ice, additional uncertainties concerning the age difference (200–500years) between ice and enclosed air must be taken into account.
Evolution of CO,CH4 and N2O concentration during the transition from the last glacial epoch to the Holocene. Top: proxies for local temperature. Black line: δD record from Dome Concordia (Reference JouzelJouzel and others, 2001); grey line: δ18O record from GRIP (Reference DansgaardDansgaard and others, 1993). Upper middle: CO2 concentration along Dome Concordia ice core (×) (Reference MonninMonnin and others, 2001). Lower middle: CH4 concentration along the Dome Concordia ice core (◊). Bottom: N2O concentration along the Dome Concordia ice core (▵) and N2O concentrations along the GRIP ice core (+) (Reference FlückigerFlückiger and others, 1999). Values older than 14 500 years BP deviate from each other. We assume that the Dome Concordia values are affected by an artefact.
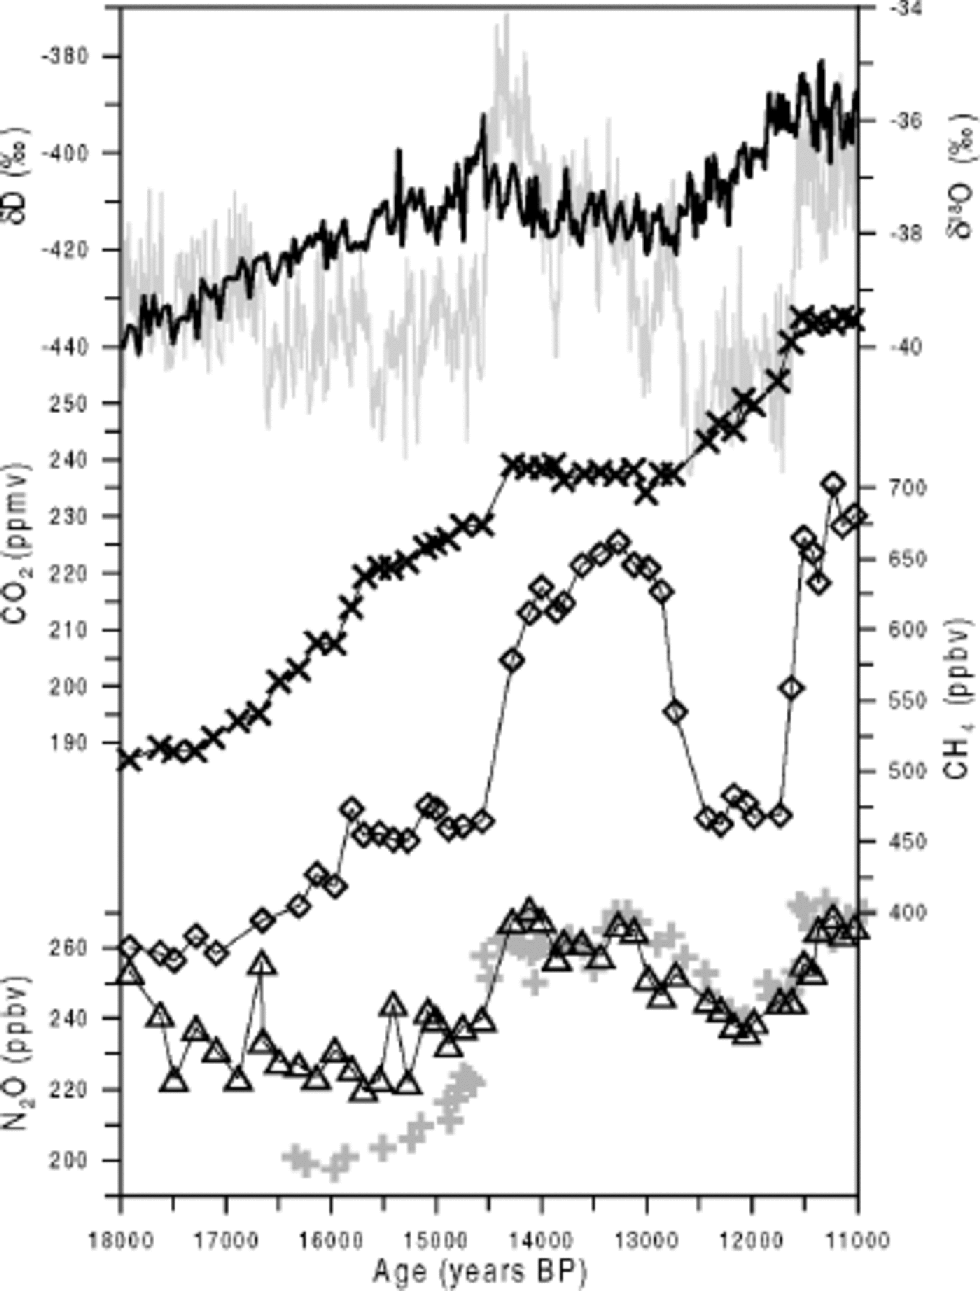
The CO2 record from Dome Concordia shows that the beginning of the increase is approximately synchronous or only a few hundred years delayed compared to the temperature increase measured along the same core. the general trend follows rather closely the temperature increase in Antarctica and thus supports the idea that the Southern Ocean was an important factor controlling atmospheric CO2 concentration during the transition. However, very fast small increases are observed at the beginning of the Bølling/ Allerød warm period and the Preboreal, events which are typical for the Northern Hemisphere. This suggests that processes connected to these events, possibly changes of the deep water formation, also have a significant influence on atmospheric CO2 concentration.
The CH4 record confirms records measured on other ice cores. Since the presented CO2 and CH4 data have been measured on the same ice core, the two records can be compared without any assumption about age scales or age differences between ice and enclosed air. the distinct concentration changes of the methane allow us, on the other hand, to synchronize the records precisely with age scales from other ice cores (as used here to match the GRIP and the Dome Concordia time-scales).
The N2O record from Dome Concordia is compared with a record from the GRIP ice core (Reference FlückigerFlückiger and others, 1999). the values agree quite well in the period 14 500– 11000 years BP, but deviate substantially before that. In the GRIP ice core, sporadic elevated values have been observed during the glacial epoch, mainly in depth intervals with elevated dust concentrations, corresponding to the beginning or even the first part of Dansgaard/Oeschger events. In the Dome Concordia ice core, the elevated, highly scattered values in the late glacial epoch are more general. Similar high values connected with a large scatter have also been found in the Vostok ice core in the time period preceding the penultimate deglaciation (Reference SowersSowers, 2001). At present we have no explanation for the elevated values. An important task will be to investigate the mechanisms which produce N2O in the ice.
The Second Part of the Last Glacial Epoch
The second part of the last glacial epoch (<60 000 years BP) is characterized by drastic and fast temperature 2 changes in the Northern Hemisphere, documented in the Dansgaard/ Oeschger events recorded in the Greenland ice cores. the Antarctic records show fewer and much less pronounced temperature variations. It was a big surprise when results from the Dye 3 ice core suggested that the atmospheric CO2 concentration varied parallel to Dansgaard/Oeschger events with amplitudes of about 50 ppmv (Reference Stauffer, Oeschger and SiegenthalerStauffer and others, 1984). Later results measured along the ice core from Byrd station did not confirm variations of this order and created a serious problem (Reference Oeschger, Neftel, Staffelbach and StaufferOeschger and others, 1988). the dilemma could only be solved after it became possible to synchronize the age scale of enclosed air between Greenland and Antarctic ice cores with CH4 variations (Reference StaufferStauffer and others, 1998). the large variations measured in Greenland ice cores are an artefact, caused most probably by production of CO2 by chemical reactions between impurities in the ice (Reference SmithSmith and others, 1997). on the other hand, the synchronized Byrd record suggested that the atmospheric CO2 concentration showed smaller variations which seem to be related, but not parallel, to the largest and longest Dansgaard/Oeschger events. Measurements along the Taylor Dome ice core, which are more precise and show a lower scatter, confirm this assumption (Reference Indermühle, Monnin, Stocker and WahlenIndermühle, 2000). In Figure 5, the Taylor Dome CO2 record is shown together with the CO2 record from Dome Concordia for ages younger than 22000 years, as presented already in Figures 3 and 4. the record is shown together with the GRIP and part of the Byrd δ18O record (Reference Johnsen and LangwayJohnsen and others, 1972; Reference DansgaardDansgaard and others, 1993). the GRIP δ18O record was added to show the obvious relation with the broadest Dansgaard/Oeschger events and the CO2 variations. Based on the comparison of the Taylor Dome CO2 record with the Vostok stable-isotope record, it was concluded that the CO2 maxima are synchronous with the Antarctic warming events A1–A4 (Reference Indermühle, Monnin, Stocker and WahlenIndermühle and others, 2000) which are leading the Dansgaard/Oeschger events 8, 12, 14 and 17 in the Northern Hemisphere (Reference BlunierBlunier and others, 1998).
CO2and CH4records over the last 60 000 years together with an Antarctic and a Greenland δ18O record as a proxy for the local temperature. All records are plotted on the GRIP SS09 age scale (Reference DansgaardDansgaard and others, 1993). Synchronization has been performed by matching of CH4records (Reference Blunier and Brook.Blunierand Brook, 2001). Top: black line (left scale): GRIP δ18O record (black numbers indicate Dansgaard/Oeschger events) (Reference DansgaardDansgaard and others, 1993); grey line (right scale): Byrd δ18O record until 20 000 years BP (transition would be out of range with the given scale). Marked are the Antarctic warming events A1–A4. Middle: CO2record.+, values from Taylor Dome (Reference Indermühle, Monnin, Stocker and WahlenIndermühle and others, 2000);6, results from Dome Concordia (Reference FlückigerFlückiger and others, 2002; Reference MonninMonnin and others, 2001). Bottom: Comparison of Antarctic (filled symbols) and Greenland (open symbols) CH4 concentrations. ◊, GRIP (Reference Dällenbach, Blunier, Stauffer, Chappellaz and RaynaudDällenbach and others, 2000); □, GISP2 (Reference Brook, Sowers and OrchardoBrook and others, 1996); ♦, Dome Concordia (Reference FlückigerFlückiger and others, 2002; Reference MonninMonnin and others, 2001); •, Byrd Station (Reference BlunierBlunier and others, 1998).
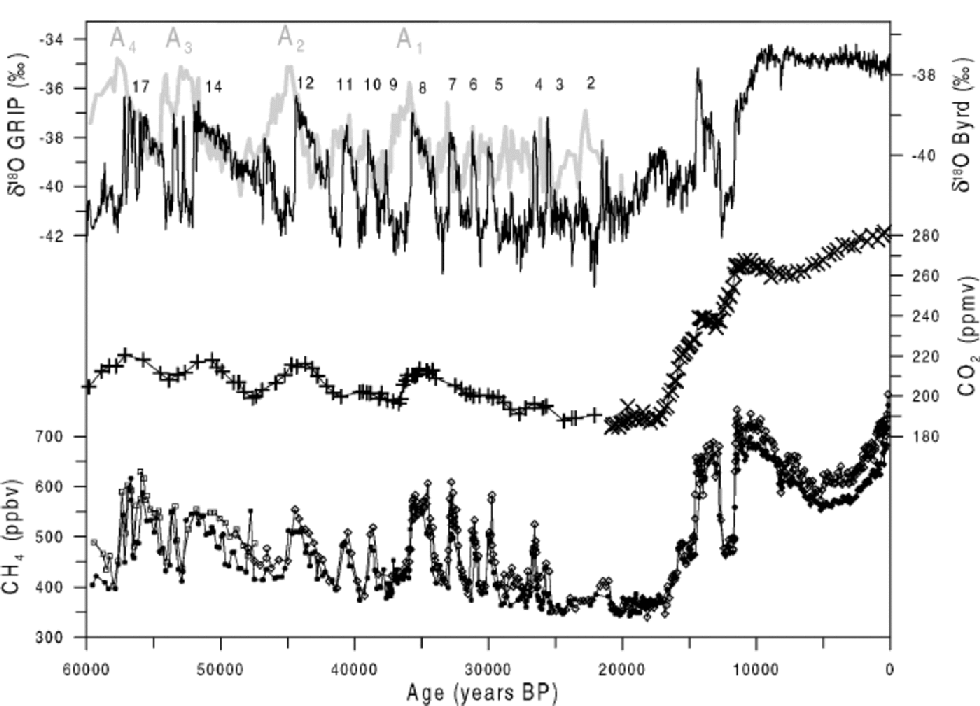
Figure 5 (lowest part) shows a composite CH4 record. the last 11000 years are a repetition of Figure 3; the transition shows the Dome Concordia record from Figure 4 together with GRIP CH4 results (Reference ChappellazChappellaz and others, 1997). the Antarctic data from 60 000 to 18 000 years BP are from Byrd; the Greenland data are a composite of Greenland Ice Sheet Project 2 (GISP2) (60 000–47000 years BP) and GRIP (47000–18 000 years BP). We consider the composite record a quite reliable reconstruction of the atmospheric CH4 concentration over the past 60 000 years. Based on these records, we conclude that it is easier to determine Northern Hemisphere–Southern Hemisphere concentration differences for the Holocene than for the last glacial epoch. the estimates from Reference Dällenbach, Blunier, Stauffer, Chappellaz and RaynaudDällenbach and others (2000) for the last glacial epoch are still a best estimate, but they must be considered tentative, and more measurements with a higher depth resolution and possibly higher accuracy are needed.
N2O has only been measured over Dansgaard/Oeschger event 8, where it clearly shows an increase from <210 ppbv to >250 ppbv before decreasing again to <210 ppbv. the general pattern of the N2O record during this event is similar to that of CH4 (Reference FlückigerFlückiger and others, 1999), but no continuous record over the entire second part of the last glacial epoch is yet available.
Conclusions
The records presented in Figure 5 are considered a very likely reconstruction of the evolution of the atmospheric CO2 and CH4 concentration during the pre-industrial part of the past 60 000 years.
We consider variations of the CO2 concentration during the last glacial epoch simultaneous with warming events in Antarctica, the detailed evolution of the CO2 concentration during the transition and the general behaviour during the Holocene to be very likely. the increase of the atmospheric CO2 concentration during the past 250 years is a fact, but small short-term variations found in the first 750 years of the last millennium need to be verified.
The agreement of various CH4 records shows that long-and short-term variations very likely represent the evolution of the atmospheric CH4 concentration over the past 60 000 years. the precision is good enough to reconstruct reliable concentration differences between the Northern and Southern Hemispheres for the Holocene (Reference ChappellazChappellaz and others, 1997) and for cold and milder parts of the last glacial epoch in general (Reference Dällenbach, Blunier, Stauffer, Chappellaz and RaynaudDällenbach and others, 2000). Whether the precision is good enough to reconstruct the inter-hemispheric difference also for single short climatic events (e.g. Dansgaard/Oeschger events) needs to be examined.
The reconstruction of the N2O concentration is still in a start-up phase. the increase of the atmospheric concentration during the transition from the last glacial epoch to the Holocene and during the past 250 years is based on results from various records and can be considered very likely. the concentration change parallel to Dansgaard/Oeschger event 8 and the transition has been found in both an Antarctic and a Greenland ice core and is considered to present very probably a variation of the atmospheric N2O concentration. There is good evidence that the record of the N2O concentration during the Holocene as shown in Figure 3 represents the atmospheric N2O concentration, but this finding needs to be confirmed by measurements along other ice cores.
Acknowledgements
This work was supported by the Swiss National Science Foundation, the University of Bern, the Bundesamt für Energie and the Bundesamt für Bildung undWissenschaft.



