


Introduction
One way to manipulate electromagnetic waves is to use engineered electromagnetic materials which are able to make specific changes in wave properties when an incident wave passes through them. In prior researches, several applications were extracted from ideal metamaterials [Reference Caloz and Itoh1]. Afterward, latter researchers attempted to realize these materials by artificial periodic volume and surface structures (metasurfaces) [Reference Marqués, Martin and Sorolla2]. The absorbers based on metamaterials are widely used in microwave frequencies. Several creativities in unit-cell design and their placements are employed in previous works. These creativities are led by engineers to design dual-band [Reference Li, Yang, Hou, Tian and Hou3], triple-band [Reference Bhattacharyya and Srivastava4–Reference Shen, Cui, Zhao, Ma, Jiang and Li6], and quad-band structures [Reference Bhattacharyya, Ghosh and Srivastava7, Reference Park, Tuong, Rhee, Kim, Jang, Choi, Chen and Lee8]. In [Reference Bhattacharyya and Srivastava4], a complex unit-cell design which is combined of two well-known designs is introduced. These unit cells are electrically connected together. This complex unit cell has three resonant frequencies which yield in triple-band microwave absorber. In [Reference Shen, Cui, Zhao, Ma, Jiang and Li6], three square loops inside each other which are printed at both sides of the substrate are presented. This method makes three resonant frequencies which result in triple-band microwave absorber. In [Reference Bhattacharyya, Ghosh and Srivastava7], a hybrid unit cell which is combined with four different sub cells is presented and makes a quad-band structure. In this design, the designer creates a wider band width in X-band by approaching third and fourth resonant frequencies near together. In [Reference Park, Tuong, Rhee, Kim, Jang, Choi, Chen and Lee8], researchers create a triple-band structure by three circle loops with different radii and by utilizing two loops in together, a quad-band absorber is presented. Metasurfaces are widely used in spatial filtering, shielding [Reference Fallah and Vadjed-Samiei9, Reference Zanganeh, Fallah, Abdolali and Komjani10], superstrates [Reference Rajabalipanah, Fallah and Abdolali11], and reflect array antennas [Reference Nasrollahi, Fallah, Nazeri and Abdolali12]. In the field of metasurfaces for polarization conversion, several designs, such as circular split-ring [Reference Bhattacharyya, Ghosh and Srivastava13], anchor-shaped [Reference Yin, Wan, Zhang and Cui14], coupled split-ring resonators [Reference Khan, Fraz and Tahir15], double-head arrow [Reference Chen, Wang, Ma, Qu, Xu, Zhang, Yan and Li16], twisted complementary split-ring resonators [Reference Wei, Cao, Fan, Yu and Li17], are suggested which all have unique features depending on their specific applications. Some researchers have tried to model metasurfaces as an ideal impedance surface which adds new capabilities for controlling electromagnetic waves [Reference Maleknejad, Abdolali and Fallah18].
In our proposed paper, by placing the ideal impedance surfaces on the side walls of a rectangular waveguide, an efficient slot array antenna without slots off-set is presented. Circular frequency-selective surfaces are used as the impedance surfaces. In this case, we will be able to exploit the features of linear array antennas.
Analytical relations for a rectangular waveguide with impedance surfaces
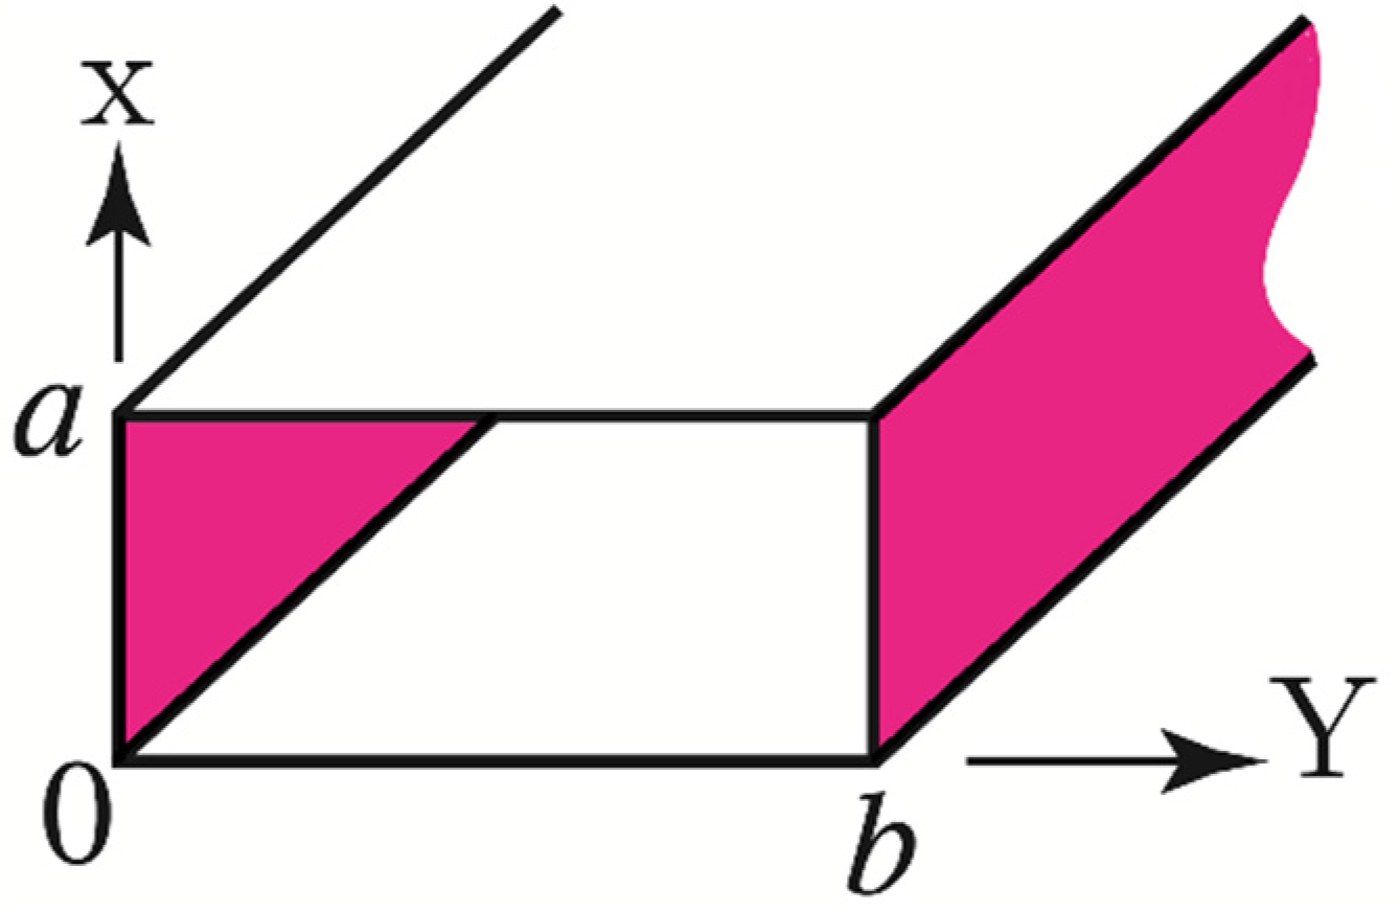
A rectangular waveguide is considered with propagation along the z-axis (Fig. 1). The wall (y = 0, b) boundary condition is anisotropic impedance shown as below, and the other sides are Perfect Electric conductor (PEC) [Reference Gok and Grbic19]:
 $$\eqalign{y =\ & b\to \; \vec{E} = \bar{\bar{Z}}\cdot \hat{n} \times \vec{H} \cr \Rightarrow &\left[ {\matrix{ {E_x} \hfill \cr {E_z} \hfill \cr}} \right] = \left[ {\matrix{ {Z_{xz}^r} \hfill & {Z_{xx}^r} \hfill \cr {Z_{zz}^r} \hfill & {Z_{zx}^r} \hfill \cr}} \right]\left[ {\matrix{ {-H_z} \hfill \cr {H_x} \hfill \cr}} \right].} $$
For the right wall in which  $\hat{n} = -\hat{y}$:
 $$\eqalign{y =\ &0\to \; \vec{E} = \bar{\bar{Z}}\cdot \hat{n} \times \vec{H} \cr \Rightarrow &\left[ {\matrix{ {E_x} \hfill \cr {E_z} \hfill \cr}} \right] = \left[ {\matrix{ {Z_{xz}^l} \hfill & {Z_{xx}^l} \hfill \cr {Z_{zz}^l} \hfill & {Z_{zx}^l} \hfill \cr}} \right]\left[ {\matrix{ {H_z} \hfill \cr {-H_x} \hfill \cr}} \right].} $$
In [Reference Bhattacharyya, Ghosh and Srivastava13], some methods are introduced to realize the anisotropic impedance surfaces.
PEC rectangular waveguide possesses impedance surface at y = 0, b.
A) 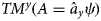 $TM^y(A = \hat{a}_y\psi )$ mode (when impedance surface is placed at y = 0, b):
 $$\psi = \lpar {A\cos \lpar {k_yy} \rpar + B\sin \lpar {k_yy} \rpar } \rpar \sin \left( {\displaystyle{{m\pi x} \over a}} \right)\exp \lpar {-jk_zz} \rpar. $$
The fields are derived as below:
 $$\eqalign{E_y = &\displaystyle{1 \over {\hat{y}}}\left( {\displaystyle{{\partial^2} \over {\partial y^2}} + k^2} \right)\psi = \displaystyle{{1\,} \over {\,j\omega \varepsilon}} \lpar {-k_y^2 + k^2} \rpar \cr &\lpar {A\cos \lpar {k_yy} \rpar + B\sin \lpar {k_yy} \rpar } \rpar \sin \left( {\displaystyle{{m\pi x} \over a}} \right)\exp \lpar {-jk_zz} \rpar \cr E_x = &\displaystyle{1 \over {\hat{y}}}\displaystyle{{\partial ^2\psi} \over {\partial x\partial y}} = \displaystyle{{k_y} \over {\,j\omega \varepsilon}} \left( {\displaystyle{{m\pi} \over a}} \right) \cr &\lpar {-A\sin \lpar {k_yy} \rpar + B\cos \lpar {k_yy} \rpar } \rpar \cos \left( {\displaystyle{{m\pi x} \over a}} \right)\exp \lpar {-jk_zz} \rpar \cr E_z = &\displaystyle{1 \over {\hat{y}}}\displaystyle{{\partial ^2\psi} \over {\partial y\partial z}} = -\displaystyle{{k_yk_z} \over {\omega \varepsilon}} \lpar {-A\sin \lpar {k_yy} \rpar + B\cos \lpar {k_yy} \rpar } \rpar \cr &\sin \left( {\displaystyle{{m\pi x} \over a}} \right)\exp \lpar {-jk_zz} \rpar \cr H_x = &-\displaystyle{{\partial \psi} \over {\partial z}} = jk_z\lpar {A\cos \lpar {k_yy} \rpar + B\sin \lpar {k_yy} \rpar } \rpar \cr &\sin \left( {\displaystyle{{m\pi x} \over a}} \right)\exp \lpar {-jk_zz} \rpar \cr H_z = &\displaystyle{{\partial \psi} \over {\partial x}} = \displaystyle{{m\pi} \over a}\lpar {A\cos \lpar {k_yy} \rpar + B\sin \lpar {k_yy} \rpar } \rpar \cr &\cos \left( {\displaystyle{{m\pi x} \over a}} \right)\exp \lpar {-jk_zz} \rpar. } $$
Eigen equation is:
 $$\left( {\displaystyle{{m\pi} \over a}} \right)^2 + k_y^2 + k_z^2 = k^2 = \omega ^2\mu \varepsilon. $$
1) of relation (1), for Z zx ≠ 0, boundary conditions are:
 $$Z_{zx}^r = \displaystyle{{E_z} \over {H_x}}\vert {_{y = b}} = -\displaystyle{{k_y} \over {\,j\omega \varepsilon}} \displaystyle{{\lpar {-A\sin \lpar {k_yb} \rpar + B\cos \lpar {k_yb} \rpar } \rpar } \over {\lpar {A\cos \lpar {k_yb} \rpar + B\sin \lpar {k_yb} \rpar } \rpar }}.$$
2) similarly, of relation (2), for Z zx ≠ 0, boundary conditions are:
 $$Z_{zx}^l = -\displaystyle{{E_z} \over {H_x}}\vert {_{y = 0}} = \displaystyle{{k_y} \over {\,j\omega \varepsilon}} \displaystyle{B \over A}.$$
Combination of equations (6) and (7) leads to (8):
 $$tg\lpar {k_yb} \rpar = j\displaystyle{{\omega \varepsilon} \over {k_y}}\displaystyle{{Z_{zx}^l + Z_{zx}^r} \over {1 + Z_{zx}^l Z_{zx}^r {\lpar {\omega \varepsilon /k_y} \rpar }^2}}.$$
Equations (5) and (8) result in a non-linear matrix of equations which has two variables, k y and k z.
By considering Z xz ≠ 0 in relation (1) and (2), equation (8) is obtained by another way, that is, Z zx is substitute by Z xz.
B)  $TE^y(F = \hat{a}_y\psi )$ mode (when impedance surface is placed at y = 0, b):
 $$\psi = \lpar {A\cos \lpar {k_yy} \rpar + B\sin \lpar {k_yy} \rpar } \rpar \cos \left( {\displaystyle{{m\pi x} \over a}} \right)\exp \lpar {-jk_zz} \rpar. $$
The fields are derived as below:
 $$\eqalign{H_y = &\displaystyle{1 \over {\hat{z}}}\left( {\displaystyle{{\partial^2} \over {\partial y^2}} + k^2} \right)\psi = \displaystyle{1 \over {\,j\omega \mu}} \lpar {-k_y^2 + k^2} \rpar \cr &\lpar {A\cos \lpar {k_yy} \rpar + B\sin \lpar {k_yy} \rpar } \rpar \cos \left( {\displaystyle{{m\pi x} \over a}} \right)\exp \lpar {-jk_zz} \rpar \cr H_x = &\displaystyle{1 \over {\hat{z}}}\displaystyle{{\partial ^2\psi} \over {\partial x\partial y}} = -\displaystyle{{k_y} \over {\,j\omega \mu}} \left( {\displaystyle{{m\pi} \over a}} \right) \cr &\lpar {-A\sin \lpar {k_yy} \rpar + B\cos \lpar {k_yy} \rpar } \rpar \sin \left( {\displaystyle{{m\pi x} \over a}} \right)\exp \lpar {-jk_zz} \rpar } $$
 $$\eqalign{H_z = &\displaystyle{1 \over {\hat{z}}}\displaystyle{{\partial ^2\psi} \over {\partial y\partial z}} = -\displaystyle{{k_yk_z} \over {\omega \mu}} \lpar {-A\sin \lpar {k_yy} \rpar + B\cos \lpar {k_yy} \rpar } \rpar \cr &\cos \left( {\displaystyle{{m\pi x} \over a}} \right)\exp \lpar {-jk_zz} \rpar \cr E_x = &\displaystyle{{\partial \psi} \over {\partial z}} = -jk_z\lpar {A\cos \lpar {k_yy} \rpar + B\sin \lpar {k_yy} \rpar } \rpar \cr &\cos \left( {\displaystyle{{m\pi x} \over a}} \right)\exp \lpar {-jk_zz} \rpar \cr E_z = &-\displaystyle{{\partial \psi} \over {\partial x}} = \displaystyle{{m\pi} \over a}\lpar {A\cos \lpar {k_yy} \rpar + B\sin \lpar {k_yy} \rpar } \rpar \cr &\sin \left( {\displaystyle{{m\pi x} \over a}} \right)\exp \lpar {-jk_zz} \rpar.} $$
The Eigen equation is the same as relation (5).
1) of relation (1), for Z zx ≠ 0, boundary conditions are:
 $$Z_{zx}^r = \displaystyle{{E_z} \over {H_x}}\vert {_{y = b}} = \displaystyle{{\,j\omega \mu} \over {k_y}}\displaystyle{{\lpar {A\cos \lpar {k_yb} \rpar + B\sin \lpar {k_yb} \rpar } \rpar } \over {\lpar {-A\sin \lpar {k_yb} \rpar + B\cos \lpar {k_yb} \rpar } \rpar }}.$$
2) similarly, of relation (2), for Z zx ≠ 0, boundary conditions are:
 $$Z_{zx}^l = -\displaystyle{{E_z} \over {H_x}}\vert {_{y = 0}} = -\displaystyle{{\,j\omega \mu} \over {k_y}}\displaystyle{A \over B}.$$
Combination of equations (11) and (12) leads to (13):
 $$tg\lpar {k_yb} \rpar = -\displaystyle{{k_y} \over {\,j\omega \mu}} \displaystyle{{Z_{zx}^l + Z_{zx}^r} \over {1 + Z_{zx}^l Z_{zx}^r {\left( {\displaystyle{{k_y} \over {\omega \mu}}} \right)}^2}}.$$
Combining equations (5) and (13) leads to a non-linear matrix of equations which has k y and k z variables. Also, for this mode, by considering Z xz ≠ 0 in relations (1) and (2), equation (13) will be obtained (Z zx is substitute by Z xz). Solving Eigen equations to extract dispersion, cut-off dependency, and wave number.
Solving Eigen equations for extracting dispersion data
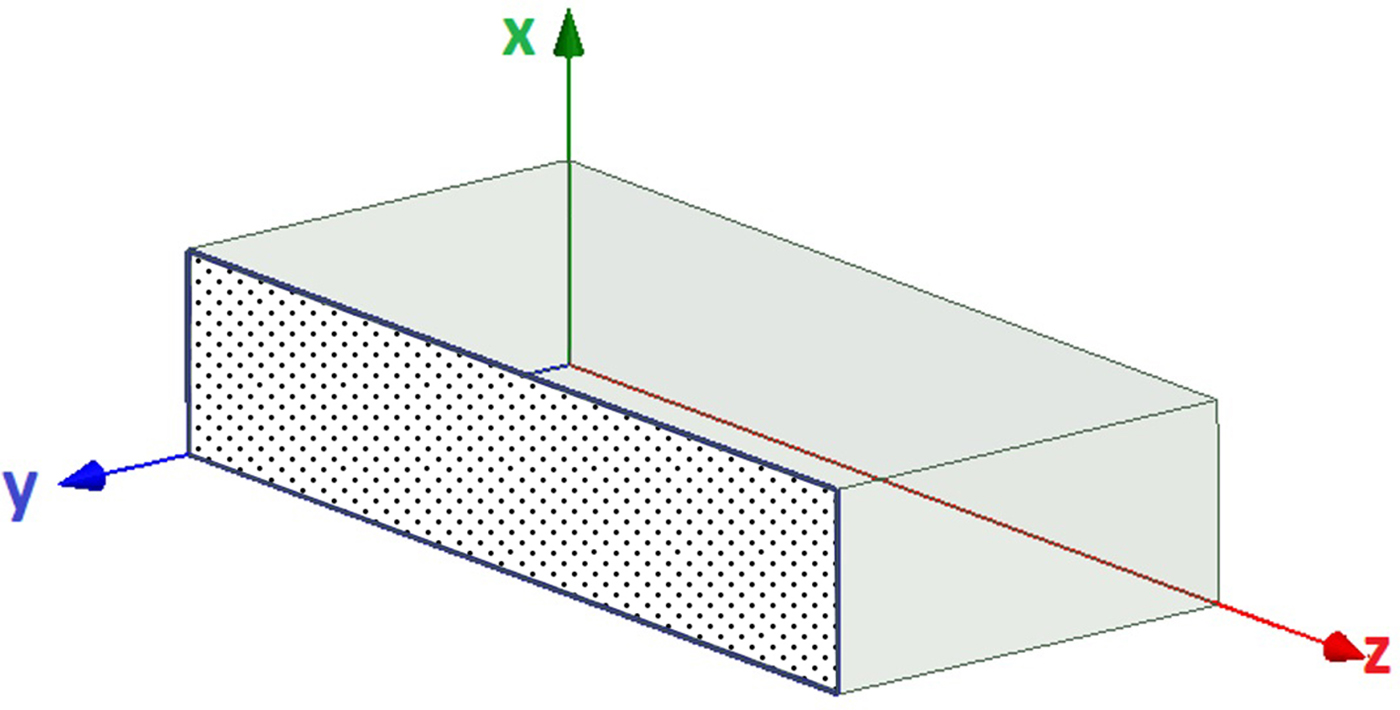
To obtain the dispersion data, Eigen equation and eigenvalue must be solved for each frequency. Then each k z will be determined accordingly. Thereafter, by connecting the sparse points of each mode, the dispersion carve will be obtained. We assume a standard WR90 waveguide (a = 22.86 mm, b = 10.16 mm), as it is shown in Fig. 2. It contains Z s = −j5000 in y = b plane. For TM y and TE y modes, by changing frequencies from 8 to 20 GHz, relations (5) and (13) are solved for each frequency in MATLAB software by employing the f-solve function. The f-solve function is used for solving non-linear equations in MATLAB software. It also needs an initial point for getting the correct solution. In Fig. 3, the initial value for k z is changed for each frequency in order to solve equation TE y mode and m = 0. As it is remarkable, the obtained k z value is totally depended on the initial point of k z. Even for some initial points, the obtained k z is negative. The sudden changes show the gaps between each different mode and also unacceptable points which must be separated. The important point is that for plotting the dispersion curve of each mode, we must extract the desirable curve of k z for each mode by changing the frequency. If we try to define an initial point to solve the equation for each mode, we must be capable to find certain overlapped intervals for each mode after eliminating unacceptable and undesirable solutions. In this way, unwanted sudden changes are removed. By putting different numbers into the equation, the equation variables decrease to the one (only k z remains undefined). By defining k z(initial) = 50, 100 and 200, k z solutions are plotted in Fig. 4. Figure 4 is obtained for m = 0.
Rectangular waveguide with an impedance wall Z s = −j5000 on y = b.
Solution value of non-linear equation in terms of k z(initial) for some specific frequencies in TE y and m = 0.

Dispersion value for m = 0, different initial k z for TE y mode.

As it is observable, for identical initial k z, obtained solutions for k z are not unique. Besides, some unacceptable solutions must be identified and eliminated by employing appropriate identification algorithms. Besides, many initial points lead to no answer. Thus this issue should be considered in our algorithms. Sudden changes in different mode gaps and un-physical solution like imaginary and order of 108 solutions are not observable in Figs 3 and 4. In Fig. 5, the initial k z receives five switching steps from 1 to 1000 for each frequency. The results are plotted in the following. The negative, imaginary, and the solution of k z higher than 1000 are removed. The frequency step is 0.2 GHz. As it is evident, there are some unacceptable points near the horizontal axis. Looking at the following figure meticulously, different mode curves are recognizable from several existing sudden changes. In this algorithm for each different frequency, the amount of k z is changed from 10 to 1000 with the step of 10.
kz_initial=10:10:1000;
Considering k z(n) as the obtained solutions matrix of the non-linear equation, all the solutions must be checked to be eligible (positive and real). Then we save them in the first stage.
if (Real(kz(n))>0) & (Imag(kz(n))<1e-4) & (kz(n)<1000)
……
end
Due to the errors in numerical methods calculation, it is acceptable for the non-linear equation results to contain small imaginary parts. Thus, in order to obtain an eligible solution, we investigate that the imaginary part of the solution to be less than a given error threshold. In this research, this amount is considered 1e-4. By sorting the obtained solutions from large-to-small values, for each frequency, the first solution for each frequency (max (k z(n))) is the k z for the first mode.
kz=1.0e+02 *[
3.279949592359039
3.279949599052935
3.279949598973027
3.279949598535717
…
(77 times replication of the solution)
…
3.279949591542318
3.279949592944308
2.627826015590098
2.627826016784810
…
(243 times replication of the solution)
…
2.627826016784586
2.627826016784570
0.125000000000000
0.120000000000000
…
0.015000000000000
0.010000000000000];
The dispersion curves from Matlab simulation in m = 0.
The maximum size of k z for the first propagation mode and frequency 16 GHz is 327.99, and it is repeated till the 77th response. However, the 77th digit of all these roots is different from each other, which is due to the error of the numerical method. Also, it should be noticed that the decimal digit of the solution, for a specific mode, is altered due to the numerical method errors. Thus we need to assume an appropriate error threshold. The next solutions, which have a significant difference with the largest solution, if they are not involved in physically unacceptable solutions category, can be considered as the next mode solution. The comparisons should be carried out by establishing accurate and appropriate limitations.
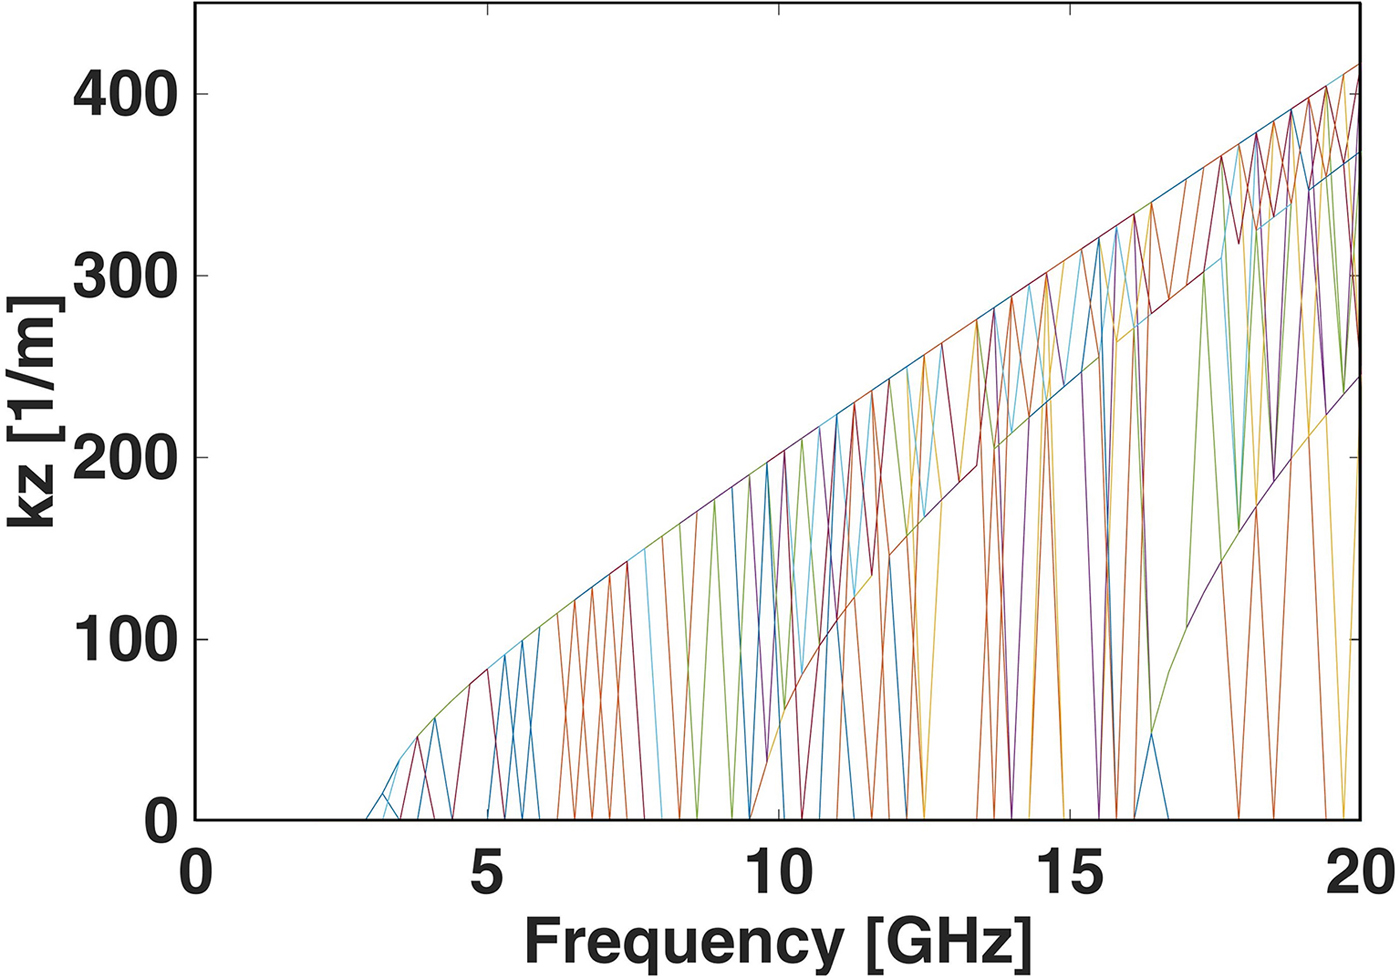
The different TM and TE mode solutions over the frequency band range from 0 to 20 GHz are demonstrated in HFSS software by comparing analytical relations to simulation results, in Fig. 6 for Z s = −j5000. We are not able to determine that which one of the dispersion curves belonged to which mode number in HFSS software, unless, by considering each solution field's pattern in software. However, it is tough because of the presence of impedance boundary condition in one side of the waveguide. However, in the analytical method, the mode type and the value of m can be determined by the user. For each m, the first curve obtained is related to the lowest mode, n = 1, and the subsequent curves for higher n.
The dispersion curve from HFSS simulation result. All of the curve results are confirmed by Matlab software in m = 0, 1.

Therefore, the determination of the mode type and its number for each output curve of HFSS is carried out by the MATLAB codes. The convergence of this problem in both of HFSS and MATLAB has difficult procedures. In the setting of HFSS software (Analysis-> setup1 -> edit frequency sweep) in the sweep type, for the convergence of analysis, the method of discrete should be utilized. Convergence could not be yielded by interpolating and fast methods. Another point is adjusting the period of frequency setting analysis. In this part, the accuracy of 0.01 GHz for frequency analysis could be employed by setting step size <0.005 GHz in edit frequency sweep window. The difference simulated curves of HFSS and MATLAB output in the demonstrated scale are not recognizable.
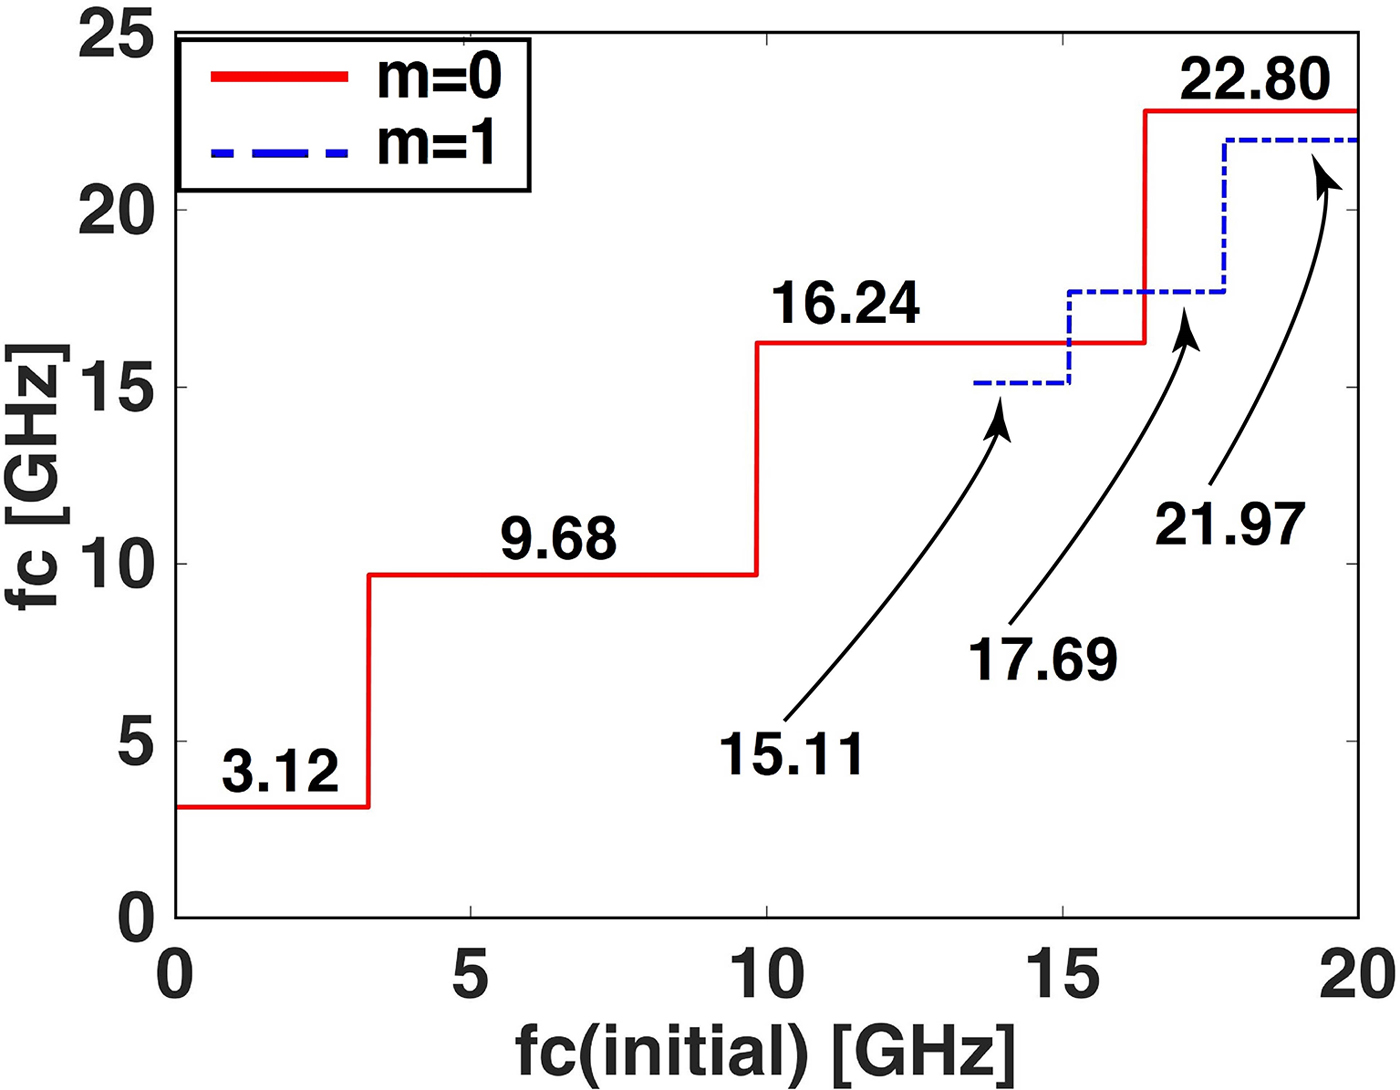
For m = 0 and using the TE y propagation, three lower modes are plotted in Fig. 7. The cut-off frequencies of TE y and TM y in terms of initial cut-offs are plotted for m = 0, 1 in Figs 8 and 9, respectively. In Fig. 8, k z = 0,Z s = −j5000. The initial values of cut-offs are varied from 0 to 20 GHz. The f c curve obtained from m = 0, 1 is plotted in terms of initial values. The initial value of f c for m = 1 starts from 12, because the initial values less than 12 lead to false answers. In Fig. 9, the procedure is carried out for TM y. The m value should not make the main component of fields to vanish. The mode m = 0 for TM y is considered to show the symmetric results. The similar mode is extracted from HFSS software by considering the cut-off frequency of each mode. Then they are matched to the analytical results. In Fig. 10, a comparison is made between the two first modes of impedance waveguide with PEC waveguide (both WR-90). Table 1 shows the cut-off frequency and the dispersion mode number of this waveguide (Matlab code in presented in the Appendix).
Comparison of dispersion curve derived from the proposed method and simulation with HFSS for m = 0 and TE y.

Cut-off frequency of TE y mode for m = 0, 1 in terms of initial values in the non-linear equation.

Cut-off frequency of TM y mode for m = 0, 1 in terms of initial values in the non-linear equation.
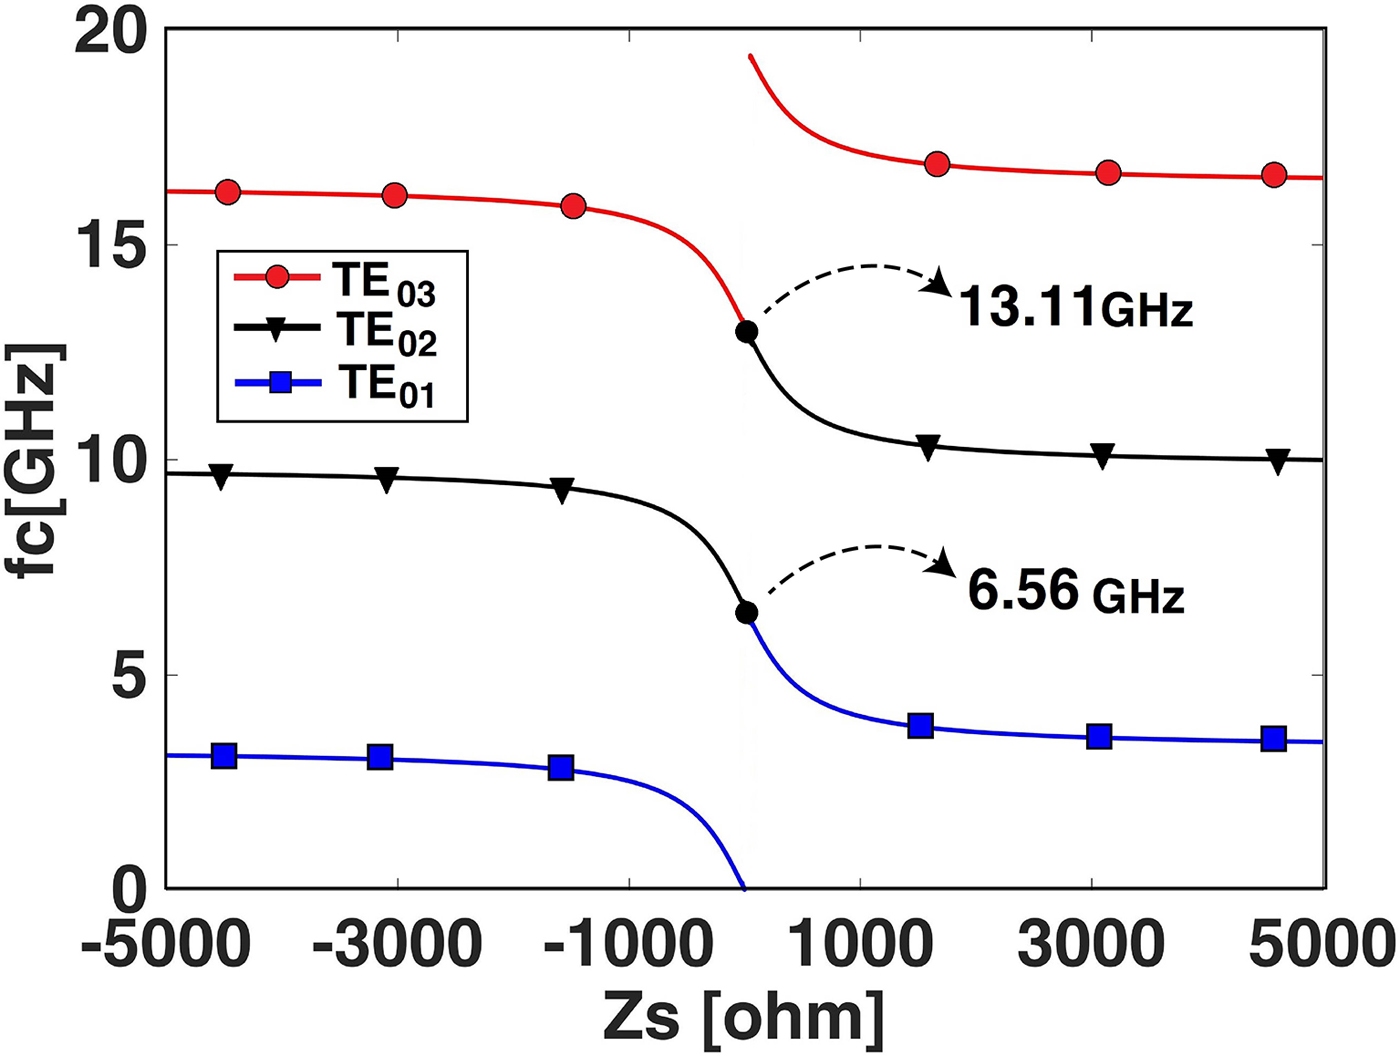
Cut-off frequency of TE y modes versus Z s for m = 0.
The cut-off frequency and the dispersion mode number of meta-waveguide for Z s = −j5000

As the table shows, the first and second cut-off frequencies are f c = 3.1 GHz and f c = 9.7 GHz, respectively. Owing to the fact that the cut-off frequencies of first and second modes for PEC waveguide are f c = 6.6 GHz and f c = 13.2 GHz, respectively, the impedance wall of waveguide leads to the cut-off frequency reduction for both first and second modes in comparison to PEC boundary. The length between cut-off frequency first and second modes would remain BW = 6.56 GHz (constant value) when the impedance varies. If we intend to decrease the operating frequency of a conventional waveguide, we will need to increase the waveguide dimensions. But as it is shown, using an impedance waveguide can facilitate this issue, by increasing waveguide size.
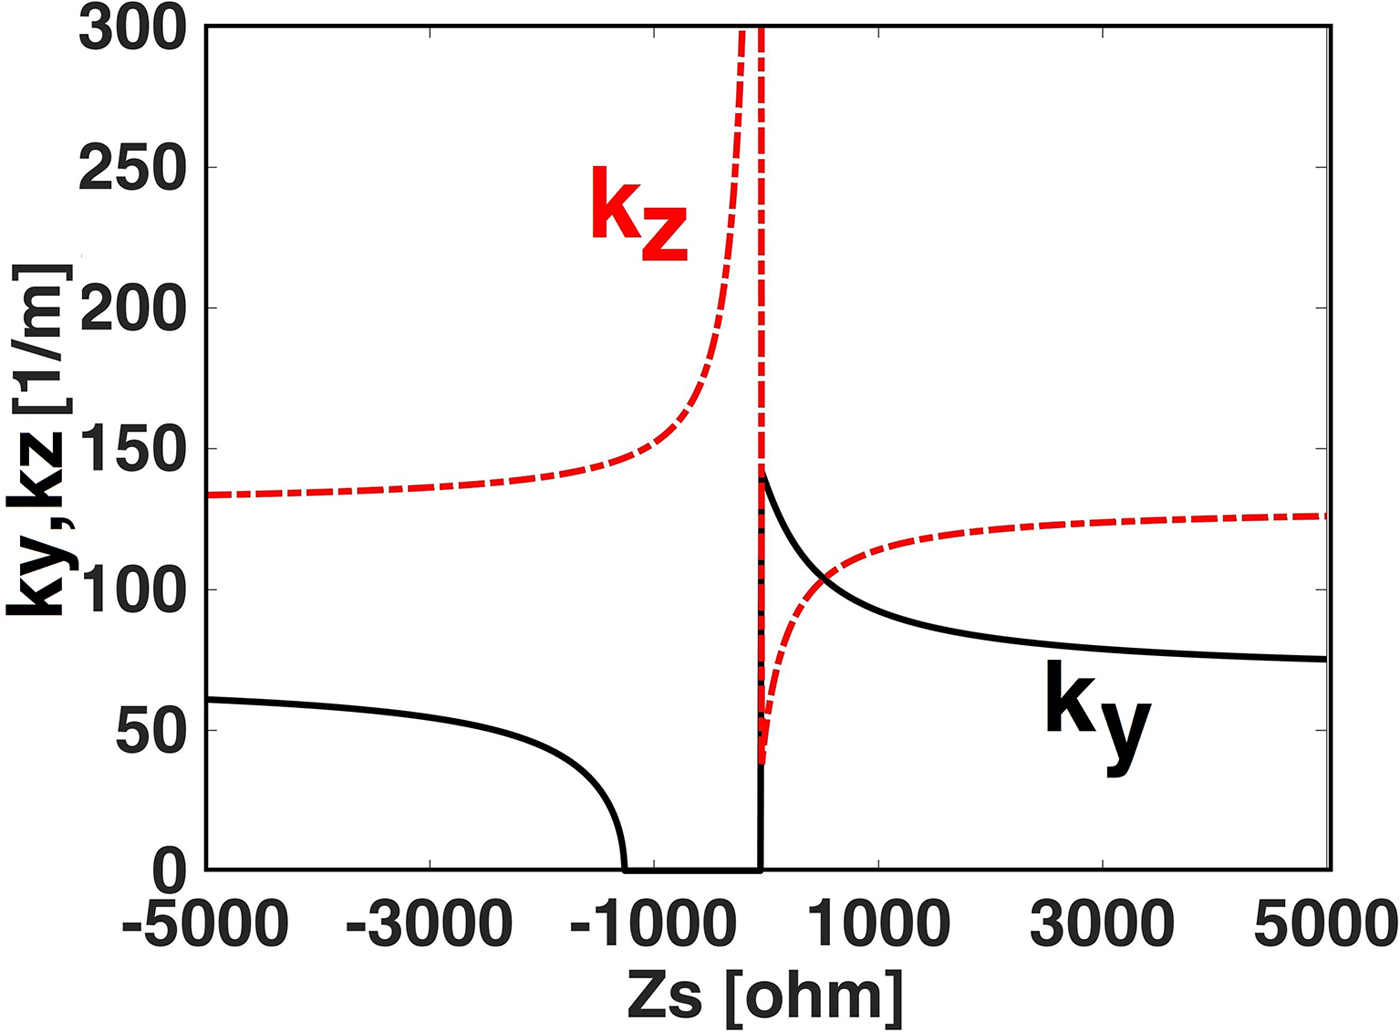
For m = 0 and TE y, k y and k z are plotted versus Zs in Fig. 11. In (− 1260 <Z s <0), the value of k y becomes imaginary. If any attenuation exists along the y-direction (like a leaky-wave antenna in which wave propagates outside the waveguide from the sidewall [Reference Khan, Fraz and Tahir15]), k y will be complex.
k y and k z versus Z s for m = 0 and TE y.
Change of the z-component of H in terms of the impedance value
In the previous section, the wave number components k y and k z are calculated for different impedance values. In this section, by substituting k y and k z for TE y and m = 0 in relation (4), the magnitude of H z is achieved. In Figs 12 and 13, the impedance value of the wall is modeled in inductance and capacitance properties, respectively, and |H z| is plotted versus y.
The magnitude of Hz for TE y and m = 0 versus y (inductive impedance).

The magnitude of Hz for TE y and m = 0 versus y (capacitive impedance).

When the surface impedance is inductive, by increasing the magnitude of impedance, |H z| = 0 moves along the (+y) direction. When the surface impedance is capacitive, by increasing the magnitude of impedance, |H z| = 0 moves along the (–y) direction and near the central plane of waveguide (y = b/2). In Figs 12 and 13, numerical values of |H z| are plotted in terms of y for a different amount of Z s.
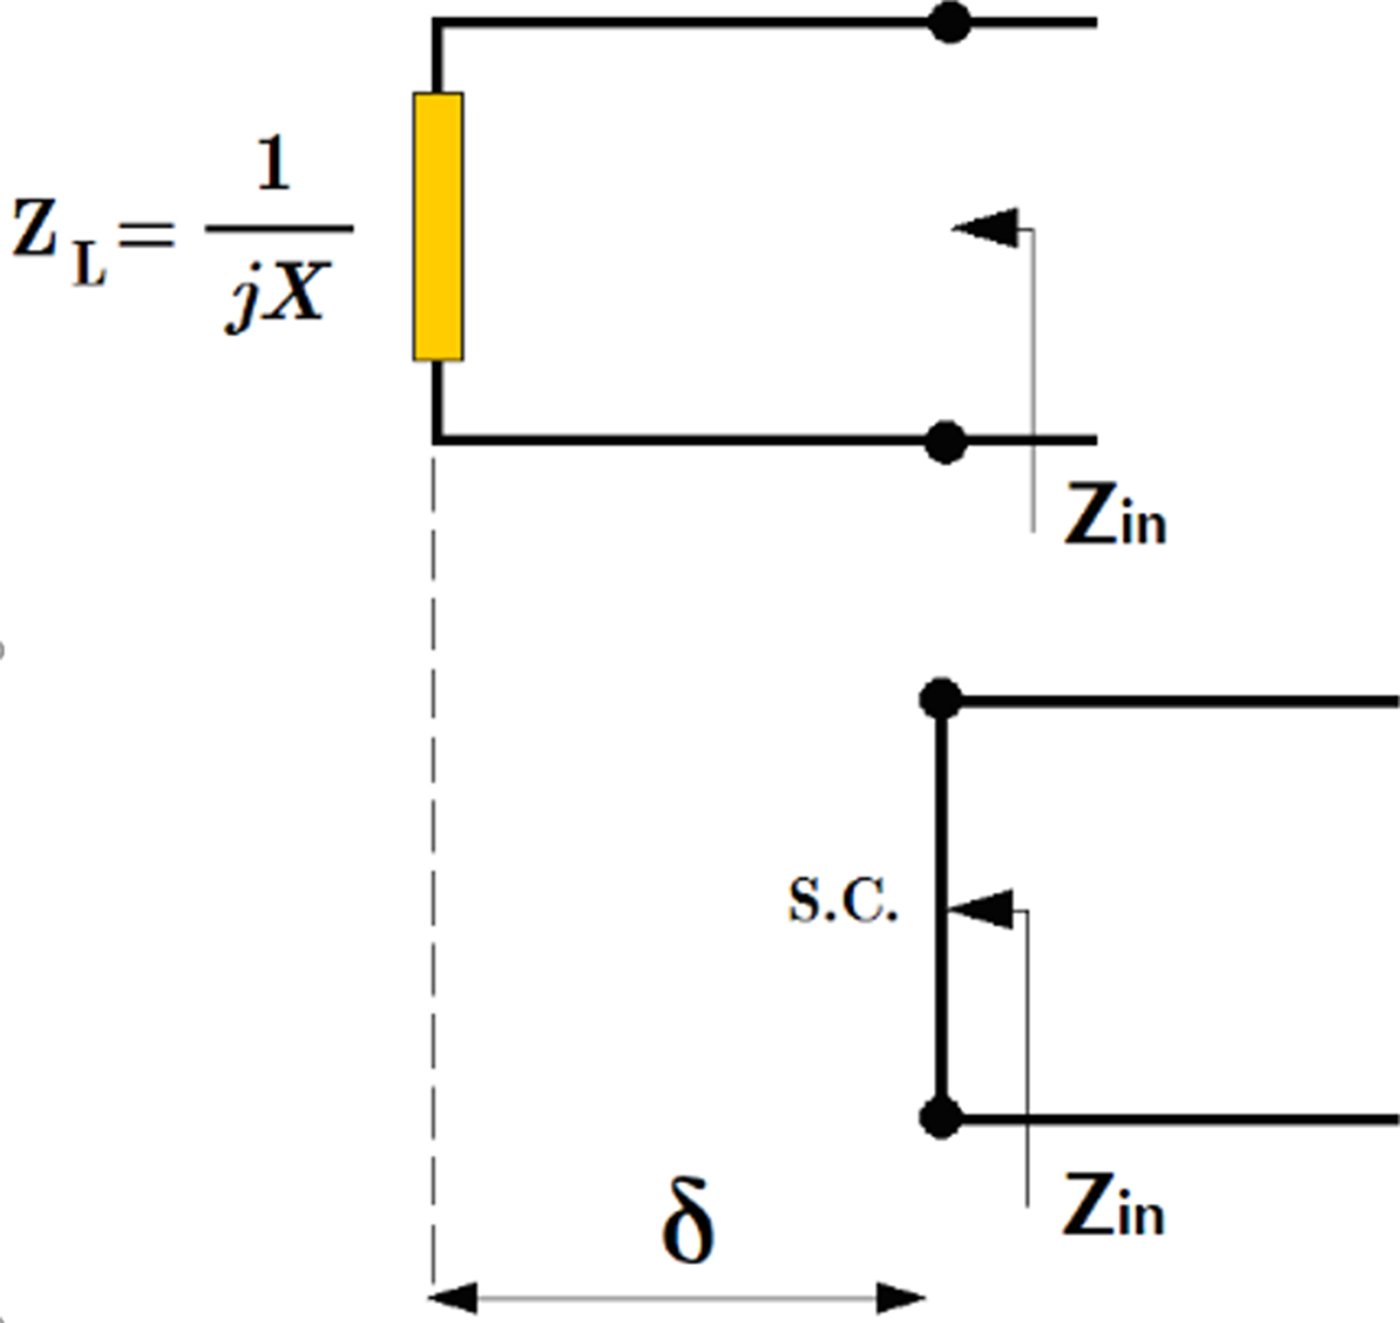
For simplicity, we first consider a transmission line leading to an impedance element as shown in Fig. 14 and assume it has pure reactance Z L = jX in the first state. In this case, the reactance element can be removed, and a transmission line with a length of δ can be replaced instead, in which Z in = jX:
 $$\eqalign{Z_{in} &= jX \cr {{Z}^{\prime}}_{in} &= j\,Z_0\tan \lpar {k_y\delta} \rpar.} $$
Thus it can be concluded that the use of a reactance element at the end of one transmission line (according to Fig. 14) is similar to increase of that line length. In the same way, according to relations (15), the use of a substance element at the end of an additional transmission line will be equivalent to a short circuit (Fig. 15):
 $$\eqalign{Z_{in} &= Z_0\displaystyle{{\displaystyle{1 \over {\,jX}} + jZ_0\tan \lpar {k_y\delta} \rpar } \over {Z_0 + j\displaystyle{1 \over {\,jX}}\tan \lpar {k_y\delta} \rpar }} \cr {{Z}^{\prime}}_{in} &= 0.} $$
Figure 16 shows the change of the H z value in terms of Z s, for TE y when m = 0. As it is observable, in an either capacitive or inductive situation, the z component of H increases with the increase of Z s value. But by increasing the value of Z s, the increasing slope of the curve decreases gradually. Field distributions in waveguide turn from cosine to the hyperbolic type in which k y has only an imaginary part.
Equivalent transmission line of a pure reactance element, with an additional transmission line shortened to a short-circuit (SC).

Equivalent transmission line of a pure susceptance element with an additional transmission line is equal to a short-circuit.
The magnitude of Hz for TE y and m = 0 versus Z s.
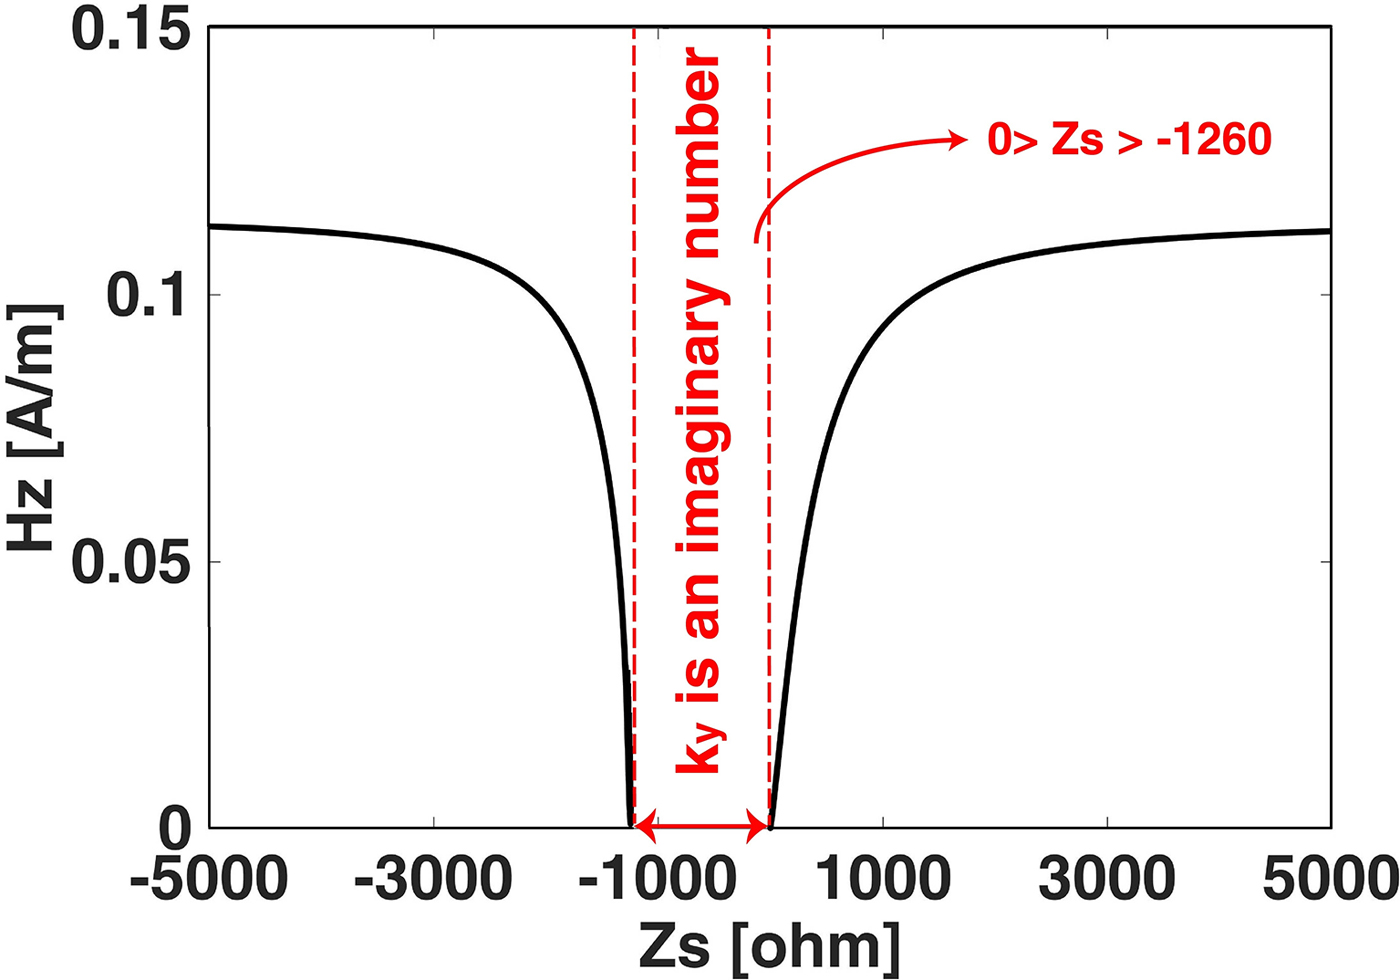
As it is stated earlier, our objective is to design a slot array antenna by means of elimination of slots offsets. Thanks to the different field distribution in this antenna, the value of the surface impedance in front of each slot should be different. In the design process, after extracting the H z value for each slot, by employing an equivalent antenna of Elliot method, the Z s producer of the derived field can be calculated from Fig. 16.
Waveguide and antenna structures with periodic impedance walls
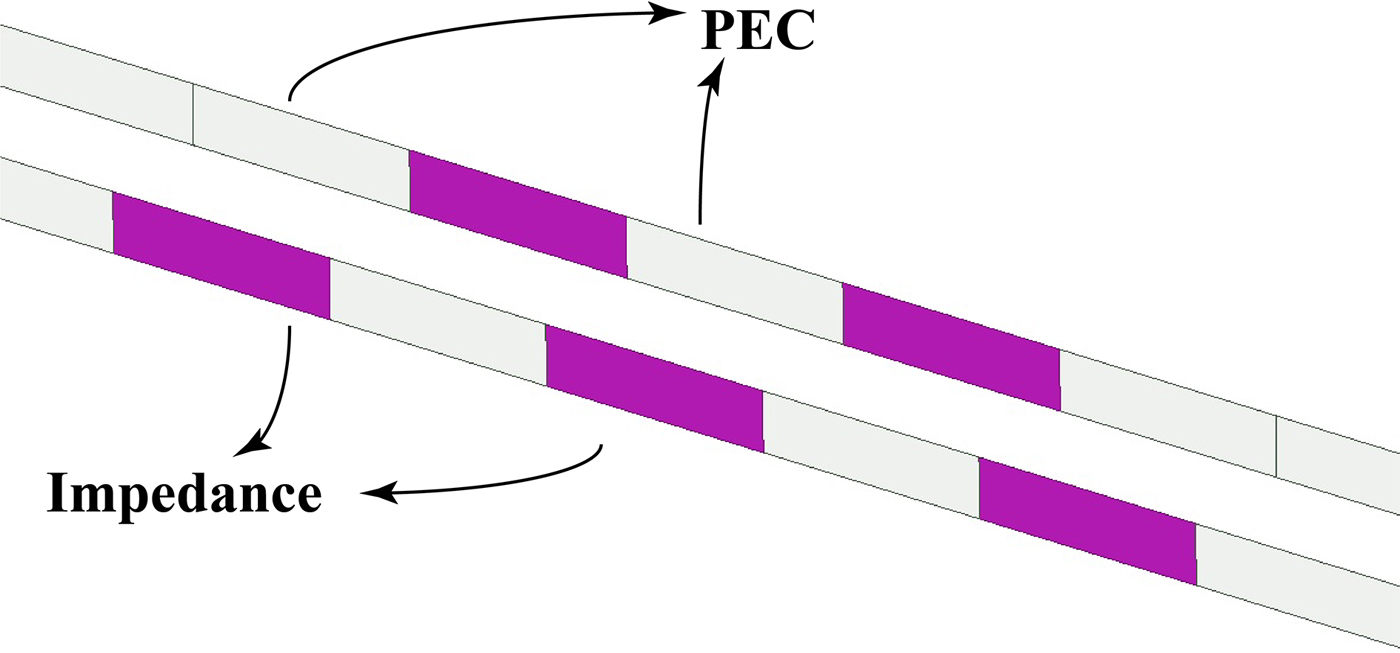
As shown in Fig. 17, five impedance blocks with the value of Z s = −j5000 and the length of T = 18 mm are embedded on the right and left sides of the waveguide. Each block consists of a surface impedance and a PEC boundary at the other side. Along the length of the waveguide, before and after the periodic regions, the boundary conditions for sidewalls are PEC. The wave ports are placed outside the periodic region, where the waveguide has PEC sidewalls, and because of this, an infinite condition will be considered in the simulations. Thus we can consider this set-up as an infinite waveguide along with five periodic impedance surfaces on its side walls. In Fig. 18, the phase and magnitude of H z are demonstrated over z-axis in the y = b/2 and x = a/2 planes (Fig. 1). As expected, the maximum of the magnitude of the H z occurs near the center of the impedance blocks. There are some shifts in the position of the H z peak points. This happens because the waveguide is quasi-periodic and there are some differences at the boundary conditions of the two wave ports when the waveguide is assumed to be infinite. The phase of H z varies with the change in the wavelength in addition to the change of the boundary condition. The wavelength should be adjusted to obtain a 180-degree phase difference between the two consecutive slots in the frequency band where the first mode is excited.
Geometry of the conductive waveguide possesses five periodic impedance block at center.
Magnitude and phase of Hz component for TE y along the waveguide on y = b/2.

Surface impedance realization by meta-surfaces
First, we consider a WR-90 waveguide (a = 22.86 and b = 10.16), then we calculate the H z component for each slot of a given slot array antenna. Then, we obtain the impedance value of the walls, which makes the same H z, by our proposed method. However, the slots are at the center of the antenna at this form. Then we synthesize each impedance surface block (in front of the given slot) utilizing circular metasurface patches. This design exhibits surface characteristics that can be controlled by adjusting the constituent structural elements. Simple modeling of a metasurface structure periodically arranged with square metal patches in a rectangular waveguide is discussed in [Reference Fallah and Khalaj-Amirhosseini20]. The 3D sketch of the final antenna is shown in Fig. 19.
The 3D sketch of the final slot array antenna using meta-waveguide. The circular patches, slots, and feed are demonstrated.

In Table 2, the far-field results obtained by the meta-waveguide and equivalent Elliott's methods [Reference Elliott21] are compared with each other. Two Taconic RF-35 layers with a dielectric constant of ε r = 3.5, a loss tangent of tanδ = 18 × 10−4, and a thickness of h = 0.762 mm are placed adjacent to the sidewalls of the waveguide. The metasurface structures are printed on these layers. The values of the different parameters of the metasurface are shown in Fig. 20. Distance between the centers of the two adjacent slots is 18 mm, and the center of the first slot is placed 37.5 mm from the shorted end of the waveguide. The simulated realized 3D gain pattern of the proposed antenna is compared with that of the conventional antenna designed by Elliott's formulas, as shown in Fig. 21. The butterfly lobes which can be seen in the patterns of the antenna designed by the Elliot's method do not exist in those designed by the meta-waveguide approach. The realized gain of Elliott's method is 12.1 dB at 10 GHz, and Side Lobe Level (SLL) in φ = 90 and φ = 45 plane is equal to −11 dB and −10 dB, respectively. Thus, the meta-waveguide has improved SLL-90, 1.2 dB and SLL-45, 5.2 dB.
Geometric parameters of circular patches in equivalent unit with the length 20.5 mm.

Comparing the three-dimensional far-field realized gain of two five-slot antennas designed using the method in this paper and the Elliott's formulas.

The comparison of realized gain and side lobe level at φ = 90,45 between the proposed antenna by means of meta-waveguide approach and Elliott's method

The meta-waveguide antenna was fabricated using a typical milling machine on an aluminum profile. Figure 22 shows the fabricated antenna containing its metasurface walls and its large slotted wall. One sees that the slots are collinear, but two non-uniform walls are approaching the slots alternately. The fabricated antenna was tested for validation. Figures 23 and 24 compare the measured and simulated values of the gain pattern on the surfaces φ = 45 and φ = 90, respectively. As it is seen, there is a good agreement between the results of simulation and measurement. Some disagreements of the two curves at φ = 90 and θ < − 20 are due to the presence of a large SMA on the top surface of the antenna. Figure 25 shows the simulated and measured reflection coefficients versus frequency.
The fabricated meta-waveguide antenna.

The simulated and measured gain pattern of the meta-waveguide antenna on the surface φ = 45.

The simulated and measured gain pattern of the meta-waveguide antenna on the surface φ = 90.

The simulated and measured reflection coefficient of meta-waveguide antenna versus frequency.

Conclusion
In this paper, by presenting analytical relations, cut-off dispersion, longitudinal and transverse components of the wave number, and longitudinal component of the magnetic field are extracted, and the results are validated by Full-wave software. The magnitude and phase of the longitudinal component of the magnetic field are modeled by periodic impedance walls. By this approach, a slot array antenna with periodic impedance surfaces is designed. The design results in side lobe elimination due to the utilization of linear slots. The objective of this paper is to investigate the impedance boundary conditions like ideal metamaterials. Apart from the ways of the realization of impedance boundaries, this paper investigates the impact of these boundaries on field formation and features in waveguide and slot array antenna. This approach is capable of being employed in several other electromagnetic devices to exploit several new properties. In the future, researchers can propose various methods to realize impedance surfaces. Using metasurfaces, that one way of realization of impedance surfaces is investigated in this work. A meta-waveguide antenna with five slots is designed at frequency 10 GHz and then fabricated and tested. A reduction of side lobe level more than 5 dB is obtained using meta-waveguide instead of the conventional one.
The idea of practical implementation of impedance surfaces helps to control electromagnetic fields and dispersions inside a waveguide. This method could be used by employing impedance boundaries inside a waveguide (like slot array antenna in this work) not only in the waveguide walls but in every specific point in it. Electrical permittivity and magnetic permeability of a metasurface and its frequency dependence as an infinite surface on the electromagnetic dispersion of waveguide could be an interesting topic for researchers.
Appendix
Matlab code for cut-off frequency of TE y modes versus Z s:
clc
clear all
format long
ep=8.85*10^(-12);
mu=4*pi*10^(-7);
a=10.16*0.001;
b=22.86*0.001;
tt=0;
for Zs=i*(-5000:50:5000);
tt=tt+1;
pp=0;
xx0=0;
xx=0;
for x0=(0.01:0.2:20)*2*pi
m=0;
f234=@(x)((i*x*(1e9)*mu)*tan(sqrt((x*(1e9)*sqrt(mu*ep))^2-(m*pi/a)^2)*b)/(sqrt((x*(1e9)*sqrt(mu*ep))^2-(m*pi/a)^2))+Zs);
[x,fval,exitflag,output]=fsolve(f234,x0);
x/(2*pi);
if (real(x)>0)&(imag(x)<10^-4)
pp=pp+1;
xx(tt,pp)=real(x/(2*pi));
xx0(pp)=x0/(2*pi);
end
end
fc(tt,1)=min(xx(tt,:));
uu=1;
for yy=1:pp-1
if (abs(xx(tt,yy)-xx(tt,yy+1))>0.1)
uu=uu+1;
fc(tt,uu)=xx(tt,yy+1);
end
end
end
hold on
Zs=(-5000:50:5000);
for dd=1:4
plot(Zs,fc(:,dd))
hold on
end
ylabel('fc[GHz]')
xlabel('Zs [ohm]')
 Mahmoud Fallah was born in Iran. He received his M.Sc. degree from the Iran University of Science and Technology (IUST), Tehran, in 2012. His research interests include wave propagation in inhomogeneous media, periodic structures (FSS), and numerical method in electromagnetic.
 Mohammad Khalaj-Amirhosseini was born in Tehran, Iran, in 1969. He received the B.Sc., M.Sc., and Ph.D. degrees in electrical engineering from the Iran University of Science and Technology (IUST), Tehran, in 1992, 1994, and 1998, respectively. He is currently a Professor with the School of Electrical Engineering, IUST. His current research interests include electromagnetics, microwaves, antennas, radio wave propagation, and electromagnetic compatibility.



