Introduction
Clay has significant hydrophilicity, illustrated by the fact that it is often water hydrated, which is closely associated with its own physicochemical properties; thus, this hydrophilicity can affect the engineering properties of clay (van Olphen, Reference van Olphen1977; Morrow et al., Reference Morrow, Moore and Lockner2000). The entity which drives clay hydration is the variety of clay hydration sites, such as the mineral surface, exchangeable cations, and imbalanced ions at the mineral edges (van Olphen, Reference van Olphen1977; Devineau et al., Reference Devineau, Bihannic, Michot, Villiéras, Masrouri, Cuisinier, Fragneto and Michau2006; Laird, Reference Laird2006; Salles et al., Reference Salles, Beurrois, Bildstein, Jullien, Raynal, Denoyel and van Damme2008). When hydration sites adsorb water, the mechanical strength of the clay decreases significantly and leads to soil failure (Low & Margheim, Reference Low and Margheim1979; Miller et al., Reference Miller, Teh, Li and Zaman2000; Morrow et al., Reference Morrow, Moore and Lockner2000; Moore & Lockner, Reference Moore, Lockner, Dixon and Moore2007; Wang et al., Reference Wang, Zhang and Zhang2010).The reason adsorbed water influences the mechanical behavior is revealed by the diffuse double layer (DDL) (Warkentin et al., Reference Warkentin, Bolt and Miller1957), which is referred to as the DLVO theory (Derjaguin & Landau, Reference Derjaguin and Landau1941; Verwey & Overbeek, Reference Verwey and Overbeek1948). It states that the DDL thickness affects directly the strength of clay because the distance between clay particles increases, thereby weakening the particle bonds (Maio, Reference Maio1996; Chen et al., Reference Chen, Anandarajah and Inyang2000; Morrow et al., Reference Morrow, Moore and Lockner2000). Note that DLVO theory asserts that the DDL thickness observed in a series of various clay minerals at a given swelling pressure is because the interlayer expansion varies among these clays; thus, the expansion is due to hydration of the interlayer cation and depends on the layer charge. However, in the previous research works of Viani et al. (Reference Viani, Low and Roth1983, Reference Viani, Roth and Low1985), the interlayer expansion was thought to be most closely correlated with the surface, not the layer charge. In fact, regardless of whether the interlayer charge or surface dominates the interlayer expansion, the result is the weakening of particle bonds and decreasing mechanical performance. This argument implies the significance of these two sites in hydration. To reveal the cause of change in mechanical behavior by OISS, these two kinds of hydration sites are worthy of investigation.
Accompanied by the sorption of water molecules, the clay pores also change, resulting in an expansion in macroscopic volume (Mooney et al., Reference Mooney, Keenan and Wood1952; Cases et al., Reference Cases, Berend, Besson, Francois, Uriot, Thomas and Poirier1992; Cases, Reference Cases1997; Salles et al., Reference Salles, Beurrois, Bildstein, Jullien, Raynal, Denoyel and van Damme2008, Reference Salles, Douillard, Denoyel, Bildstein, Jullien, Buerrois and van Damme2009). In particular, swelling clay such as bentonite has an apparent volume increase in response to water and this is very effective in destabilizing slopes, foundation pits, and subgrades (Wang et al., Reference Wang, Zhang and Zhang2010; Al-Taie et al., Reference Al-Taie, Disfani, Evans, Arulrajah and Horpibulsuk2016). Clay expansion has been reported and discussed in many studies. However, opinions differ with respect to its origin. One conventional opinion is that crystalline swelling and osmotic swelling occur sequentially when swelling clay hydrates (Norrish, Reference Norrish1954; Madsen & Müller-Vonmoos, Reference Madsen and Müller-Vonmoos1989; Laird, Reference Laird2006; Liu, Reference Liu2013). In this concept, water molecules are adsorbed into the clay interlayer, resulting in layer-spacing (d 001) expansion, which is referred to commonly as crystalline swelling (Norrish, Reference Norrish1954). With the further adsorption of water, the hydration of adsorbed counterions occurs in the liquid phase to generate a DDL around clay particles. Based on the repulsion of the DDL, clay particles act over much longer distances, which is referred to as osmotic swelling (Madsen & Müller-Vonmoos, Reference Madsen and Müller-Vonmoos1989). An alternative view, however, is that the major repulsive force causing the long-distance interaction among clay particles after the crystalline swelling stage is hydration of the surface (Odom & Low, Reference Odom and Low1978; Low & Margheim, Reference Low and Margheim1979; Low, Reference Low1980, Reference Low1981; Viani et al., Reference Viani, Low and Roth1983). The swelling pressure calculated through DDL theory is far less than experimental data, indicating that osmotic pressure is just a small component of the repulsive force (Low, Reference Low1981). Based on this concept, the factor that leads to repulsion among clay particles and volume increase is the hydration of the mineral surface.
According to the discussion above, an effective way to improve the engineering performance is to change the hydration properties of the clays and reduce the amount of adsorbed water, which differs from the conventional method that uses cementitious material such as cement and lime (Chew et al., Reference Chew, Kamruzzaman and Lee2004; Al-Mukhtar et al., Reference Al-Mukhtar, Lasledj and Alcover2010; Ranaivomanana et al., Reference Ranaivomanana, Razakamanantsoa and Amiri2018) to generate connections among clay particles and directly achieve reinforcement. By conventional methods, changing the hydration properties is thought to be an additional benefit. In addition, some newly developed polymer stabilizers (Yazdandoust & Yasrobi, Reference Yazdandoust and Yasrobi2010; Razakamanantsoa & Djeran-Maigre, Reference Razakamanantsoa and Djeran-Maigre2016) work in this way. The use of an organic, ionic soil stabilizer (OISS) (Katz et al., Reference Katz, Rauch, Liljestrand, Harmon, Shaw and Albers2001; Mishael et al., Reference Mishael, Undabeytia, Rytwo, Papahadjopoulos-Sternberg, Rubin and Nir2002; Zhao et al., Reference Zhao, Ge, Petry and Sun2014; Alves et al., Reference Alves, Rosa and Morales2017) to change the hydration properties provides a new method for improving engineering performance. This method is based on knowledge that hydration properties are associated with the above-mentioned engineering behavior. Therefore, OISS, which can regulate the hydration properties of clay, is used to improve the engineering behavior of clay and has drawn considerable attention from engineers and researchers, such as Katz et al. (Reference Katz, Rauch, Liljestrand, Harmon, Shaw and Albers2001) and Lu and Xiang (Reference Lu, Xiang, Li, Liu, Guo, Zhang and Du2011). Significant applied research has been launched to verify the effect of OISS on multiple clays, and some mechanistic studies have even been performed to investigate the interaction between OISS and clay minerals (Katz et al., Reference Katz, Rauch, Liljestrand, Harmon, Shaw and Albers2001; Petry & Das, Reference Petry and Das2001; Rauch et al., Reference Rauch, Harmon, Katz and Liljestrand2002; Xiang et al., Reference Xiang, Cui, Liu, Lu and Cao2010; He et al., Reference He, Yu, Banerjee and Puppala2018). Their research on OISS showed that this kind of stabilizer could suppress the water-retention capacity of clay and improve its mechanical behavior.
Thus, the use of OISS shows promise to improve the engineering behavior of clay in the current construction environment in China. To explain the regulatory mechanism, studies have been limited to the comparison of partial microproperties, such as results from X-ray diffraction (XRD) and infrared spectroscopy (IR) (Katz et al., Reference Katz, Rauch, Liljestrand, Harmon, Shaw and Albers2001; Alves et al., Reference Alves, Rosa and Morales2017), zeta potential and cation-exchange capacity (Xiang et al., Reference Xiang, Cui, Liu, Lu and Cao2010), and specific surface area (Liu et al., Reference Liu, Xiang, Cui and Cao2011). Comprehensive discussion of the transformation of microproperties after use of OISS is lacking, leading to confusion about the causes of regulation. Furthermore, clay deposits are complex materials composed of clay minerals, sand, and even organic matter. These compositions might all interact with OISS, which makes complex the regulation of OISS on raw clay deposits.
In the current study, the main objective was to understand better the mechanism by which OISS affects the hydration properties of four typical clays by exploring the effects of OISS on hydration sites, such as exchangeable cations and the mineral surface. The hypothesis was that these tests would reveal the OISS regulation mechanism.
Materials and Methods
Clays
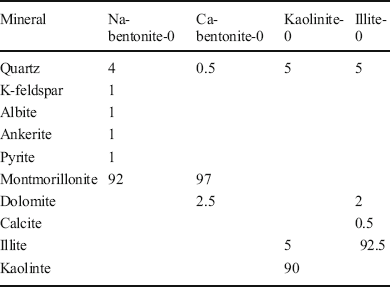
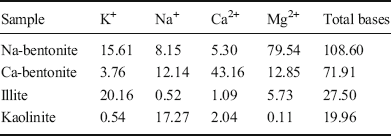
The four typical clays selected were Na-rich bentonite (identified as Na-bentonite-0), which is a kind of Wyoming bentonite (from Braunfels Labs, New Braunfels, Texas, USA); Ca-rich bentonite (Ca-bentonite-0) from a volcanic area in Greece; kaolinite (kaolinite-0), mined in Maoming (from Guangdong Lixin Energy Co., Ltd, Maoming, China); and illite (illite-0), mined in Antu (from Tongchang Illite Products Co., Ltd, Antu, China). X-ray diffraction (D8-FOCUS with a CuKα radiation source, Ni filter, 40 kV, 40 mA, scan range of 2–65°2θ, step intervals of 0.02°2θ, and dwell time of 2 s; Bruker, Karlsruhe, Germany) was used in the identification and quantification of the materials (JCPDS, 1995). The XRD patterns of the four clays are shown in Fig. 1 and the phase compositions from the XRD patterns are displayed in Table 1, showing that bentonite had >90 wt.% montmorillonite, indicating that these two bentonites were single-clay mineral samples. The phase composition of illite and kaolinite showed that these two clays were also >90% pure. X-ray fluorescence (XRF) was performed with an AXIOSmAX instrument (PANalytical, Eindhoven, The Netherlands), and the results are provided in Table 2. These results list the chemical compositions of the clays in terms of mass percent. The exchangeable cations of the clays were determined based on the BaCl2-MgSO4 method (Bache, Reference Bache1976). In the testing process, exchangeable cations were replaced with barium and measured by inductively coupled plasma-optical emission spectroscopy (iCAP 6300, ThermoFisher Scientific, Waltham, Massachusetts, USA), as displayed in Table 3. Analysis of the cation composition verified that the main exchangeable cation in Na-bentonite was Na+, while it was Ca2+ in Ca-bentonite.
XRD patterns of a Na-bentonite-0, b Ca-bentonite-0, c illite-0, and d kaolinite-0

Mineral composition (wt.%) of clays

Chemical compositions (wt.%) of clays

Exchangeable cation content of clays (meq/100 g)

Organic, Ionic Soil Stabilizer (OISS)
The organic, ionic soil stabilizer was developed independently by Prof. Wei Xiang’s group at the China University of Geosciences. It was produced by the sulfonation of cottonseed oil and concentrated sulfuric acid at a ratio of 1:3, using a reaction time of 9 h and a reaction temperature of 70°C. Chemical reactions occur easily and the raw materials are abundant in China. OISS have the potential to become popular, therefore.
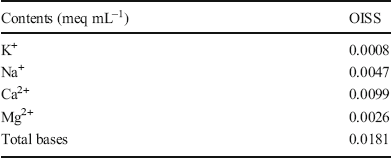
The main output is cottonseed oil-based sulfonated oil with a formula of R-SO3H, where R is the organic hydrocarbon chain. Results from the cation tests (Table 4) showed very small amounts of mineral cations, such as K+, Na+, Ca2+, and Mg2+, demonstrating that the OISS solution had very few mineral cations when diluted with water; thus, OISS was not expected to introduce additional K+, Na+, Ca2+, or Mg2+ to the clays.
Inorganic cation content of OISS

Modified Samples using OISS
OISS is a grease that cannot interact with clay directly unless it is diluted with water to a particular volume ratio. In previous work on natural-soil modification (Cui, Reference Cui2009; Lu & Xiang, Reference Lu, Xiang, Li, Liu, Guo, Zhang and Du2011), the optimal dilution ratio for natural red clay from Wuhan, China, which contains 28.49 wt.% clay particles, was 1:200 of OISS to deionized water. In the present study, the clay had >90 wt.% clay particles, which is 3.2 times that of red clay. To achieve a good improvement, the concentration of the OISS solution could be calculated as 1:200/3.2 ≈ 1:62.5; thus, doses of 1:50 and 1:100 might be suitable here. 100 g of naturally air-dried clay was selected, therefore, to interact with 200 mL of the dilute OISS liquor. After 5 min of stirring, the soils and liquors became homogeneous mixtures, which were then placed in a hermetic chamber for 24 h to interact completely. Subsequently, the modified clays were removed and leached to wash out the free ions and excess OISS through centrifugation. This step was repeated four times to ensure rigorous salt leaching. Then, liquid nitrogen was added to the modified clays to freeze-dry them for 48 h. Finally, the freeze-dried samples, labelled as Na-bentonite-1/50, Na-bentonite-1/100, Ca-bentonite-1/50, Ca-bentonite-1/100, kaolinite-1/50, kaolinite-1/100, illite-1/50, and illite-1/100 according to their OISS concentration, were selected for testing. In addition, raw clays were prepared for testing in the same way.
Liquid Limit
The wet and raw samples along with the modified bentonite, kaolinite, and illite samples that had been leached of their free ions and excess OISS were tested for their liquid limits. For bentonite and illite, the disc instrument, which is a mechanical device consisting of a brass cup suspended from a carriage designed to control its drop onto a hard rubber base, was used to measure the liquid limit. The liquid limits of these clays were measured using ASTM D 4318-17 (2017) through a wet preparation procedure and multipoint liquid limit method. The disc instrument could not be used with kaolinite, however, because kaolinite rapidly formed a connection of >12.7 mm after one drop at the bottom of the groove. Therefore, a cone liquidometer was applied to define the liquid limit of kaolinite according to the British fall cone test standard (1990). The liquid limit was the water content at which an 80±0.05 g stainless steel cone with a 30±1° angle penetrated a remolded 20 mm soil specimen when the cone was released toward the soil surface (Ike, Reference Ike2020).
Water Vapor and Nitrogen Adsorption
The clastic freeze-dried bentonite and kaolinite (raw and modified samples) were placed in an Autosorb-iQ instrument (Quantachrome Instruments, Boynton Beach, Florida, USA) to measure their water-vapor adsorption-desorption isotherms at 20°C. In addition, the water-adsorption properties of raw and modified illite samples at 20°C were measured by a 3H-2000PW instrument (Beishide Instrument, Beijing, China). The former instrument worked based on the volumetric method, and the other used the gravimetric method to measure the capacity of water. These two instruments were both applied to investigate the difference between the modified samples and raw clay samples. A nitrogen adsorption test of all testing materials within the relative pressure range of ~0.05–0.35 was performed using an ASAP2460 instrument (Micromeritics Instrument Corporation, Norcross, Georgia, USA) to acquire the BET surface area. Before the adsorption test, the samples were vacuum dried for 2 h at 105°C to remove the water molecules adsorbed on the surface, which reduced the adsorption capacity of nitrogen. According to previous work (Lang et al., Reference Lang, Xiang, Huang and Schanz2017), this process would not induce a significant change in nitrogen adsorption resulting from possible damage to the clay properties.
Infrared Spectroscopy (IR), Thermogravimetric and Differential Scanning Calorimetry Analysis (TG/DSC), and Environmental Scanning Electron Microscopy Coupled with Energy Dispersive Spectroscopy (ESEM-EDS)
Powdered raw and modified testing materials were placed in an airtight glass pot for 30 days, during which relative humidity (RH) was controlled by a saturated K2SO4 solution at ~97.9%. Subsequently, these moist powder samples were removed to obtain their IR spectra through the use of a Nicolet-6700 spectrometer (Thermo Fisher Scientific, Waltham, Massachusetts, USA). Therefore, the vibration characteristics of O–H bonds caused by hydration but not those in the octahedral sheet of clay minerals are explored.
An STA 449F3 instrument (Netzsch-Gerätebau GmbH, Selbu, Germany), which can measure TG and DSC curves simultaneously, was used to test the freeze-dried Ca-bentonite powders (raw and modified samples). In testing, the temperature was increased from 40°C to 300°C at 5°C/min using nitrogen as the protective gas. In addition, the TG/DSC curves of OISS were measured through this apparatus from 40°C to 1000°C under the same test conditions.
Powdered freeze-dried Ca-bentonite (raw and modified samples) was selected to evaluate the surface morphology and composition by ESEM-EDS (SU8010, Hitachi, Tokyo, Japan). The samples were coated with electrodeposited gold under vacuum prior to analysis. ESEM analysis was performed at an accelerating voltage of 15 kV. The EDS analysis was performed on three different rectangular areas of the samples, and the results of the three rectangles were later averaged.
XRD and Ethylene Glycol (EG) Slide
Powder freeze-dried Ca-bentonite (raw and modified samples) was taken to measure the clay layer spacing by X-ray powder diffraction analysis. For the EG slide, ~40 mg of raw and modified Ca-bentonite were stirred into 0.7 mL of distilled water to form suspensions, which were spread on glass slides to air dry. Then, these slides were placed in a 45°C atmosphere of EG vapor for 8 h to allow the bentonite samples to sufficiently adsorb EG molecules. Subsequently, XRD tests were run to measure the clay layer spacings in the EG-saturated slides.
Results and Discussion
Water-Adsorption Capacity of Clays
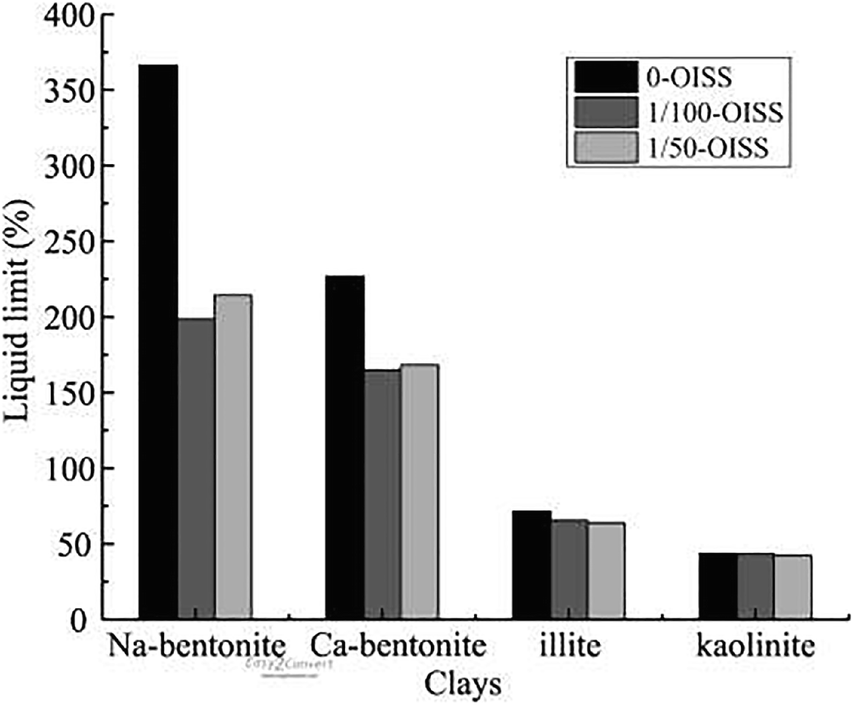
The liquid limit is one of the physical properties that demonstrates the engineering behavior of clay. This parameter reflects the macroscopic water adsorption capacity of clay and can be used to calculate the DDL thickness (Dolinar & Macuh, Reference Dolinar and Macuh2016). The liquid limit could be thought to be one of the representations of the hydration properties so that the hydration reduction of clays by using OISS could be found by decreasing the liquid limit. The liquid limits of raw and modified clays (other than for kaolinite) were measured through the disc instrument, and the results are shown in Fig. 2. An obvious decrease was observed. The disc instrument could not be used for kaolinite because it rapidly formed a connection greater than 12.7 mm in the instrument gap. Therefore, a cone liquidometer was used in this research to measure kaolinite and its liquid limit, showing little change in Fig. 2.
Liquid limits of modified clays and raw samples

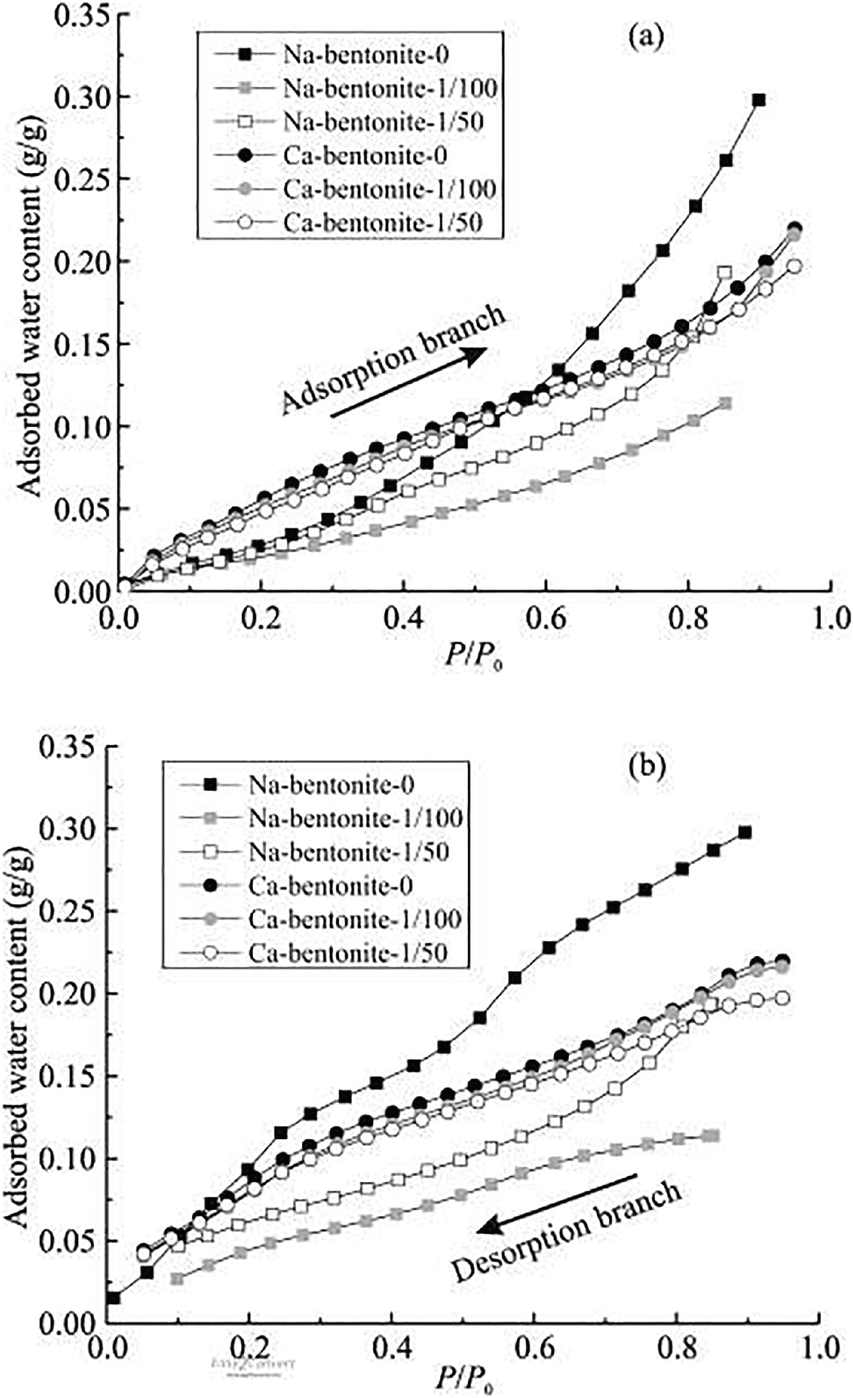
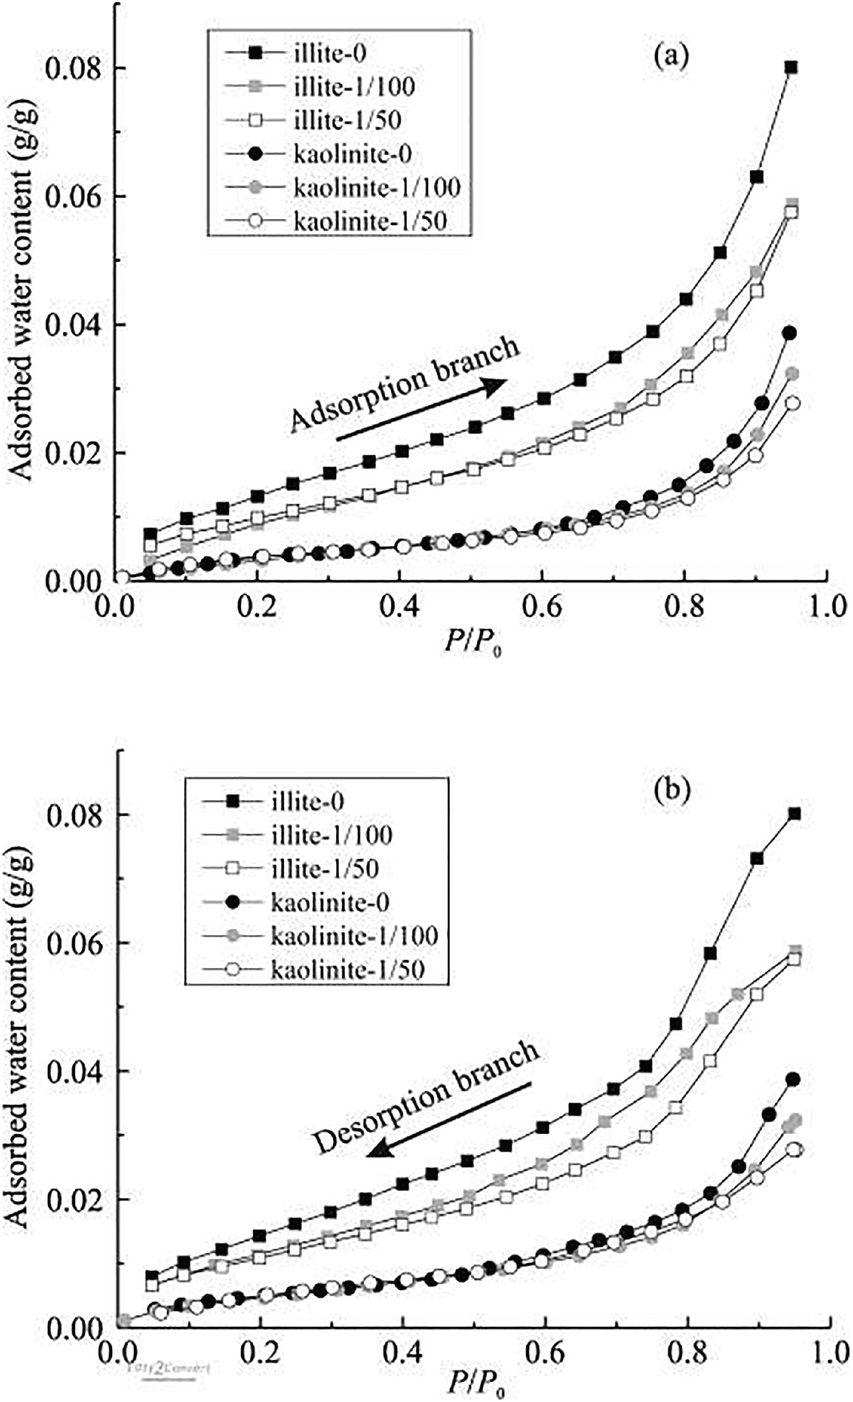
To understand the water-adsorption properties of clays, a water-vapor adsorption experiment was conducted and the results are displayed in Figs 3 and 4. A decrease in adsorption was observed when OISS was applied, indicating that OISS reduced the adsorption capacity of each clay. The water-vapor adsorption isotherms of clay minerals were dominated by the exchanged cations (Woodruff & Revil, Reference Woodruff and Revil2011; Revil & Lu, Reference Revil and Lu2013) and by the surface area (Tuller & Or, Reference Tuller and Or2005). The OISS-clay samples showed less hydrophilicity over the entire range of RH, indicating that the properties of the two hydration factors were changed. In particular, notable decreases in the adsorbed water content were observed in the RH range of ~0.2–0.9, in which hydration was affected by changes in the mineral-surface area (Tuller & Or, Reference Tuller and Or2005). These results demonstrated that the hydrophilicity of the surface of clay minerals was changed and that the two hydration factors need further exploration, especially surface hydration.
Water-vapor adsorption isotherms of Na-bentonite-0 and Ca-bentonite-0: a adsorption branch and b desorption branch

Water-vapor adsorption isotherms of illite-0 and kaolinite-0: a adsorption branch and b desorption branch

Influence of OISS on Exchangeable Cations
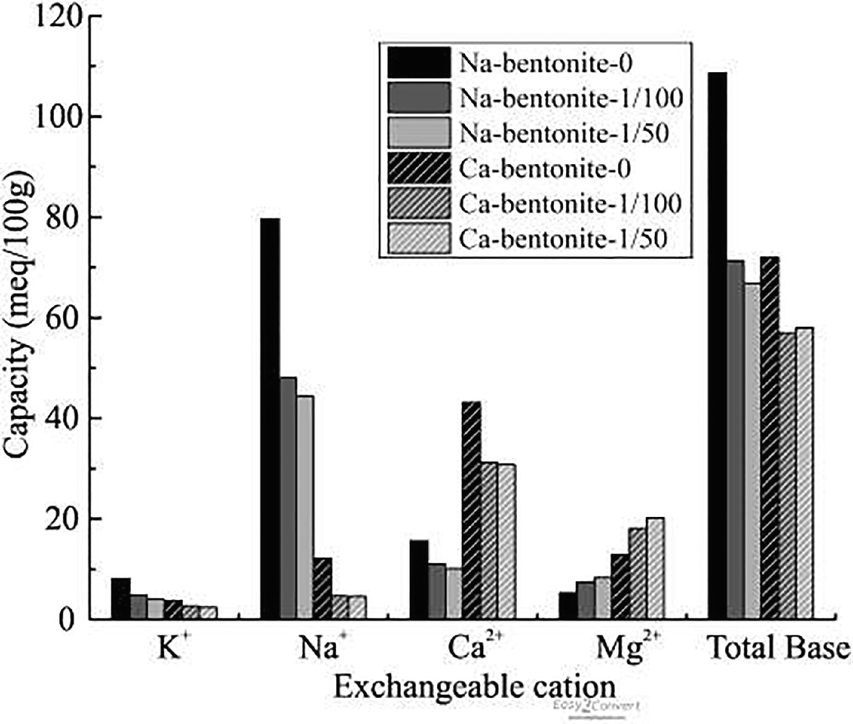
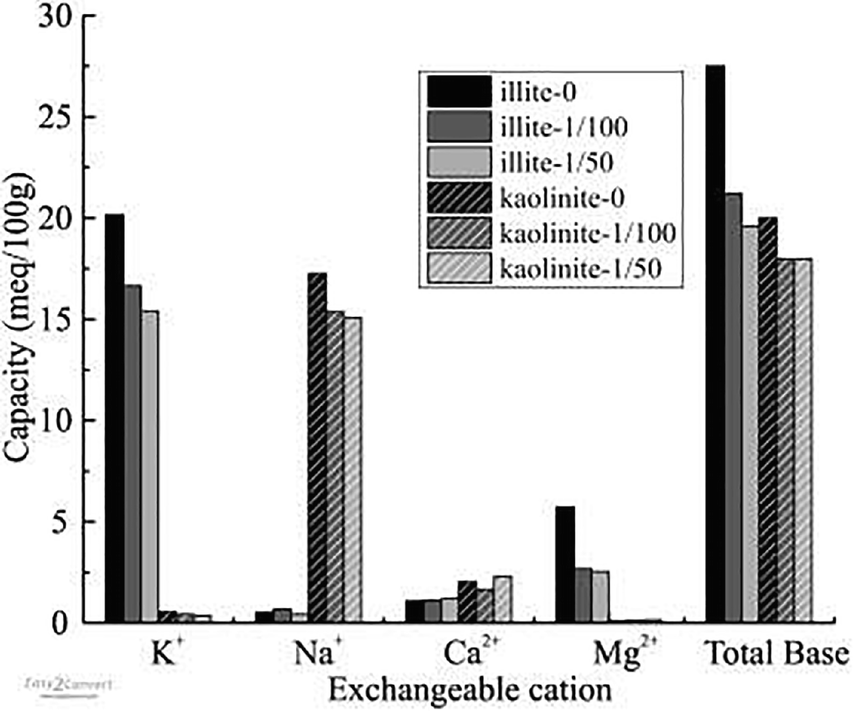
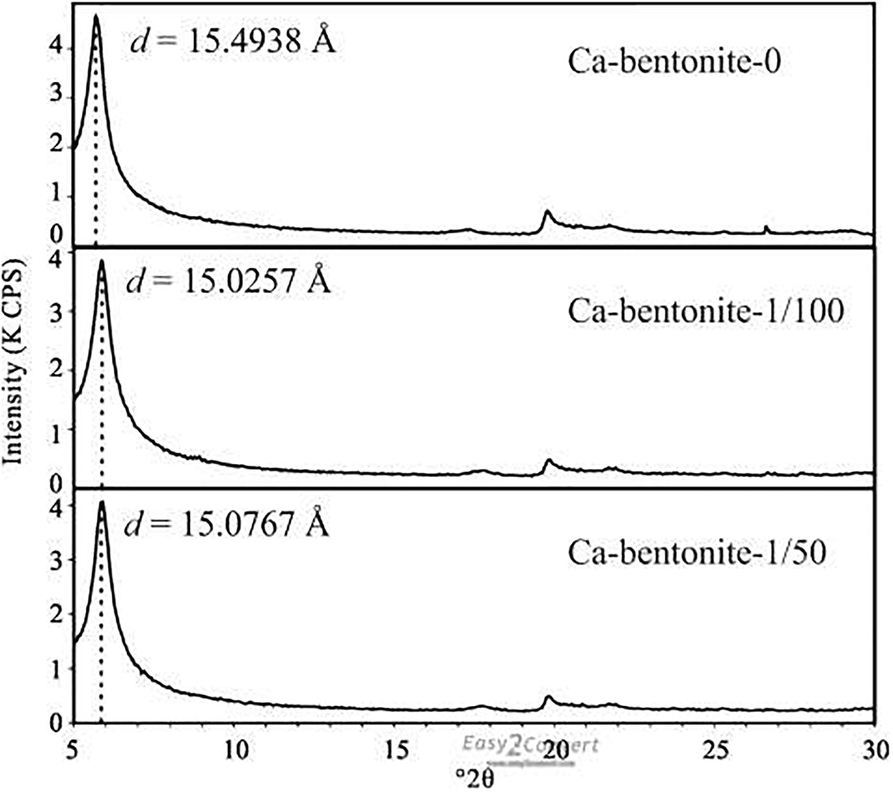
Adsorption of OISS occluded or replaced some of the inorganic exchangeable cations in all of the clays (Figs 5, 6). The total inorganic cation content of Na-bentonite-0 decreased from 108.6 meq/100 g to 71.3 and 66.8 meq/100 g in for Na-bentonite-1/50 and Na-bentonite-1/100, respectively. For Ca-bentonite the drecreases were from 71.9 to 56.7 and 58.1 meq/100 g; for illite, from 27.5 to 21.2 and 19.6 meq/100 g; and for kaolinite from 20.0 to 17.6 and 17.9 meq/100 g, respectively. The OISS was composed of macromolecules, containing long chains that could (1) cover or shield the inorganic cations from water (Mishael & Dubin, Reference Mishael and Dubin2005; Radian & Mishael, Reference Radian and Mishael2008; Cui, Reference Cui2009; Liu et al., Reference Liu, Xiang, Cui and Cao2011), thus reducing the extent of inorganic cation hydration. Furthermore, OISS is a kind of hydrosolvent that contains several dissociated ions (e.g. R-SO–3, H+) which could exchange with the inorganic cations in the clay minerals and make these cations transform to free cations that could be washed off (Cui, Reference Cui2009; Liu et al., Reference Liu, Xiang, Cui and Cao2011). The lower number of hydrated cations may explain why the d 001 value of raw Ca-bentonite decreased from 15.4938 Å to 15.0257 Å and 15.0767 Å when treated with 1/50 and 1/100 OISS, respectively (Fig. 7). Some of the decrease in clay water content was, therefore, attributed to less hydration of interlayer cations.
Exchangeable cations of modified Na-bentonite and Ca-bentonite

Exchangeable cations of modified illite and kaolinite

d 001 of freeze dried Ca-bentonite by XRD

Influence of OISS on the Surface and Microstructure
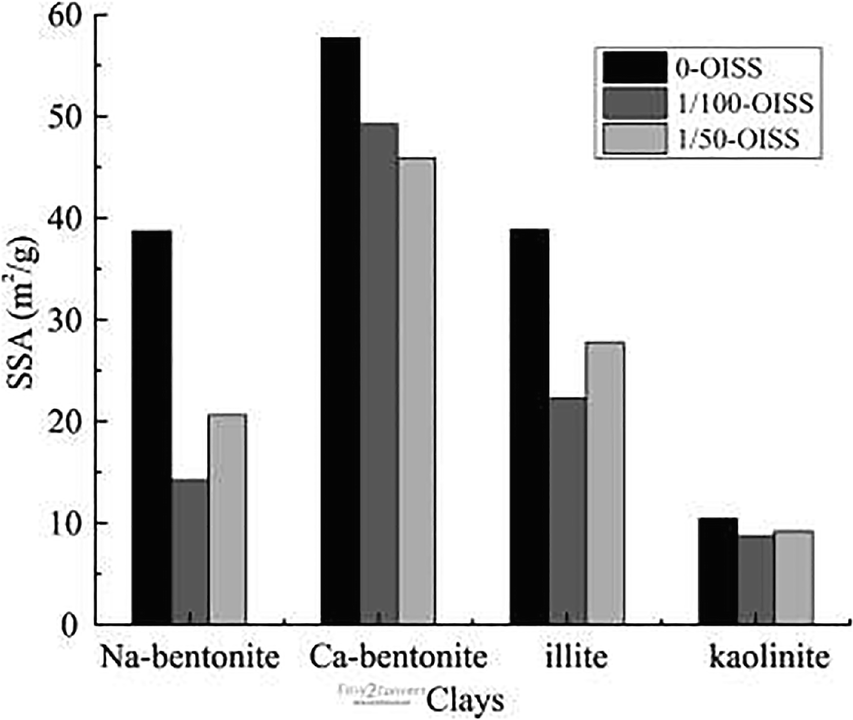
The surface is an important hydration site on clay minerals because the oxygen atom and hydroxyl groups attract water molecules through hydrogen bonding and van der Waals forces. A measurable parameter to quantify the amount of this hydration site is the specific surface area (SSA) (Maček et al., Reference Maček, Mauko, Mladenovič, Majes and Petkovšek2013). A nitrogen adsorption experiment was performed to measure the SSA of the raw and modified samples, based on BET theory (Brunauer et al., Reference Brunauer, Emmett and Teller1938). The SSAs calculated from the nitrogen adsorption isotherms are shown in Fig. 8, with decreases from 38.7 to 14.2 and 20.6 m2/g for Na-bentonite, 57.7 to 49.2 and 45.9 m2/g for Ca-bentonite, 38.8 to 22.2 and 27.8 m2/g for illite, and 10.4 to 8.7 and 9.2 m2/g for kaolinite. These results were thought to be the outcome of the clay-particle aggregation and coverage by OISS. Consequently, the SSA calculated through vapor-adsorption capacity decreased.
Specific surface area of modified clays by nitrogen adsorption

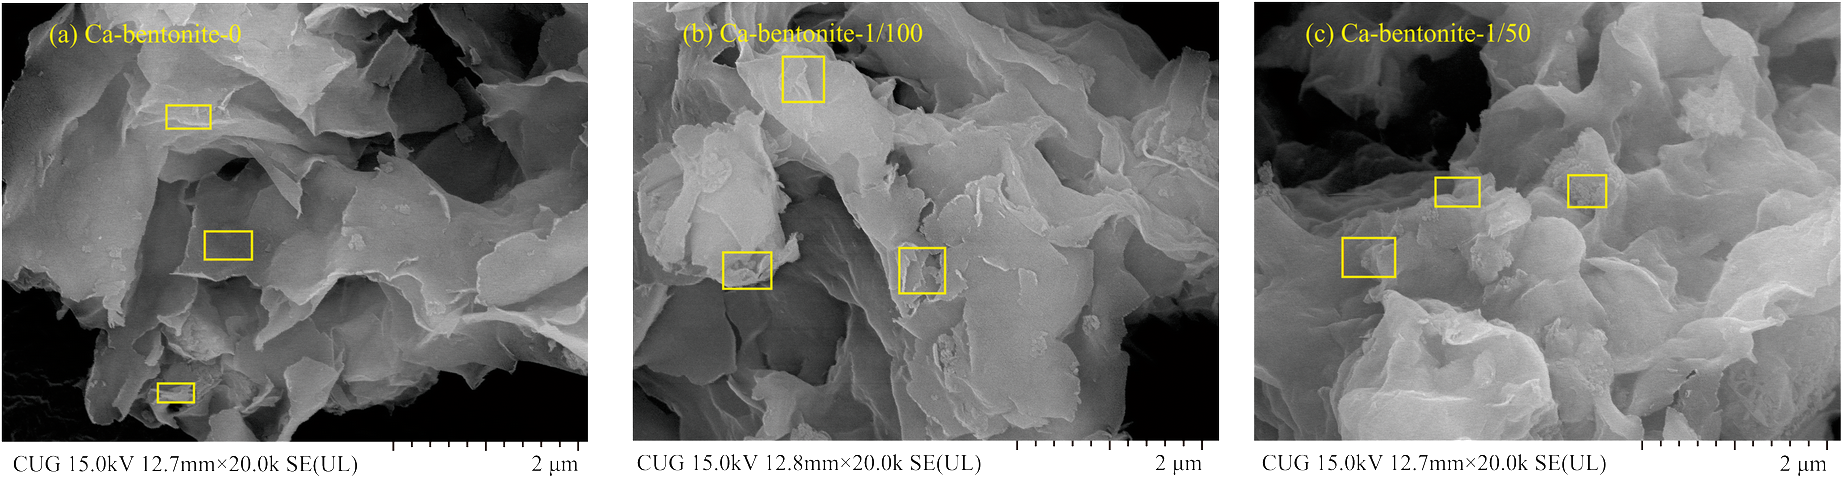
On the one hand, the long OISS chain had a cementitious quality that might aggregate the clay particles and result in a decrease in SSA. To investigate particle aggregation and changes in microstructure, ESEM was performed. The micrographs of Ca-bentonite (raw and modified samples) are shown in Fig. 9. The particles aggregated more after the addition of OISS, and the alveolate structure in Fig. 9a became insignificant in Fig. 9b and c. This indicated the cementitious quality of OISS, which could reduce the SSA. Moreover, the cementitious quality might work on a smaller scale, such as an interlayer that could not be measured by N2 adsorption. The XRD results of the EG-saturated slides of raw and modified Ca bentonite are shown in Fig. 10, with limits on the expansion of the interlayer space from 17.2062 Å to 16.6827 Å and 16.688 Å, respectively. Although the decrease in value was not significant enough to claim clay particle aggregation, it did show that the cementitious quality of OISS could affect the interlayer and regulate surface hydration.
ESEM micrographs of raw and modified Ca-bentonite with a magnification of 20,000×

Interlayer spacing, d 001, of EG-saturated slides of Ca-bentonite

The OISS molecule has a long organic chain that might cover the clay surface, however, and this could weaken the interaction between the mineral surface and water vapor. The long organic chain is composed of sulfur and carbon that are not contained in the clay minerals, as shown in Table 2. These two elements might be observed on the clay-mineral surface after modification by OISS, therefore. To investigate the surface elements, EDS matched with ESEM was used. The quadrangles marked in Fig. 9 are the measurement ranges of EDS, and the arithmetic mean values of the chemical elements measured in each quadrangle are displayed in Fig. 11. For clay with a significant montmorillonite content, e.g. Ca-bentonite, C and S are rare because they are not the main components of phyllosilicate minerals. The results of Ca-bentonite-1/100 and Ca-bentonite-1/50 showed more C and S on the surfaces of lamellae, however. C and S are the OISS eigen elements, and increases in the two elements indicated that OISS molecules were attached to the lamellae surfaces, thereby weakening the interaction between OISS and the mineral surface. In addition, the attachment of OISS on the clay surface after several washings with water demonstrated that the OISS modification was irreversible.
Chemical composition of clay surface of raw and modified Ca-bentonite by ESEM-EDS analysis

Regulation of the Hydration Properties of Clays
OISS is soluble in water and has been proven to have an obvious effect on clay-mineral hydration sites. The clays modified with OISS had less water-retention capacity than unmodified samples. After treatment with OISS, infrared results (Fig. 12) revealed a decrease in peak areas at ~3400 cm–1 and 1600 cm–1, which represent O-H stretching and bending vibrations of adsorbed H2O (Farmer, Reference Farmer1974). The hydration sites for adsorbed water were mainly exchangeable cations and found at the basal surfaces of the clay minerals. The decrease in adsorbed water indicated that the numbers of these two hydration sites were diminished by OISS. Furthermore, the H–O–H bending vibration of adsorbed water and Si–O stretching vibrations in the montmorillonite layers were coupled (Yan et al., Reference Yan, Roth and Low1996a, Reference Yan, Roth and Low1996b, Reference Yan, Low and Roth1996c), supporting the hypothesis that the OISS affected even the first few layers of adsorbed water, as evidenced by the decrease in the peak area of the ~1600 cm–1 band. In addition, a similar result can be seen in Fig. 7.
IR spectra of modified and raw clays

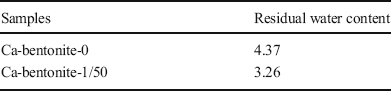
TG/DSC observations of Ca-bentonite-0 (Fig. 13a) revealed two prominent weight-loss and endothermic processes, at 77.5 and 135.5°C, which are attributed to the desorption of surface-adsorbed water and dehydration of interlayer cations (Koster van Groos & Guggenheim, Reference Koster van Groos and Guggenheim1987; Hatakeyama et al., Reference Hatakeyama, Nakamura and Hatakeyama1988; Bray & Redfern, Reference Bray and Redfern1999; Caglar et al., Reference Caglar, Afsin, Tabak and Eren2009; Lang et al., Reference Lang, Xiang, Huang and Schanz2017), respectively. The samples that were used in the test were freeze-dried bentonite which had quite a low water content, as shown in Table 5, thereby implying that free water and capillary water were not present in the samples used in the thermal analysis. Notably, the TG/DSC curve of OISS in Fig. 13d showed that OISS volatilized or disintegrated at 179.1°C, which was higher than the dehydration temperatures of montmorillonite. Therefore, the two endothermic peaks in TG/DSC curves observed for Ca-bentonite-1/50 (Fig. 13b) and Ca-bentonite-1/100 (Fig. 13c) represented the desorption of adsorbed water. The presence of OISS accounted for the decrease in temperature of the endothermic weight loss events, which decreased from 77.5 and 135.5°C to 74.6 and 119.6°C for Ca-bentonite-1/100, and to 76.7 and 114.4°C for Ca-bentonite-1/50. These results infer that water molecules escaped from the montmorillonite more easily in the presence of OISS and leads to the conclusion that OISS could regulate the hydration properties of clays.
TG/DSC curves of Ca-bentonite and OISS

Water content (wt.%) of freeze-dried Ca-bentonite (oven-dried at 105°C for 30 h)

Conclusions
The present study indicated that utilization of OISS could reduce the water-retention capacity of clay. The causes that led to a reduction in clay hydration with the use of OISS were that the amount of inorganic exchangeable cations decreased (from 108.6 to 66.8 meq/100 g for Na-bentonite, 71.9 to 56.7 meq/100 g for Ca-bentonite, 27.5 to 19.6 meq/100 g for illite, and 20.0 to 17.6 meq/100 g for kaolinite) and the specific surface area also decreased (from 38.7 to 14.2 m2/g for Na-bentonite, 57.7 to 45.9 m2/g for Ca-bentonite, 38.8 to 22.2 m2/g for illite, and 10.4 to 8.7 m2/g for kaolinite). The hydration of exchangeable cations was reduced because OISS could exchange some of them with free ions and disrupt the interaction between some cations and water molecules. XRD and ESEM-EDS results revealed that the d 001 spacing decreased in the presence of OISS, indicating indirectly a smaller capacity to hold water. Hydration of the mineral surface decreased due to the connection and hydrophobicity of the OISS long chain that covered the surface. In addition, the presence of OISS resulted in peak-area reductions in the O-H stretching and bending vibrations in the IR spectrum and a decreased dehydration temperature in the TG/DSC curves, which were directly associated with the cations and surfaces of the clay minerals.
A quantitative expression of the relationship between the water retention capacity and cation- or surface-hydration was not obtained, however. To understand the precise application of OISS, further study will be necessary to establish such a functional relationship.
Acknowledgments
This work was supported by the Sichuan Science and Technology Program (No. 2019JDRC0109), Education Reform Project of Ministry of Education (E2020040) and the National Natural Science Foundation of China (No. 41672297).
Funding
Funding sources are as stated in the Acknowledgments.
Declarations
Conflict of Interest
The authors declare that they have no conflict of interest.