


Introduction
Organic electrochemical transistors (OECTs) based on conducting polymers have undergone significant progress in recent years and are poised to become the device of choice for fabricating biosensors using semiconducting polymers.[Reference Berggren and Richter-Dahlfors1–Reference Khodagholy, Rivnay, Sessolo, Gurfinkel, Leleux, Jimison, Stavrinidou, Herve, Sanaur, Owens and Malliaras3] Owing to their ability to support both efficient ionic and electronic transport, OECTs are able to transduce biological signals, which typically involve ion flux, into electrical signals with high gain. In a typical OECT, the active material is first processed into a thin film from solution, from vapor phase, or by electrochemical deposition, onto pre-patterned source and drain electrodes. The device is then placed in contact with an electrolyte solution containing a gate electrode. During operation, application of a gate voltage induces ion exchange between the polymer and the electrolyte, which is compensated by hole injection/extraction from the source and drain electrodes. This changes the doping state of the channel, leading to a change in the source–drain current.[Reference Kim, Hong, Xie, Lee, Zhang, Lodge and Frisbie4–Reference Toss, Suspène, Piro, Yassar, Crispin, Kergoat, Pham and Berggren6] Because the electrolyte swells the polymer and allows ionic species to penetrate the bulk film, OECT devices typically exhibit an enhanced capacitance compared with field effect devices, and therefore display among the highest transconductance values in published literature.[Reference Khodagholy, Rivnay, Sessolo, Gurfinkel, Leleux, Jimison, Stavrinidou, Herve, Sanaur, Owens and Malliaras3, Reference Rivnay, Leleux, Sessolo, Khodagholy, Herve, Fiocchi and Malliaras7] Additionally the source–drain current is highly dependent on the properties of the ionic circuit, making OECTs ideal sensors in physiological environments. Neural action potentials,[Reference Barnett and Larkman8] blood filtration in the kidney,[Reference Gerich, Meyer, Woerle and Stumvoll9] and paracellular[Reference Van Itallie and Anderson10] transport in epithelial tissues are a few among many important biological processes that involve transportation of key ionic species across physiological barriers such as cells and/or fluid lipid membranes.
Of specific interest to us here is using OECTs as sensors of barrier function. Previous studies, for instance, have demonstrated that ion transport through biological barrier layers such as epithelial cell monolayers and lipid bilayer membranes can be queried by OECTs.[Reference Bernards, Malliaras, Toombes and Gruner11–Reference Tria, Ramuz, Huerta, Leleux, Rivnay, Jimison, Hama, Malliaras and Owens13] In these studies, the biological barrier is inserted between the gate electrode and the channel, either directly on top of the channel or on a Transwell filter membrane suspended between the gate and the channel. The presence of such a barrier layer effectively modulates ion migration to and from the channel, leading to changes in the transient response of the drain current. Such devices are not only useful as a sensitive diagnostic tool, but also represent good potential candidates for building biosensors. Although these experiments have been generally successful and a variety of biological barrier layers have been characterized,[Reference Tria, Jimison, Hama, Bongo and Owens14, Reference Tria, Jimison, Hama, Bongo and Owens15] a quantitative model that describes OECTs functionalized with biological barrier layers has not been developed. The exact resistances and capacitances of the lipid/cell layers of interest and how they change upon introduction of toxins, for example, are not known and would be of great importance in better understanding these physiological processes.
Here we present a detailed circuit model for biological barrier layer-functionalized OECTs as it relates to their transient response. Our results show firstly that both the biological barrier and the channel can be simply modeled by two parallel RC circuits. The time and frequency responses of the OECT, which can be experimentally queried by the application of a step or a sinusoidal gate voltage input, yield crucial information about the impedance of both the device and the biological barrier. By changing the barrier-to-device area ratio, it is possible to tune the device sensitivity. Finally, we show that depending on the specific resistance of the barrier layer of interest, which can vary by many orders of magnitude, there is an optimum device size for which quantitative characterization of the barrier layer is possible. Although we use electrical properties specific to poly(3,4-ethylenedioxythiophene) polystyrene sulfonate (PEDOT:PSS)[Reference Kim, Kee, Lee, Lee, Kahng, Jo, Kim and Lee16, Reference Ouyang, Xu, Chu, Yang, Li and Shinar17] for the channel and supported lipid bilayers (SLBs)[Reference Steinem, Janshoff, Ulrich, Sieber and Galla18] for the biological barrier layer, our modeling results are general to all organic semiconductors and biological barrier layers, and will be of use to the organic bioelectronics community as we continue to work toward building better biosensors and more effective diagnostic tools.
Description of the model
The impedance of OECTs has been previously modeled using a three-element equivalent circuit: a resistor (R d) and a capacitor (C d), in parallel with each other, representing the channel, and in series with a resistor related to the electrolyte solution (R s).[Reference Khodagholy, Rivnay, Sessolo, Gurfinkel, Leleux, Jimison, Stavrinidou, Herve, Sanaur, Owens and Malliaras3] To build a biosensor or diagnostic tool out of these devices, we insert a barrier layer in between the gate and the channel, which controls ion flux between the two electrodes. For more flexibility, the barrier sits on a support substrate with a defined hole of diameter L bl and area A bl. The device area, on the other hand, is defined by its length (L d) and area (A d) [Fig. 1(a)]. The barrier-to-device area ratio can then be defined as the ratio between A bl and A d. In terms of an equivalent circuit, this barrier layer is modeled as a resistor and capacitor in parallel with each other (R bl and C bl), and in series with the circuit elements representing the OECT [Fig. 1(b)]. According to this model, application of a positive gate voltage (V in) results in migration of cations toward the channel. This ionic transport is determined by the electrolyte resistance R s, and is modified by the properties of the barrier layer, described by C bl and R bl. This, in turn, determines the voltage at the electrolyte/channel interface, V ch, which can be considered as the effective gate voltage that acts on the channel and determines the drain current. Our aim is, therefore, to explore the dependence of V ch on the different circuit elements that define the model.
(a) Schematic of a barrier layer-functionalized OECT and (b) the equivalent circuit used for modeling the electrical response.

To solve for V ch, we first determine the impedances in the Laplace domain for the three principal circuit components, namely the barrier layer (Z bl), the electrolyte solution (Z s) and the PEDOT:PSS channel (Z d):
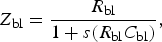 $$Z_{{\rm bl}} = \displaystyle{{R_{{\rm bl}} } \over {1 + s\lpar R_{{\rm bl}} C_{{\rm bl}} \rpar }}\comma \; $$
 $$Z_{\rm s} = R_{\rm s}\comma \; $$
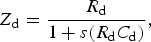 $$Z_{\rm d} = \displaystyle{{R_{\rm d} } \over {1 + s\lpar R_{\rm d} C_{\rm d} \rpar }}\comma \; $$
V ch can then be simply calculated in terms of the three impedances and the input voltage:
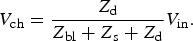 $$V_{{\rm ch}} = \displaystyle{{Z_{\rm d} } \over {Z_{{\rm bl}} + Z_{\rm s} + Z_{\rm d} }}V_{{\rm in}} .$$
Finally, we perform an inverse Laplace transform to yield V ch as a function of time (see supporting information). Depending on the nature and shape of V in, V ch will vary over time with a characteristic shape that depends not only on V in but also on the three impedances, which can be determined in practice by measuring the transient characteristics of the device. In the next few sections, we will present two complementary experimental methods that can be used and how the device characteristics change as a function of OECT and barrier layer properties.
For the OECT we use parameters (R s = 1.8 kΩ, R d = 18 MΩ, and C d = 150 nF), determined for a device with a PEDOT:PSS channel with an area of 50 mm2 and saline as the electrolyte.[Reference Khodagholy, Rivnay, Sessolo, Gurfinkel, Leleux, Jimison, Stavrinidou, Herve, Sanaur, Owens and Malliaras3] For the barrier layer, we use parameters (R bl = 10 kΩ cm2 and C bl = 1 µF cm−2)[Reference Khodagholy, Rivnay, Sessolo, Gurfinkel, Leleux, Jimison, Stavrinidou, Herve, Sanaur, Owens and Malliaras3, Reference Steinem, Janshoff, Ulrich, Sieber and Galla18] that are characteristic of SLBs, although extension of the model to other barrier layers is straightforward. In contrast to lipid vesicles or natural cell membranes, SLBs generally refer to a planar structure wherein the bilayers are situated on a supporting substrate. SLBs can be made using a plethora of different methods, generally exhibit high impedances (up to 10–100 kΩ cm2), and have been shown to act as a good barrier for ions.[Reference Steinem, Janshoff, Ulrich, Sieber and Galla18] SLBs are also among the most stable lipid membranes and can be used for over several days. In addition, these membranes very closely resemble the chemical surface of real cells and their flexibility allows us to incorporate a wide variety of channel proteins for specific sensing purposes.[Reference Castellana and Cremer19]
Results and discussion
We consider two experimentally relevant situations, one where the transient characteristics of the OECT are probed by the application of a voltage step at the gate and one where a sinusoidal voltage is applied at the gate. We want to point out here that, although the simulated results below are plotted in a large range of frequencies to demonstrate the overall trend in device response, it is only feasible to experimentally apply and measure frequencies up to ~100 MHz.
Step voltage input
We consider the application of a positive voltage pulse (V 0) of 1 V, relative to the ground, applied to the gate from time 0 to t 0. Upon turning on this gate voltage, cations will migrate toward the channel, leading to an increase in V ch.
In Fig. 2(a), we plot V ch as a function of time for several barrier-to-device area ratios and also for the case where no lipid membrane is present (V control). Firstly, we notice that when no lipid membrane is present, there exists a single exponential increase in V ch over time with an expected characteristic RC time of 2.7 × 10⁻⁴ s (0.27 ms). As soon as the membrane is added to the circuit, V ch begins to exhibit two different time constants. The fast charging kinetics with characteristic time τ fast represents charging of the lipid membrane, which depends mainly on C bl and R s, whereas the slower charging time τ slow represents charging of the channel and depends on all circuit elements [Fig. 2(b)]. In most cases, τ slow is of greatest interest as it characterizes how the device operation is affected by the presence of the lipid membrane. As we decrease the area of the lipid membrane with respect to the device area, the charging kinetics changes. This can be experimentally done by depositing lipid bilayers on well-defined hole-containing substrates (glass, polycarbonates, etc.), where the diameter of the holes can be reduced to the nanometer scale. For instance, decreasing the membrane area also decreases C bl and results in a shorter charging time for the lipid bilayer. This is reflected in the exponential decrease of τ fast as expected. On the other hand, R bl increases with the decreasing membrane area and results in an increase in the charging time for the OECT device, hence the exponential increase in τ slow. Interestingly, τ slow does eventually reach a plateau for barrier-to-device area ratios below ~100:1. In this regime, which will be later explained in more detail, the device resistance becomes the dominating factor in determining charging time. As a result, the impedance of the lipid bilayer is difficult to determine. Finally, we also notice here that when the lipid membrane becomes too big (>106:1), the time constants approach that of the pristine OECT and the impedance of the membrane becomes too small to be sensed by this device.
Plots of simulated (a) V ch as a function of time and (b) τ as a function of barrier-to-device area ratio. As shown, we clearly observe two different charging kinetics, which are exemplified by the time constants τ slow and τ fast.
Sinusoidal voltage input
A second method for characterizing the ionic response in OECTs is to apply a sinusoidal voltage input. Here we are probing the frequency-dependent response of the device using a sine wave input voltage,
 $$V_{{\rm in}} = V_{\rm o} \sin \, \lpar 2\pi\, ft\rpar \comma \; $$
where V o is the voltage amplitude, here 1 V, and f represents the wave's frequency. As a result, V ch is also sinusoidal and we are concerned mainly with the maximum value (see supporting information for more details).
In Fig. 3(a), we plot the maximum V ch as a function of frequency for different barrier-to-device area ratios. The results closely match those in Fig. 2(a), although represented here in frequency space, and show that this type of measurement can also effectively detect changes in OECTs kinetics. This effect is more clearly demonstrated in Fig. 3(b), where we show that V ch varies exponentially with membrane areas for all frequencies. As with the previous section, these measurements indicate that there are some fundamental limits to characterizing membrane impedances using OECTs. At low frequencies (<10 mHz), for instance, V ch remains constant as a function of membrane areas for large area ratios, indicating that the device cannot sense these particular membranes. In addition, for both high (>50 Hz) and low (<10 mHz) frequencies, V ch is relatively constant as a function of frequency. Hence there appears to be a range of membrane areas and input frequencies over which the device is most sensitive to the presence of the membrane. As will be shown in the next section, this optimal range of operation is related to the impedance of the solution and the PEDOT:PSS channel, and can be tuned by changing the device area.
Plots of simulated V ch as a function of frequency (a) and barrier-to-device area ratio (b).
Geometrical requirements for sensing
Above we have demonstrated how modeling of the channel voltage response can be useful in determining the impedances of both device and membrane. Now we want to estimate the detection limit of OECTs and its dependence on device geometry. Since impedances within the ionic circuit are dependent on the device area, it is natural to expect that the observed time responses also exhibit the same dependency. Here we use R s, R d, and C d values for PEDOT:PSS devices of different areas obtained via impedance spectroscopy. Although the complete results and data interpretation will be published elsewhere, we have compiled a small list of values for device areas ranging from 100 to 108 µm2 (see supporting information). Figure 4 shows plots of τ slow and steady-state V ch in a step pulse experiment (V in = 1 V) as a function of membrane layer resistance for different device areas. Here we envision the case when the membrane of interest is grown directly on the OECT channel (i.e., a 1:1 membrane-to-device area ratio).
Plots of simulated τ slow (a) and V ch (b) as a function of membrane layer resistance for different device areas. The three different regimes are shown in the inset of (a). The inset of (b) more clearly demonstrates the transition from the optimal operation regime to the device-dominated regime.
As shown, there exist three distinct kinetic regimes for all device areas, which are more clearly demonstrated by the insets in Fig. 4. Firstly, below a certain threshold τ slow and V ch remain nearly constant as a function of membrane resistance. This indicates that the device cannot “sense” the presence of the membrane in this range and is explained by the fact that the membrane resistance is too low with respect to the solution resistance R s. In other words, the membrane layer does not significantly hinder ion flow to the device. We call this the electrolyte-dominated regime. Secondly, above a particular threshold, τ slow begins to increase exponentially as a function of membrane resistance. The variation occurs over ~3–4 orders of magnitude in both time and resistances. In this range of membrane resistance, which we call the optimal operation regime, the membrane slows down ion flow similar to a bottleneck effect. However, the total number of ions reaching the channel is practically unchanged and explains why the steady-state (i.e., at long times) V ch remains nearly constant. Thirdly, in the device-dominated regime, the membrane resistance is too high with respect to R d, resulting in a plateau in τ slow and an exponential decrease in V ch. The inset in Fig. 4(b) clearly demonstrates that these changes and the crossover of these two parameters are marked by the dotted red line. As a whole, these trends can be explained by the fact that, under an applied voltage (V in), ions migrate to the channel with a flux that is dictated by R s and R bl. The ions arriving at the channel charge the device with a capacitance that corresponds to the bulk of the film rather than its geometric area, which is generally attributed to the ability of these polymers to uptake water and be swelled. However, there also exists a leakage current to the metal contacts that is dictated by R d. When R s and R bl become too large, the current reaching the channel cannot compensate for the leakage current. Therefore the steady-state capacitance on the device, which is dependent on V ch, decreases and the time-dependent kinetic (τ slow) no longer increases. It is important to note that when V ch has dropped by ~2–3 orders of magnitude, it becomes very difficult to experimentally detect modulations of the drain current (V ch ~ 0) and the device response can no longer be used to quantify the impedances of the membrane layer.
It is important to note that the different thresholds presented above all scale with increasing device area and represent an important gauge in assessing the detection limits of OECTs. A device size of 5 × 108 µm2 (5 cm2), for instance, cannot detect cell membrane resistances of less than ~10 Ω cm2. On the other hand, while decreasing the device area to 50 µm2 allows for very sensitive detection, such a device cannot be used to quantitatively characterize membrane resistances greater than ~100 Ω cm2. Although well-formed lipid bilayers can exhibit relatively high impedances, the same does not hold true for other biological membranes such as cell layers. Epithelial cell layers, for instance, exhibit resistances between 10 and 104 Ω cm2 while non-epithelial cells can have resistances much less than 1 Ω cm2.[Reference Moore, Fischer, Mead and Hackstadt20, Reference Montal and Mueller21] The results presented here thus have two major implications on the use of OECTs in monitoring in vitro grown lipid bilayers and cell membranes. The first implication is related to scaling the device areas for different applications. For instance, although larger devices exhibit a larger capacitance and hence a higher transconductance, they cannot sense leaky membranes. Conversely, micron-sized devices are fast enough though the modulated drain current's signal-to-noise ratio may be significantly smaller. Thus it is imperative that the device operates within the optimal operation regime (see Section C in the supporting information for more details). Finally, the modeled results clearly demonstrate that, by properly adjusting the area of OECTs, it is possible to sense vesicle-ruptured, fluid lipid bilayers (~10 kΩ cm2) and even epithelial cell layers (>100 Ω cm2) alike. What is more exciting, however, is that OECTs have the potential to also sense leaky epithelial and non-epithelial cell layers. To more clearly demonstrate this point, consider the measured transepithelial electrical resistance (TEER) for different cell lines. Although the growth of renal and intestinal epithelial cell layers such as MDCK1 and Caco2 on Transwell filters can be easily monitored, the same is not true for certain endometrial epithelial cells such as HEC-1-B and HeLa, the TEER of which are too far below the measurement detection limit of ~20–30 Ω cm2.[Reference Moore, Fischer, Mead and Hackstadt20, Reference Grasset, Pinto, Dussaulx, Zweibaum and Desjeux22, Reference Arthur23] However, OECTs would be able to sense such layers with quantitative accuracy if they are grown directly onto the device, thereby fulfilling the currently missing gap in the characterization of all in vitro grown cell layers.
Conclusions
In this paper, we present a circuit model for barrier-functionalized OECTs as potential biosensors and diagnostic tools. The device of interest here consists of a PEDOT:PSS channel, a biological barrier layer such as a lipid bilayer membrane or a cell monolayer, and a gate electrode, all immersed in an electrolyte solution. Our results show, firstly, that both the application of a step voltage or a sinusoidal modulation at the gate can be used to extract the impedances of all components within the system. Secondly, we demonstrate that given the widely known impedances for lipid bilayer membranes (~10 kΩ cm2), it is possible to build a sensor platform by coupling such membranes to OECT devices. We find that the detection limit of OECTs in sensing the presence of barrier layers is dependent on the barrier layer area, the device area, and the particular resistance of the barrier layer of interest. Smaller device areas and barrier-to-device area ratio, for instance, are more favorable in sensing experiments. Finally, we find that small OECTs with areas between 50 and 100 µm2 should have the capability to detect membrane resistances significantly less than 1 Ω cm2. These devices will thus pave the way for novel, ultrasensitive characterization experiments of both in vitro and in vivo grown cellular membranes, and have the potential to drastically change how biosensing and diagnostics are performed.
Supplementary materials
For supplementary material for this article, please visit http://dx.doi.org/10.1557/mrc.2014.35
Acknowledgments
A.S. gratefully acknowledges financial support from the National Science Foundation (DMR 1205752 award). G.C. Faria acknowledges INCT/INEO and the Fundação de Amparo à Pesquisa do Estado de São Paulo (FAPESP) for financial support through project numbers 2008/57706-4 and 2013/21034-0. D.T.D acknowledges the support of the Stanford Graduate Fellowship and the National Science Foundation Graduate Research Fellowship. D.T.D. further acknowledges the Chateaubriand Fellowship and the Polymed project for travel funding. J.R. acknowledges a Marie Curie postdoctoral fellowship.



