INTRODUCTION
Information processing speed impairments are among the most significant cognitive deficits observed in persons with multiple sclerosis (MS) (e.g., DeLuca et al., Reference DeLuca, Chelune, Tulsky, Lengenfelder and Chiaravalloti2004; Denney et al., Reference Denney, Lynch, Parmenter and Horne2004; Nocentini et al., Reference Nocentini, Pasqualetti, Bonavita, Buccafusca, De Caro, Farina, Girlanda, Le Pira, Lugaresi, Quattrone, Reggio, Salemi, Savettieri, Tedeschi, Trojano, Valentino and Caltagirone2006). Processing speed has typically been defined as the execution time needed to carry out a cognitive task or the amount of work conducted in a certain period of time. Processing speed deficits have been reported to underlie other cognitive impairments in MS, such as working memory (DeLuca et al., Reference DeLuca, Chelune, Tulsky, Lengenfelder and Chiaravalloti2004; Demaree et al., Reference Demaree, DeLuca, Gaudino and Diamond1999; Lengenfelder et al., Reference Lengenfelder, Bryant, Diamond, Kalmar, Moore and DeLuca2006) and episodic memory (Arnett, Reference Arnett2004; DeLuca et al., Reference DeLuca, Barbieri-Berger and Johnson1994; Gaudino et al., Reference Gaudino, Chiaravalloti, DeLuca and Diamond2001), and may be related to quality of life (Barker-Collo, Reference Barker-Collo2006). Despite the significant impact of processing speed in MS, the functional neural networks involved in processing speed deficits in MS have yet to be investigated. The purpose of the current study was to examine the cerebral mechanisms associated with processing speed deficits in MS using functional magnetic resonance imaging (fMRI).
Processing speed impairments in MS have been assessed by several neuropsychological tests including the Paced Auditory Serial Addition Task (PASAT) (e.g., Archibald & Fisk, Reference Archibald and Fisk2000; Litvan et al., Reference Litvan, Grafman, Vendrell and Martinez1988) and the Sternberg task (Arnett, Reference Arnett2004; Litvan et al., Reference Litvan, Grafman, Vendrell and Martinez1988). It is unclear whether poor performance on these tasks is actually a result of deficient processing speed, working memory, or both (Lengenfelder et al., Reference Lengenfelder, Bryant, Diamond, Kalmar, Moore and DeLuca2006). In the current study, it was a goal to examine the neural correlates associated with rapid decision making by using a modified version of the Symbol Digit Modalities Task (mSDMT) (Smith, Reference Smith1982). The SDMT is a task of complex scanning and visual tracking (Shum et al., Reference Shum, McFarland and Bain1990), as well as processing speed with minimal working memory involvement, which has been consistently shown to be highly sensitive to processing speed impairments in MS (e.g., Henry & Beatty, Reference Henry and Beatty2006; Nocentini et al., Reference Nocentini, Pasqualetti, Bonavita, Buccafusca, De Caro, Farina, Girlanda, Le Pira, Lugaresi, Quattrone, Reggio, Salemi, Savettieri, Tedeschi, Trojano, Valentino and Caltagirone2006; Sepulcre et al., Reference Sepulcre, Vanotti, Hernandez, Sandoval, Caceres, Garcea and Villoslada2006). In fact, the SDMT has been reported to be the most sensitive test to assess cognitive impairment in MS from the Minimal Assessment of Cognitive Function in MS battery (Benedict et al., Reference Benedict, Cookfair, Gavett, Gunther, Munschauer, Garg and Weinstock-Guttman2006), and recently, it has been suggested to be highly effective in screening for cognitive impairment in MS (e.g., Deloire et al., Reference Deloire, Bonnet, Salort, Arimone, Boudineau, Petry and Brochet2006; Parmenter et al., Reference Parmenter, Weinstock-Guttman, Garg, Munschauer and Benedict2007).
Much of our knowledge of the neural networks in processing speed has been inferred from functional neuroimaging studies of working memory in healthy adults and clinical samples. Studies to date indicate that performance of tasks that involve both rapid information processing and working memory often include a network comprising PFC (Lazeron et al., Reference Lazeron, Rombouts, de Sonneville, Barkhof and Scheltens2003; Rypma et al., Reference Rypma, Berger, Genova, Rebbechi and D’Esposito2005, Reference Rypma, Berger, Prabhakaran, Bly, Kimberg, Biswal and D’Esposito2006), anterior cingulate (ACC) (Hester et al., Reference Hester, Fassbender and Garavan2004; Mainero et al., Reference Mainero, Caramia, Pozzilli, Pisani, Pestalozza, Borriello, Bozzao and Pantano2004), and precuneus (Lazeron et al., Reference Lazeron, Rombouts, de Sonneville, Barkhof and Scheltens2003). However, these studies have utilized tasks that are confounded by both working memory and processing speed (i.e., PASAT). Thus, it was a goal of the current investigation to examine activation in the PFC, ACC, and precuneus during a task of processing speed (with minimal working memory confounds) in order to determine their role in modulating rapid information processing in MS. Based on previous investigations of working memory in MS which often show recruitment of additional brain regions compared to healthy controls (HCs), it was predicted that the MS group would show additional activation in these regions in the current study.
Recently, studies have begun to directly examine the relationship between brain activation and behavioral performance in individuals with MS. For example, prior work in our laboratory has demonstrated that those regions that were significantly more active in individuals with MS compared to HCs were negatively correlated with behavioral performance (Chiaravalloti et al., Reference Chiaravalloti, Hillary, Ricker, Christodoulou, Kalnin, Liu, Steffener and DeLuca2005; Hillary et al., Reference Hillary, Chiaravalloti, Ricker, Steffener, Bly, Lange, Liu, Kalnin and DeLuca2003). In order to focus on processing speed specifically, we anticipated that the amplitude of BOLD response in those regions activated by the MS group would be associated with slower performance on the mSDMT.
METHOD
Participants
The study included 33 right-handed participants: 17 HC participants without any reported medical disabilities and 16 participants with MS. Twelve MS participants were diagnosed with clinically definite MS and four had clinically probable MS (Polman et al., Reference Polman, Reingold, Edan, Filippi, Hartung, Kappos, Lublin, Metz, McFarland, O’Connor, Sandberg-Wollheim, Thompson, Weinshenker and Wolinsky2005). Furthermore, 12 had relapsing–remitting MS, 3 had primary-progressive MS, and 1 had a secondary-progressive course. Fourteen of the 16 subjects were on disease-modifying agents (i.e., interferon β 1a and β 1b and glatimer acetate), but none were on medications that would affect scanner performance (i.e., stimulants, sedatives). Subjects were recruited regardless of cognitive or physical abilities. The average time since disease diagnosis was 6.4 years (SD = 4.9). In all cases, lesions consistent with MS were confirmed by a neuroradiologist (S.R.). Two additional MS subjects were excluded because of abnormally low responding in the scanner, indicative of noncompliance (e.g., multiple strings of 7–10 trials without a response and accuracy levels of 2 standard deviations below the average for both controls and the MS sample). The age of the HC group ranged from 22 to 55 years (M = 37.9, SD = 10.7), with a mean education level of 15.7 years (SD = 2.3). The age of the MS group ranged from 23 to 55 years (M = 41.3, SD = 7.4) and had a mean of 15.7 years of education (SD = 1.9). The difference between the HC and MS groups on age [t(31) = 1.05, p = .304] and years of education [t(31) = .08, p = .94] did not differ significantly. Although there were more women in the MS group (11/16) compared to the HCs (9/17), the gender proportions also did not differ significantly across the MS and HC groups [χ 2(1) = .863 p = .35].
MS participants were at least 1-month post most recent exacerbation, if any, and free of corticosteroid use at the time of testing. If a subject was experiencing an exacerbation at the time of the screening interview, he or she was told to wait for a month following the end of the exacerbation before he or she could participate. All participants underwent a screening interview before participation in the study during which they were asked questions related to their medical and psychiatric history. Participants were excluded if they had previously been admitted to an alcohol/drug treatment program, were previously diagnosed with a neurological disorder (e.g., stroke, seizure disorder), or had ever sustained a head injury. Additionally, participants were excluded if they had a history of psychiatric illness, such as schizophrenia, bipolar disorder, or obsessive–compulsive disorder. Because of the comorbidity of depression and anxiety with MS, subjects reporting a history of severe depression and/or anxiety (defined as inpatient treatment) or were currently on medications for depression which would affect scanner performance (Valium, Lithium) were excluded from the current study. However, given these criteria, no subjects were excluded. Consistent with the policy of the University Heights Center for Advanced Imaging at the University of Medicine and Dentistry of New Jersey (UMDNJ), exclusionary criteria also included the presence of metal in the body (e.g., cochlear implants, pacemakers), determined by a metal screening form and metal detector, or pregnancy. No subjects were excluded based on these criteria. Additionally, any subject requiring glasses in order to see the fMRI stimuli were provided with MRI-compatible glasses during the scan.
General Procedure
All subjects signed informed consent forms approved by the Institutional Review Boards of Kessler Foundation Research Center and UMDNJ prior to final enrollment in the study, and all study procedures complied with HIPAA and Institutional Review Board standards. All research was completed in accordance with the Helsinki Declaration. Each participant received $50 for his or her participation in the study (approximately 3 hrs).
Neuropsychological Testing Procedure
On the same day as the MRI scanning, a battery of neuropsychological tests was administered to each participant to assess neuropsychological functioning. This battery assessed common cognitive functions known to be impaired in individuals with MS, such as processing speed [assessed by the SDMT—oral version (Smith, Reference Smith1982) (which was always administered following the fMRI), Trail-Making Test (TMT) A and B (Reitan, Reference Reitan1958), Letter and Symbol Cancellation Tasks (Caplan, Reference Caplan1985), and PASAT (Brittain et al., Reference Brittain, La Marche, Reeder, Roth and Boll1991)], working memory [assessed by the Digit Span subtest of the Wechsler Adult Intelligence Scale (third version) (WAIS-III) (Wechsler, Reference Wechsler1997)], and new learning (assessed by Hopkins Verbal Learning Task (Brandt & Benedict, Reference Brandt and Benedict2001). To assess general intelligence, the Wide Range Achievement Test 3, Reading Subtest (Wilkinson, Reference Wilkinson1993) and Matrix Reasoning (WAIS-III; Wechsler, Reference Wechsler1997) were administered.
Behavioral Task in the Scanner
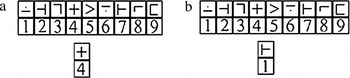
The cognitive paradigm used to assess processing speed was the mSDMT (also referred to as the modified Digit Symbol Substitution Task and modified for scanner usage; Rypma et al., Reference Rypma, Berger, Prabhakaran, Bly, Kimberg, Biswal and D’Esposito2006; Smith, Reference Smith1982). Modifications included the responses via left- and right-thumb key-press to minimize head movement in the scanner. While in the scanner, subjects viewed a panel of nine paired stimulus boxes projected onto a screen (Figure 1). The boxes in the upper row each contained a symbol, and the boxes in the lower row each contained a digit (1–9). Below the panel of boxes were two paired “probe” boxes containing a digit and a symbol. The subject was required to determine if the probe pair matched any of the corresponding pairs of stimulus boxes above and then respond “match” or “no match” by making a right- or left-thumb key-press, respectively. Subjects were instructed to respond as quickly as possible, making as few mistakes as possible.
(a and b) Illustration of the mSDMT. (a) illustrates an example of a “match” and (b) illustrates an example of a “nonmatch.”

The subject had up to 6 s to respond to each stimulus presentation, during which time the stimulus remained on the screen. To minimize learning or practice effects and to minimize the working memory load, the nine symbol–digit pairings changed with every presentation so that the same symbols did not always appear with the same numbers. Both the panel of nine paired stimulus boxes and the probe box appeared on the screen simultaneously, further reducing working memory requirements. In addition, the task did not require mental manipulation of stimulus information, thereby virtually eliminating the central executive component of WM in completing the mSDMT.
For all subjects, there were four trials, and each trial lasted 7 min 48 s and contained 225 TRs, for a total task time of 31.2 min. In sum, there were a total of 256 “events” where subjects were required to respond to stimuli. Following each event, there was a variable intertrial interval lasting 0, 4, 8, or 12 s. The RT and accuracy of each response were recorded.
An overview of the fMRI task procedures was provided to all participants prior to scanning in order to familiarize each subject with the task. At this time, all subjects were given time to practice the task.
MRI Procedure
Neuroimaging was performed at UMDNJ on the Siemens Allegra 3T MRI. Whole-brain axial T1-weighted conventional spin-echo images (in-plane resolution = 0.859 mm2) for anatomic overlays (TR/TE = 450/14 ms, contiguous 5 mm, 256 × 256 matrix, FOV = 24 cm, NEX = 1) were obtained before fMRI. Functional imaging consisted of multislice gradient echo, T2*-weighted images acquired with echoplanar imaging (EPI) methods (TE = 30 ms, TR = 2000 ms, FOV = 24 cm, flip angle = 80°, slice thickness = 5 mm contiguous, matrix = 64 × 64, in-plane resolution = 3.75 mm2). In order to provide coverage of the entire brain, a total of 32 images in the axial plane were acquired. In order to provide an additional set of T2-weighted structural images for MS lesion identification and quantification, a set of coplanar T2-weighted FLAIR-EPI structural images with identical parameters was also obtained without a task paradigm.
Data Analysis
Preprocessing and analysis of the fMRI data were performed using the Analysis of Functional NeuroImages (AFNI) software (Cox, Reference Cox1996). For each of the four runs, from each of the subjects, the first nine volumes were excluded in order to control for saturation effects. The functional data were then time-shifted so that the slices had the same temporal origin (i.e., the mean TR for all the slices in each acquisition) and spatially registered to the first acquisition in the first run (after removing the first nine acquisitions) to correct for any head motion. The motion parameters were saved and included in the deconvolution as regressors. The data were spatially smoothed with an 8-mm3 Gaussian kernel using the “3dBlurToFWHM” program, which ensured that the data had the specified smoothness and also did not smooth the data beyond the borders of the brain. The data were converted into percent signal change and then analyzed with a multiple regression (deconvolution). The hemodynamic response was modeled with a gamma function that was fixed in time but allowed to freely vary in amplitude to fit the data. Two analyses were conducted. The first fits a single Gamma function to the data: this modeled the basic neural response to the mSDMT in both groups. The second added an amplitude-modulated (AM) regressor to this model (i.e., each event was modeled with two regressors). The amplitude of the AM regressor varied as a function of the RT on each trial. The beta weights from both analyses were extracted and entered into separate random-effects analyses: one to investigate the “basic” brain response to the mSDMT in the two groups and the other to investigate the areas that showed responses that covaried with RT.
The anatomical T1 data were co-registered to the functional data and then warped into standard Talairach space. The warping parameters were later used to warp the results of the analysis of the functional data (the deconvolution) into Talairach space.
Correction for multiple comparisons was achieved by using Monte Carlo simulations (AlphaSim, part of the AFNI suite of programs). In the simulation, the correlation between neighboring voxels was modeled by applying a Gaussian filter that was equivalent to that used in the preprocessing of the functional data (8 mm3). With the individual voxel probability set to .005, the minimum cluster size for a family-wise error of p < .05 is 27 contiguous voxels. Those events during which the subject responded incorrectly or failed to respond were excluded from the fMRI analysis. Because most subjects responded with 95–100% accuracy throughout the task, the number of responses excluded from the analyses was negligible.
Analyses performed included a random-effects analysis to examine what brain regions were active during mSDMT performance in each group and a between-groups t test to examine differences in activation by voxel. For all analyses (fMRI and behavioral [RT]), only events in which the subject responded were considered (all events in which the subject did not respond or responded incorrectly were discarded). In order to examine the relationship between brain activation and behavior, each subject’s data were reanalyzed using a model that included the scaled RT on each trial as a regressor. This identified regions in which the variance in the data was accounted for by RT.
A measure of lesion burden was obtained using Analyze software (Robb, Reference Robb2001). The image files were converted from dicom format to AVW format. First, the anisotropic image files were converted to isotropic voxel dimensions of 0.5 mm. Then, brains were aligned along the anterior and posterior commissure line to ensure that all brains analyzed were oriented the same way with regard to rotation, yaw, and tilt.
White matter lesions were identified using 32-slice T2 FLAIR images. All lesions were verified by a neuroradiologist (S.R.). The lesions were manually segmented on all axial slices on which they were visible, working from the superior to inferior direction. Lesion identification started on the most superior axial slice and ended at the axial level where the posterior horn of the lateral ventricles separated from the body of the lateral ventricle. The remaining intensities of the occipital lobe were not segmented. This procedure was performed in order to exclude any hyperintensities caused by air artifact at the level of the sinuses or normal white matter hyperintensities occurring in the occipital lobe. Therefore, the lesions measured were representative of “true” MS pathology and not normal variation due to artifact or individual variability present in all subjects. To establish reliability of segmentation, lesions in five brains were identified and segmented twice by the same rater (H.G.). A high intrarater reliability was established with an interclass correlation of .96. In addition, interrater reliability was established by two raters (H.G. and A.O.) performing segmentation and identification on the same five brains (intraclass correlation of .99). Due to movement artifact resulting in poor image quality, two subjects were excluded from the lesion load analysis. A total brain lesion load volume was created for each subject. Pearson correlations were used to determine the relationship between positive and negative brain activation and total lesion load for each subject.
RESULTS
Neuropsychological Status
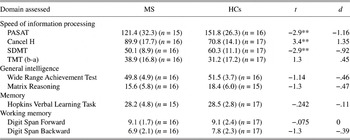
Results of performance on the neuropsychological battery are presented in Table 1. The MS group performed significantly worse than the HCs on three out of the four processing speed tasks that were administered. There were no significant differences in any of the other cognitive domains assessed.
Neuropsychological performance scores by participants group

Note
Due to time constraints, not all tests could be administered to each subject.
* p < .05.
** p < .01.
Modified Version of SDMT
Behavioral performance in the scanner
In order to compare mSDMT performance across groups, both RT and accuracy were compared using t tests. There were no significant differences in accuracy rates between the HC group (M = 0.98, SD = 0.028) and MS group (M = 0.96, SD = 0.021), t(31) = −1.772, p = .09, d = −0.71, with both groups performing near ceiling. To examine RT, only trials during which a subject responded correctly were analyzed. The MS group (M = 2026 ms, SD = 371.6) had significantly slower RTs during mSDMT performance compared to the HC group (M = 1666 ms, SD = 264.4), t(31) = 3.22, p = .003, d = 1.36. To control for potential motor and visual scanning slowing, the RT data were reanalyzed using an analysis of covariance with performance on TMT-A (a visuomotor task) as a covariate. After controlling for motor slowing, the MS group still showed significantly slower RT than the HC group (F = 5.8, p = .023, eta2 = .161).
BOLD Activation
The locations of clusters of activation are reported in reference to the highest point of activation within that cluster. Additionally, the hemisphere in which the highest point of activation was present was reported in the first column of each table (R, right; L, left).
Random-Effects Analysis
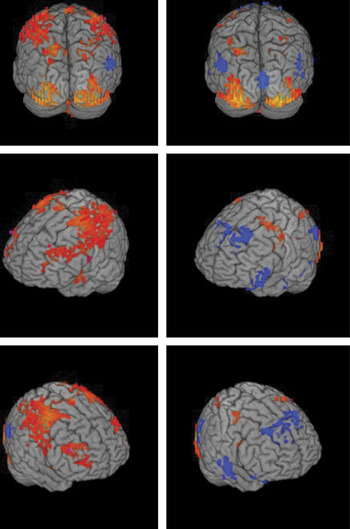
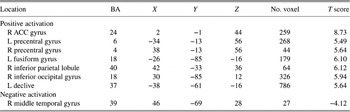
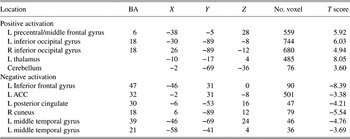
Random-effects analyses were used to examine the patterns of activation for HCs and individuals with MS. Activation in both groups is illustrated in Figure 2. The results of the random-effects analysis for both the HC and MS groups are presented in Tables 2 and 3, respectively. The tables describe the locations of strongest activation and nearest Brodmann’s area.
Activation map showing HC (left column) and MS (right column) activation for the random-effects analysis (warm colors denote positive beta weights, and cool colors denote negative beta weights).

Results of random-effects analysis for HCs

Results of random-effects analysis for MS

Between-Group t Test for Activation Differences
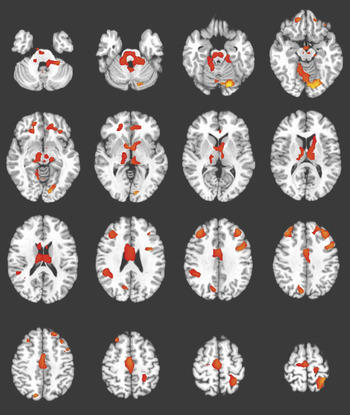
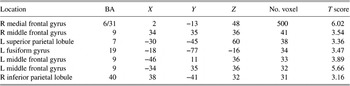
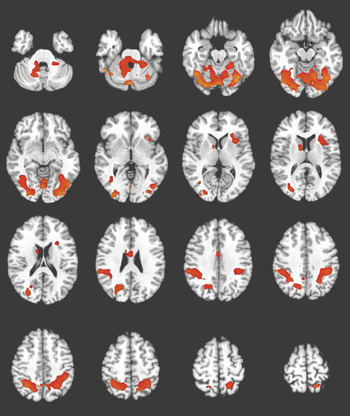
In order to determine the statistically significant differences in activation patterns between the two groups, a between-group analysis (t test) was performed. It was found that the MS group had significantly less activation than HCs in several regions. There were no regions in which the MS group had significantly more activation than HCs. The results of these analyses are reported in Table 4 and shown in Figure 3.
Activation map showing results of between-group analysis (t test). All active regions indicate where the MS group had significantly less activation than HCs. The MS group did not have more activation than HCs in any region.

Those regions more active in HCs than in MS

Examining Relationship Between Brain Activity and Behavioral Performance
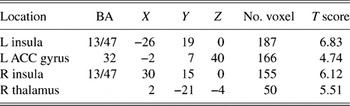
The purpose of the following analysis was to examine the relationship between the altered pattern of functional activity and behavioral performance: that is, what regions in the brain (if any) covaried with trial-on-trial changes in RT. For both groups, brain activation in several regions was associated with longer RT (i.e., as RT increased, brain activation increased). Tables 5 and 6 indicate which regions were associated with longer RTs in HCs and the MS group, respectively. No regions were found to be associated with shorter RTs in either group.
Those regions that were positively associated with reaction time in HCs

Those regions that were positively associated with reaction time in MS

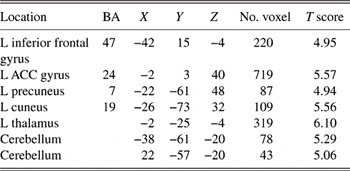
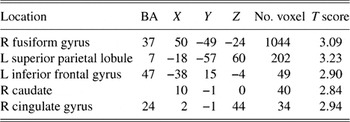
A between-groups analysis was also performed to determine where RT-associated activation differed between groups. It was found that the relationship between RT and activation was stronger in the HC group in all regions. There were no regions where the relationship was stronger in the MS group. These findings are illustrated in Figure 4 and Table 7.
Regions in which the HC group had significantly stronger associations between RT and activation compared to MS.

Those regions that were more strongly associated with reaction time in HCs

Examining the Relationship Between Brain Activation and Lesion Load
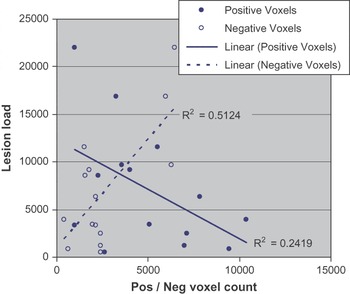
On FLAIR images, it was observed that the average lesion load for the MS group was 7829.87 mm3 (SD = 6689.99). Pearson correlations were used to examine the relationship between total lesion load and brain activity (measured by total number of voxels) in those positively and negatively active regions in the MS sample. Total lesion load correlated significantly with negative activation (r = .716, p = .004). Interestingly, the correlation between positive activation and lesion load was in the opposite direction, although it did not reach significance (r = −.492, p = .074). See Figure 5 for the plot of the relationship between activation and lesion load. Additionally, total lesion load did correlate with accuracy on the mSDMT (r = −.658, p = .008) but not reaction time, indicating that in the MS sample, higher total lesion load was associated with decreased accuracy.
Correlation between lesion load and positive/negative activation.

DISCUSSION
The current study was designed to specifically examine the neural network involved in speeded processing in individuals with MS using the mSDMT. This task was chosen specifically because it is a measure that assesses “decision speed” and because the mSDMT has been used in the aging literature (e.g., Rypma et al., Reference Rypma, Berger, Prabhakaran, Bly, Kimberg, Biswal and D’Esposito2006). Although the mSDMT has been used in studies of aging, this is the first study to use this task to assess processing speed in MS. While it is unlikely that a “processing speed locus” exists in the brain, it was an important aim to determine if distinct neural networks would be evident across varying degrees of processing efficiency.
Regarding behavioral performance, there were no differences in task accuracy with both MS and HC groups achieving nearly perfect performance. However, individuals with MS had significantly slower RTs on the mSDMT compared to HCs, and, importantly, the MS group remained significantly slower even after controlling for fine motor speed. Collectively, these results suggest that the current paradigm was successful in assessing processing speed. Furthermore, processing speed deficits were confirmed in the MS group outside the scanner, where the MS group performed significantly worse compared to the HC group on three of the four neuropsychological tests of processing speed.
Both groups showed activation in several brain regions during performance of the task, including occipital areas and precentral gyrus, which is expected considering both the visual processing and motor aspects of the task. In the MS sample, in addition to regions that were positively activated during the task, there was also more dispersed negative activation (deactivation) compared to the HCs throughout the brain including the ACC cortex, inferior and middle frontal gyri, and the hypothalamus. Deactivation of BOLD signal has recently been described in terms of the “default mode network” or “resting state network,” referring to a set of regions (including medial and lateral parietal cortices) that are active at rest but are “turned off” in order to perform a task or when faced with stimulation (Greicius & Menon, Reference Greicius and Menon2004; Raichle et al., Reference Raichle, MacLeod, Snyder, Powers, Gusnard and Shulman2001). One potential neuronal mechanism explaining deactivation is suppression of neuronal firing in order to inhibit a neuronal response (Allison et al., Reference Allison, Meador, Loring, Figueroa and Wright2000; Shmuel et al., Reference Shmuel, Augath, Oeltermann and Logothetis2006). To further examine the deactivation in the MS sample, we examined the relationship between lesion load and negative activation and found that as lesion load increased in the current sample, negative activation increased and positive activation decreased. This finding implies that pathology may be related to differences in the default network in the MS group compared to HCs, which has been supported by at least one other study (Morgen et al., Reference Morgen, Sammer, Courtney, Wolters, Melchior, Blecker, Oschmann, Kaps and Vaitl2007).
In addition to determining what was positively or negatively active during the processing speed task in both groups, we compared the MS group to the HC group to determine whether the MS group recruited additional regions above and beyond what was found in HCs. It was found that the MS group did not have significantly more activation in any region compared to HCs. In fact, it was found that our MS group had significantly less functional cerebral activity than HCs in several regions including bilateral frontal and parietal regions. This is somewhat surprising considering that previous literature examining cognition in MS using fMRI has often reported recruitment of additional brain regions in MS, which is often considered compensatory (Audoin et al., Reference Audoin, Ibarrola, Au Duong, Pelletier, Confort-Gouny, Malikova, Ali-Cherif, Cozzone and Ranjeva2005; Mainero et al., Reference Mainero, Caramia, Pozzilli, Pisani, Pestalozza, Borriello, Bozzao and Pantano2004; Penner et al., Reference Penner, Rausch, Kappos, Opwis and Radü2003; Staffen et al., Reference Staffen, Mair, Zauner, Unterrainer, Niederhofer, Kutzelnigg, Ritter, Golaszewski, Iglseder and Ladurner2002). It is important to note, however, that previous cognitive fMRI studies on MS have focused largely on working memory functioning and not processing speed. In fact, our findings of decreased activation in the MS group relative to controls are consistent with what has been reported in the aging literature, where processing speed has been examined using neuroimaging. For example, decreased activation in prefrontal regions has been observed in slower and less accurate older adults relative to controls in tasks specifically designed to assess reaction time and neuronal efficiency (Kim et al., Reference Kim, Park, Park, Choi, Lee and Chung2008; Rypma et al., Reference Rypma, Prabhakaran, Desmond, Glover and Gabrieli1999, Reference Rypma, Eldreth and Rebbechi2007). Aging samples are similar to MS in that white matter damage has been proposed to account for much (if not all) of the variance in age-related processing speed deficits in behavioral studies (Madden et al., 2004; Rabbitt et al., Reference Rabbitt, Scott, Lunn, Thacker, Lowe, Pendleton, Horan and Jackson2007). Interestingly, in MS, white matter damage has been shown to account for much of the variance associated with processing speed in behavioral studies, assessed specifically by the SDMT (Benedict et al., Reference Benedict, Carone and Bakshi2004, Reference Benedict, Bruce, Dwyer, Weinstock-Guttman, Tjoa, Tavazzi, Munschauer and Zivadinov2007; Christodoulou et al., Reference Christodoulou, Krupp, Liang, Huang, Melville, Roque, Scherl, Morgan, MacAllister, Li, Tudorica, Li, Roche and Peyster2003; Sanfilipo et al., Reference Sanfilipo, Benedict, Weinstock-Guttman and Bakshi2006). Therefore, it is possible that decreased brain activation relative to controls in the current study is related to white matter damage, similar to what has been shown in behavioral studies of both aging and individuals with MS.
A third aim of our study was to examine more closely the relationship between brain activity and RT. We determined where in the brain cerebral activation covaried with RT. Similarities were observed in both groups, namely: as performance worsened, activation increased in the ACC and thalamus. Additionally, the HCs showed this same pattern (increased RTs correlating with increased activation) in the inferior frontal gyrus, left cuneus, precuneus, and bilateral cerebellum. In a recent study that examined speeded processing by comparing brain activation during a faster trial of the PASAT to a slower trial using fMRI, these same regions (cingulate, precuneus/cuneus, the pulvinar of the thalamus, the inferior frontal gyrus, and cerebellum) were found to be more active during the high-speed trial compared to the slower trial (Lazeron et al., Reference Lazeron, Rombouts, de Sonneville, Barkhof and Scheltens2003). These results combined with our own findings indicate that when processing speed abilities are challenged, a network including the cingulate, precuneus, thalamus, inferior frontal gyrus, and cerebellum is activated. Taken together, these results suggest that a brain network consisting of the above regions may exist which mediates processing speed abilities.
Additionally, while the MS group showed a similar network of active brain regions associated with RT to the HCs, there were some differences as well. Namely, while frontal and parietal regions covaried with RT in the HC group, processing speed was mediated primarily by deep gray matter structures (insula and thalamus) in addition to the ACC in the MS group (i.e., increased activity in these regions was observed as performance worsened). This is an interesting finding in light of a recent study that examined the relationship between RT and brain activity during a visual target detection task in aging (Madden et al., 2004). In this study, it was found that while the HC group showed activation in frontal regions that correlated with RT, the aging sample showed primarily deep gray matter activity to be correlated with RT (similar to the current study). Deep gray matter activation correlating with RT during tasks of processing speed supports a recently presented hypothesis that in addition to white matter damage, processing speed abilities may be affected by damage to cortical–subcortical connections in MS (Sanfilipo et al., Reference Sanfilipo, Benedict, Weinstock-Guttman and Bakshi2006). Finally, it was found that the associations between RT and activation were stronger in the HC group than in the MS group. It is unclear why this would occur; however, we suspect that it is due to the pathology in the MS group which might be expected to decrease the coherent activation of any network associated with faster responding, resulting in a weaker and more variable signal in the MS group.
The current study had several limitations. The first was that a measure to assess mood was not included in the current study. Depression has been shown to significantly affect multiple cognitive abilities in MS including processing speed (e.g., Arnett, Reference Arnett2005; Arnett et al., Reference Arnett, Higginson, Voss, Randolph and Grandey2002; Landro et al., Reference Landro, Celius and Sletvold2004), as well as activation patterns in studies of healthy individuals (e.g., Canli et al., Reference Canli, Sivers, Thomason, Whitfield-Gabrieli, Gabrieli and Gotlib2004; Harvey et al., Reference Harvey, Fossati, Pochon, Levy, Lebastard, Lehericy, Allilaire and Dubois2005; Rose et al., Reference Rose, Simonotto and Ebmeier2006). While no subjects with “major depression” were included in the current study (as assessed with an extensive screening interview), the potential influence of subclinical depression cannot be ruled out. Future studies examining the functional cerebral activity of processing speed in MS should specifically examine the influence of depression symptomatology on activation. Fatigue, another common complaint in MS, was not assessed in the current study either, although it might have contributed to the findings. In fact, we recently found an effect of cognitive fatigue on brain activation in MS during performance of the mSDMT, although subjective fatigue was not assessed (DeLuca et al., 2008). Fatigue is therefore a potentially confounding factor in the current study, as well as other studies of cognition using neuroimaging, and steps should be taken to control for it. Additionally, it is important to note that the current study did not have a control task of visual and motor processing. Had one been included, it may have removed visual and motor activation but may have limited our ability to detect differences between HCs and individuals with MS. Our attempt to control for motor and visual slowing when examining RT was limited in that we utilized the TMT as a control. Although this test does assess visual/motor, it is only performed with the dominant hand, while the mSDMT is performed with both hands.
Despite these limitations, our study, the first to specifically examine the neural networks involved in processing speed using fMRI in MS, provides evidence that functional alterations exist in the neural network associated with processing speed in MS. By examining the relationship between brain activity and behavior, we can better understand how changes in the neural network associated with processing speed affect behavioral performance. These findings bring us closer to understanding the effects of disease on brain–behavior relationships.
ACKNOWLEDGMENTS
This study was supported in part by the F.M. Kirby Foundation and a National Multiple Sclerosis Society grant (RG3330A1/3). We thank Setyaveni Rao, MD, for her assistance in identification and confirmation of MS lesions. We also thank Amanda O’Brien, PhD, for her assistance in establishing interrater reliability during quantification of lesions.