


Introduction
Over the last few years, there has been increasing recognition by social scientists of the role played by households in both contemporary and historical urban centers and urban systems.Footnote 1 This kind of research has emphasized the connections between the measures of the wealth of households and measures of socio-economic stratification, and also highlighted the structural effects of households on the social and economic networks of settlements and flows of people, information, and material resources, suggesting that they are often an important determinant of any future social and economic development.Footnote 2 This has led to a growing interest by historians and archaeologists in the extent to which the sizes of households can be used as a proxy for overall levels of social and economic stratification, often with a view to contributing to addressing matters of contemporary concern, such as the long-term development of inequality, the nature of human responses to crisis, and the climate emergency.Footnote 3 Having said this, although there has been considerable discussion of the relationships between the infrastructure and social and economic conditions of settlements and their estimated populations, there has been virtually no discussion of the extent to which it is possible to detect the same, or similar, relationships within settlements, aside from some very preliminary work on Pompeii.Footnote 4 As this preliminary work has argued, however, there are various reasons for believing that it might be possible to detect comparable relationships at multiple levels of analysis, including at both the settlement and the household level, the most important of which is that we would expect them both to be a product of how the overall properties of social networks change once they are embedded within the built environment.Footnote 5 This means that they should occur wherever or whenever individuals physically interact with each other, regardless of the scale or nature of the exchanges involved.
At the same time, although there has been a significant amount of work on the domestic architecture of Greek and Roman sites, which has often, perhaps naturally, focused on the largest, most architecturally elaborate, and richly decorated structures, there are several reasons for re-evaluating the housing stock of these sites with the previously mentioned ideas in mind. In the first place, although there has been a significant amount of discussion of the housing stock of these settlements, there has been surprisingly little interest in how the attributes of residential units, such as the numbers of rooms within them (and therefore the available facilities for social interaction), changed as their total ground floor footprints increase or decrease in size (and whether or not these are consistent with earlier results), nor in how this relates to other sites. In the second place, although there have also been a number of attempts to use both the total ground footprints of these structures and the numbers of rooms within them as proxies for the overall level of social and economic stratification within settlements, particularly in Pompeii, there has been little consideration of whether there is any relationship between the average sizes of structures, the average numbers of rooms within them and the estimated populations of settlements, and whether there is any correlation between these measures of inequality and the sizes of sites.Footnote 6
The aim of this article, which is a little experimental, is therefore to build on this earlier, preliminary, work on Pompeii to investigate whether this is indeed the case by focusing on three other sites: Delos, Herculaneum, and Ostia. These have been chosen for three reasons. The first is the large amount of each site that has been uncovered by earlier work. The second is the great deal that has been written about the domestic architecture of these sites, including, most notably, by Wallace-Hadrill, Flohr, Trümper, Zarmakoupi, Andrews, Packer, and DeLaine.Footnote 7 The third is the relatively narrow window of time within which these sites can be dated, either because of their relatively sharp declines or dramatic destruction – although it is important not to regard any of them as having been static or unchanging during their period of occupation. This means that we are able to avoid some of the issues that have been encountered in earlier studies of settlement scaling, such as previous work on theaters and amphitheaters, where there was often a significant mismatch between the dates of the structures themselves and the dates of the estimates of population used.Footnote 8 Finally, the inclusion of Delos also allows us to test the applicability of the concepts discussed above to the wider Greek world more generally, given its role as a point of contact between the broadly Roman west and the broadly Greek east during the late Hellenistic/late Republican period, as a first step before investigating whether there is evidence for similar settlement scaling or residential scaling relationships within these contexts.
The article will begin by offering a short review of earlier work on settlement scaling and discussing the preliminary evidence for residential scaling within individual settlements, focusing on Pompeii, before considering the evidence for the housing stock of the three other sites mentioned above. This allows us to produce some new summary statistics for the housing stock of each settlement and calculate new measures of the amount of social and economic inequality within them, which can then be compared against the estimated populations of these sites. It will then assess the relationships between the numbers of rooms within residential units and the total ground floor footprints of the structures within these sites, as well as estimating their average baseline conditions, before discussing the wider implications of these results and setting out the agenda for future research. We will show that there are almost identical relationships between the numbers of rooms and the total ground floor footprints of the residential units within these settlements, despite their different social and economic contexts. This demonstrates, for the first time, that these effects are not just confined to Pompeii and may well be a relatively widespread phenomenon, suggesting a number of avenues for future research. This article therefore represents the first stage of a wider project investigating the connections between the social networks of the inhabitants of residential units, the sizes of these structures, and their numbers and diversities of rooms. Throughout, it will refer to original relationships that have been found across entire systems of settlements as “settlement scaling relationships” and to the new relationships that have been found within Pompeii (and which might or might not be applicable to other settlements) as “residential scaling relationships.”
Settlement scaling
The foundational observation behind recent work, including this article, is that there is a series of relationships between measures of the infrastructure and the socio-economic conditions of settlements and the estimated populations of cities, which are not limited to just modern or just urban settings, having been found across a wide range of both ancient and modern contexts.Footnote 9 A crucial aspect of these relationships, however, is that they are not linear. Measures of infrastructure tend to increase more slowly than the estimated populations of cities, in a series of sublinear relationships, while most social and economic measures increase more quickly than the estimated populations of cities, in a series of super-linear relationships also tend to have similar slopes, or exponents, which are generally a multiple of either 1/3 or a multiple of 1/6 (i.e., infrastructure usually increases at the rate of about either 2/3 or 5/6, while social and economic measures usually increase at the rate of about either 4/3 or 7/6). This means that we would expect these relationships to have slopes, or exponents, of close to 0.67, 0.83, 1, 3, and 1.17, although a certain amount of leeway has often been allowed by the scholars working on this material. This has led to the formulation of a series of general, formal (i.e., mathematical) models for settlements, drawing on recent work on complex systems, as part of a wider attempt to develop a science of cities.Footnote 10 These models are based on the two key ideas that, first, settlements can be conceptualized as social networks embedded within the built environment and, second, that the inhabitants of settlements must balance the benefits of interacting with others with the costs of moving around the built environment. This means that the small divergence in the rates given above can be explained in terms of the different degrees of networking that existed in different contexts, with 1/3 reflecting lesser and 1/6 reflecting greater networking. As Hanson, Ortman, and others have shown in recent papers, given both the general nature of the models and the widespread findings from other contexts, it is also highly likely that there is a series of relationships between the architecture and wider built environment of cities within the Roman world in the Imperial period and their estimated populations.Footnote 11 Although this work is still ongoing, it is clear that there is not only a relationship between the inhabited areas, population densities, and estimated populations of settlements, but also between various properties of public spaces, street networks, gates, aqueducts, theaters, amphitheaters, circuses, macella, professional associations, and inscriptions and the estimated populations of settlements, all of which have exponents of some multiple of 1/3.Footnote 12 This means that they are completely consistent with both wider theoretical models and empirical findings from other contexts.Footnote 13 As we will see below, it is a little surprising, however, that these relationships are not identical to those for modern cities (i.e., with slopes, or exponents, of 1/6, rather than 1/3), especially given how socially and economically developed many of these cities were, at least in relative terms.
There are therefore some interesting parallels between these models and earlier theoretical work, such as by Doxiadis, who argued passionately for the need for a science of human settlements (which he termed “ekistics”) from at least the 1960s onwards, but who also emphasized the importance of adopting an interdisciplinary attitude, taking a multi-scalar approach, considering networks, and incorporating both ancient and modern contexts.Footnote 14 Although his ideas were an important source of inspiration for some of the earlier theoretical and empirical work on settlement scaling, and have had a significant influence on some of the earlier scholars of Delos (and, most notably, on Hoepfner), meaning that they may be familiar to some readers, they are not nearly as well-known as they should be within wider classical archaeology and ancient history.Footnote 15 As Mandich has shown in recent doctoral work, however, these ideas could have great potential for understanding the growth of ancient settlements such as Rome, particularly from a regional perspective, alongside earlier work on settlement scaling, while Batty has also connected the two schools of thought in three speculations about the future of cities from 2022.Footnote 16 This means that further research tracing the points of contact between these different traditions and exploring their implications for the ancient world in much more detail could be extremely fruitful.
Residential scaling
As Hanson has shown, although most of this earlier work, on settlement scaling, has focused on entire systems of settlements, it is also possible to find preliminary evidence for the same, or at any rate similar, relationships within at least one individual settlement: Pompeii.Footnote 17 This was based on an existing catalog of its housing stock, which provides us with evidence for around 1,000 residential units within the excavated part of the site, roughly half of which can be categorized as atrium-peristyle structures and roughly half as either shops or workshops (or tabernae).Footnote 18 These results reveal that there is a series of relationships between both the numbers and the numbers of different types, or diversities, of rooms within residential units and the total ground floor footprints of structures, which are identical for both atrium-peristyle houses and tabernae, although only the former will be discussed here.Footnote 19 These relationships are both sublinear, since the numbers of rooms increase at the rate of about 2/3, while the diversities of rooms increase at the rate of about 1/3 (both relationships are statistically significant [Tables 1 and 2]). Although it is important to be cautious, given that the size of the sample is small, these results suggest that there is also a series of relationships between both the numbers and the diversities of the small finds associated with both kinds of structures and their total ground floor footprints, based on two case studies: the Insula of Menander and Insula IV.1.Footnote 20 These are also both sublinear, since the numbers of small finds associated with structures increase with their total ground floor footprints at a rate close to 5/6, while the diversities of small finds increase at the rate of about 2/3 (again both relationships are statistically significant).Footnote 21 These results are therefore completely consistent with wider theoretical expectations and recent empirical findings, despite the fact that one describes the variation within settlements and one between them. This is important as it suggests that these results are not just associated with a simple, and therefore potentially trivial, relationship between the sizes of residential units and the numbers and numbers of different kinds of rooms within them, but are the result of specific, and therefore highly meaningful, decisions about the way that these structures were designed and used, given the deep connections between social networks and the built environment implied by these models.Footnote 22
The results of regressing the numbers and diversities of rooms within the atrium-peristyle houses within Pompeii against their sizes (in m2) (after Hanson Reference Hanson2023b). All regressions are generated using ordinary least squares regression on log-transformed values.

Table 1. Long description
A table with four rows and five columns. The columns are labeled ‘Dependent variable’, ‘Number of cases’, ‘Exponent (95% CI)’, ‘Pre-factor (95% CI)’, and ‘Significance (P value)’. The rows are labeled ‘Number of rooms’ and ‘Diversities of rooms’. For ‘Number of rooms’, the values are 497 cases, exponent 0.643 (95% CI: 0.614-0.672), pre-factor 0.385 (95% CI: 0.327-0.452), R-squared 0.795, and P value <0.0001. For ‘Diversities of rooms’, the values are 497 cases, exponent 0.356 (95% CI: 0.323-0.389), pre-factor 0.959 (95% CI: 0.794-1.16), R-squared 0.477, and P value <0.0001.
The results of regressing the numbers and diversities of rooms within tabernae in Pompeii against their sizes (in m2) (after Hanson Reference Hanson2023b). All regressions are generated using ordinary least squares regression on log-transformed values.

Table 2. Long description
A table with four rows and six columns. The columns are labeled ‘Dependent variable’, ‘Number of cases’, ‘Exponent (95% CI)’, ‘Pre-factor (95% CI)’, ‘R2’, and ‘Significance (P value)’. The rows are labeled ‘Number of rooms’ and ‘Diversities of rooms’. For ‘Number of rooms’, the values are 468 cases, exponent 0.645 (95% CI: 0.58-0.71), pre-factor 0.24 (95% CI: 0.19-0.303), R2 0.446, and significance <0.0001. For ‘Diversities of rooms’, the values are 468 cases, exponent 0.353 (95% CI: 0.292-0.414), pre-factor 0.593 (95% CI: 0.477-0.736), R2 0.223, and significance <0.0001.
As Hanson has argued elsewhere, although these results are initially slightly surprising, they can be explained by a combination of the fact that both types of spaces were venues for social interactions and that entire settlements as well as individual residential units were designed to accommodate both the entire residential population and their entire social networks.Footnote 23 As Lobo et al. have noted, although there has been significant debate about the best way of defining and identifying settlements, it is now increasingly recognized that any attempt to do so should take account of both the number of people who live within them and the number of people who regularly interact with each other within them.Footnote 24 This means that in modern contexts it is important to consider both the entire commuting zone and the built-up area of each settlement. As Lobo et al. have argued, however, this might be less of an issue in ancient contexts, given that it is generally assumed that the costs of transportation were sufficiently high that these conceptual units were basically indistinguishable.Footnote 25 This is important for this article, as it means that the effects that were discussed above can be explained as being a product of a combination of the total number of residents within each settlement and the total size of their social networks.
The same line of reasoning can be used to understand the results from Pompeii, allowing us to argue that these structures were designed to accommodate both their residents and their wider social networks, including not only the wider family, but also friends, competitors, and any dependents, reflecting previous research on patronage in Pompeii and elsewhere.Footnote 26 In this construal, the independent variable (shown on the x-axis) reflects both the total number of people that lived within each structure and the total number of people who regularly interacted with them in a domestic setting (i.e., the total number of residents within each structure and the total size of their social networks), while the dependent variable (y-axis) can be regarded as a measure of infrastructure and, in particular, of the infrastructure dedicated to social interaction. This means that the two types of relationships are comparable. It is also worth pointing out that this model is somewhat agnostic about who these residents and other individuals were and how, or even if, they were related (in other words, it does not have to be predicated on a “standard” nuclear family and their relatives).
There are two aspects of these results, however, that require further investigation. The first is that Pompeii could arguably be regarded as a special case, since the housing stock of the site was dominated by two specific types of residential units (atrium-peristyle houses and tabernae).Footnote 27 As DeLaine has shown, however, these structures are by no means the only type of housing that was available within the Roman world in the Imperial period, nor were they universally distributed throughout it, being generally much more common in Italy and parts of Gaul and Spain than elsewhere, and being more a feature of the 1st c. BCE and 1st c. CE than later centuries.Footnote 28 There is also currently no evidence for similar relationships in any other ancient or modern context that might either support or undermine the claim that they are a widespread feature of settlements, with one possible exception. As Hanson has noted elsewhere, this is because it is possible to detect a consistent relationship between the sizes of the caldaria within bathing complexes and the total footprints of a small selection of villas in north-western Gaul between 1st and 4th c. CE.Footnote 29 This relationship is also sublinear, increasing at the rate of approximately 2/3. As he has pointed out, however, these two sets of results are not necessarily comparable, given that it is somewhat unclear as to whether these structures should be regarded as individual houses or entire settlements in their own right (and both may well be true).Footnote 30 This means that this relationship might still be ultimately a product of the variation between settlements, rather than within them. These results are therefore currently not replicable.
The second aspect is that both the numbers and the diversities of the rooms within the structures discussed increase a little bit faster than their total ground floor footprints if the data for both atrium-peristyle houses and tabernae are combined, with the numbers of rooms increasing at the rate of about 0.8 (i.e., at a rate closer to 5/6 than 2/3) and the diversities of rooms increasing at the rate of about 0.5 (these are also both statistically significant) (Table 3).Footnote 31 As Hanson has argued, this suggests that it is appropriate to treat atrium-peristyle houses and tabernae as separate entities, given that they both seem to conform better to the wider theoretical models and the wider empirical findings for most ancient contexts, such as the capacities of theaters and amphitheaters mentioned above, which tend to have exponents of a multiple of 1/3, when divided.Footnote 32 As we will see below, however, it is also striking that the results for both types of structures, when combined, could be seen as being comparable with the wider theoretical models and wider empirical findings for most modern contexts, such as gross metropolitan product or road miles, which tend to have exponents of a multiple of 1/6.Footnote 33 As Hanson et al. have argued, although the differences between these values, of 1/3 and 1/6, might not seem great, they are important, since they can be explained by the different nature of the transportation systems within ancient and modern settlements.Footnote 34 These results therefore raise the interesting possibilities that the two sets of settlement scaling and residential scaling relationships can follow two slightly different patterns, while still reflecting the same basic scaling phenomena, and that individual settlements might be better networked than the entire system of settlements, with significant implications for our understanding of both ancient and modern urbanism. As Poehler has shown, this might well be the case with certain ancient sites, given that, although there is evidence for a relatively well-organized and well-regulated traffic system within Pompeii and a handful of other examples, there is little or no evidence for similar arrangements within other settlements.Footnote 35 This means that Pompeii might well have been an unusually internally well-connected and well-integrated site. Very little has been done so far, however, with either the pre-factor or the residuals of this relationship.
The results of regressing the numbers and diversities of rooms within both atrium-peristyle houses and tabernae in Pompeii against their sizes (in m2) (after Hanson Reference Hanson2023b). All regressions are generated using ordinary least squares regression on log-transformed values.

Table 3. Long description
A table with two rows and five columns comparing the number of rooms and diversities of rooms within structures. The columns are labeled as Number of cases, Exponent (95% CI), Pre-factor (95% CI), R², and Significance (P value). Row 1: Number of rooms, 965 cases, Exponent 0.800 (95% CI: 0.782–0.818), Pre-factor 0.148 (95% CI: 0.136–0.161), R² 0.887, Significance <0.0001. Row 2: Diversities of rooms, 965 cases, Exponent 0.522 (95% CI: 0.504–0.540), Pre-factor 0.351 (95% CI: 0.322–0.382), R² 0.770, Significance <0.0001.
There are several components of these relationships, then, that deserve further consideration. The first, of course, is whether the same or similar patterns can be found within settlements from a range of different regions and periods or whether they are restricted to particular contexts, such as large and more socially and economically developed agglomerations. In other words, are these patterns indicative of common aspects of how social networks operate once they are embedded within the built environment across contexts, or do they suggest that there are key transitions in how social networks function in space and time between different settings? The second is whether these patterns are restricted to certain types of residential units, such as the canonical atrium-peristyle houses and tabernae that make up the overwhelming majority of the housing stock of Pompeii, or whether they can also be detected within a broader range of residential units, such as courtyard houses and apartments. The third is whether we would expect these relationships to increase at the same rate in each settlement or for them to increase at either a faster or a slower rate, depending on the size of the settlement itself. In other words, does the size of the population of the settlement have any effect on these patterns? A related concern is whether we would expect the average baseline conditions associated with these relationships to be constant or whether we would expect them to fluctuate between different regions and periods, and whether anything meaningful can be said about the extent to which each structure deviates from the underlying relationships or whether this is simply demanding too much of the available evidence. Finally, can exactly the same theoretical models be used to understand the variation within settlements or do they require a little adjustment, in order to encompass a wider selection of sites?
The next part of this article will therefore turn to the housing stock of the four case studies mentioned above (Delos, Pompeii, Herculaneum, and Ostia), which have been selected on the basis of providing enough information about a sufficiently large number, diverse range of types, and representative sample of residential units to explore any patterns within them, with at least 32 observations being a good rule of thumb for this kind of work. This therefore rules out large sites, such as Rome, Athens, Carthage, Ephesus, and Pergamum, given the relatively limited amount of evidence that survives, while others, such as Timgad, Sabratha, and Volubilis, could be a subject of future research (although there may be issues with the representativeness of the best-known parts of the latter).Footnote 36 Finally, although other scholars, such as Adams, have conducted detailed studies of the social and economic function of villas in Italy and elsewhere, which could be used to provide additional information, these have been set to one side for the purposes of this article, given the uncertainties of classifying villas as settlements or residential units and given that most of these studies have focused on the percentage of reception and entertainment, rather than the numbers (or diversities) of rooms within them.Footnote 37 This material could be the subject of future work.
Data and methods
To investigate these issues, we have focused on a range of different types of structures, which are usually associated with different regions and periods, and which drew on different architectural traditions, used different building materials and construction techniques, and responded to different local climatic conditions.Footnote 38 This means that they cannot, and should not, be used as “textbook” examples of domestic architecture in any case. As noted above, at Pompeii, the most important structures are atrium-peristyle houses and shops and workshops (tabernae), which are characterized by their central partly-roofed main spaces and rear colonnaded courts, and a small number of rooms with wide openings onto the street respectively, although there are also a small number of apartments and a small number of structures that defy categorization, which were not considered in earlier work.Footnote 39 A similar approach can be extended to Herculaneum by considering both atrium and peristyle houses, tabernae, small habitations and large commercial properties, structures with irregular forms, and apartments (using Andrews’s categories) and to Ostia by considering domus type houses, ground floor shops or workshops, apartments (which are extremely varied in terms of their forms), and various other commercial and industrial facilities (essentially reflecting Packer’s types I–III).Footnote 40 Finally, the housing stock of the remaining site, Delos, includes not only the so-called “Delian ‘normal house’”, which is usually characterized by a small vestibule, a large, central courtyard, various service rooms, and a group of two or three reception, entertainment, and living rooms (the oeci), which are usually located toward the rear of each structure, but also more modest structures, such as “mixed-use” complexes, which tend to be made up of a large room at the front and a series of smaller rooms toward the rear, combining commercial and living spaces, and also single-room shops or workshops, which are usually referred to as “tabernae” for convenience.Footnote 41
To collect the data for this article, we began by drawing on existing catalogs of the housing stocks of settlements, before using a combination of existing maps and plans and GIS to measure the sizes and count the number of rooms within the residential units associated with the remaining sites and create the most consistent sets of data possible under the circumstances. Aside from Flohr’s database of the housing stock of Pompeii, which has been discussed in detail elsewhere, the most important resources for this article were therefore (1) Andrews’s study of upper floors in Herculaneum, which includes both evidence for the total ground floor “useful area” (and therefore a close equivalent of the total ground floor footprint) of residential units and maps or plans of the structures themselves, which include room numbers that can be used to count the numbers of the rooms within them, (2) the masterplan of Delos compiled by the French School at Athens, which is now available as a Web GIS, and, finally, (3) the “pianta generale” of Ostia, which includes both a general overview of the site and 14 double-spread maps and plans, alongside the color-coded overview of different types of structures, more detailed individual maps and plans of specific structures (which also include room numbers that can be used to count the numbers of the rooms within them), and the various other updates provided by the Ostia Antica website.Footnote 42 These represent most or all of the extant remains of the site at the time of compilation, including doorways, allowing us to identify residential units with a high degree of accuracy and precision.
In each case, we have collected information about most, or a good deal, of the excavated part of each settlement: an area that covers about 44 ha in the case of Pompeii, 40 ha in the case of Delos, 4 ha in the case of Herculaneum, and 35 ha in the case of Ostia.Footnote 43 Given that the remains for Delos are somewhat disconnected, however, we have focused on the Theater district, since it contains the largest numbers of structures and greatest range of types of residential units, although we do show the effect of including and excluding other districts in the results below.Footnote 44 At Herculaneum, we have concentrated on the four main blocks that have been excavated, while at Ostia we considered most of the area that has been excavated, but have not attempted to use the results of the recent geophysical prospection at Ostia, since it is not possible to identify doorways, and therefore residential units, using this material.Footnote 45 In addition, we have focused on residential units, rather than free-standing buildings, since they are more likely to have been occupied by individual households. We have then followed the same approach to identifying residential units as in earlier work by attempting to locate all the entrances from the street and regarding all the rooms that can be accessed from them as being part of the same structure, as is conventional, with the caveats below.Footnote 46 It is also important to recognize, however, that no two groups of scholars are likely to interpret the boundaries of individual residential units in exactly the same way and that there will naturally be differences of opinion about the extent to which different structures were mainly domestic or commercial, but these will make little difference to the results, given that we are only interested in the overall relationships between the sizes of structures and the numbers of rooms within them. We then used either existing labels such as “atrium house” and “peristyle house” or the number of rooms that are associated with each one to distinguish between the structures that are most likely to be house- and apartment-like structures, versus shop- and workshop-like structures, taking three or more rooms as our cut-off point (although we note that any such distinction can only be used as a guide and that there will inevitably be some overlap between these categories). Although we have not tried to distinguish between structures of different dates, this should have very little or no effect on the results below, given that these structures can mostly be dated to within a relatively narrow window of time. This is discussed in a little more detail below. In each case, we have regarded any space that is enclosed on at least three or four sides as a single room, which captures most living and reception or entertainment spaces and utilitarian, service, and storage spaces, following standard approaches, but have had to take a slightly more flexible approach to access spaces, such as passages, corridors, and stairs, again following standard approaches; as noted above, we have also used any available room numbers to support our counts.Footnote 47 We have not attempted to determine the functions of these spaces given the difficulties of doing so from the existing evidence, although this could also be an important aim for future research. This means that it is not possible to explore how the diversities of rooms varied with size at present.
Another important caveat is that there is also evidence for a large number of shops and workshops within each site, which seem to be connected to larger and more elaborate houses and apartments. This means that it is almost impossible to decide whether these structures were owned and used by the residents of these houses and apartments, sold off, or rented to others. We have therefore exercised a certain amount of discretion and treated them on a site-by-site and case-by-case basis (although exploring the effects of slightly different choices could also be a profitable aspect of future work). There is also a significant amount of evidence for upper floors, including footings for wooden staircases and ladders. Although it is a relatively simple task to decide whether this was used to extend the amount of space that was available in each residential unit or to create an entirely separate residential unit, usually from the presence or absence of internal and external staircases, it is more difficult to decide exactly how large these spaces were, determine how many rooms they might have had, or establish whether they covered all or part of the total ground floor area or extended over neighboring structures. We have therefore only attempted to measure the total ground floor footprint of each structure. It is also difficult to date these structures, given the challenges of not only of isolating the original structure, but also of identifying extensions, phasing different sequences of rooms, and incorporating any other redevelopments, so we have not attempted to explore how these structures changed over time: this could be an important objective for future, and more detailed, work. Most of the structures within Delos, however, can broadly be dated to after 167 BCE, when Delos was declared a free port and started to develop into a thriving trading center, while most of those within Pompeii and Herculaneum can broadly be dated to 79 CE (the date of the eruption) and most of those within Ostia to the 2nd or 3rd c. CE (the approximate peak of building and construction).Footnote 48
Finally, it is important to stress that we have only attempted to collect a sufficiently large amount of information to examine the overall relationships between the numbers of the rooms and the total ground floor footprints of the structures within these sites, and that these data should not be regarded as supplanting existing sources of information about the residential architecture and housing stock of each site, which are naturally much more comprehensive and more detailed (especially considering the richness of the information that they provide about the building materials, construction techniques, and interior decoration involved). This means that these data should not be regarded as being exhaustive, or used as a source of information about individual structures, for which other accounts will be more useful.
Having collected this information, we have then used the total ground floor footprints of structures and the numbers of rooms within them to estimate the overall level of social and economic stratification within the site, using the measures of social and economic inequality known as Gini coefficients (although we prefer not to use this term). This provides us with a single figure, which varies between 0 and 1, where 0 reflects complete equality (i.e., all of the resources are distributed evenly among the population) and 1 reflects complete inequality (i.e., all of the resources are concentrated in the hands of a single individual).Footnote 49 We have then regressed the total numbers of rooms within residential units against the total ground floor footprints of these structures, giving the results below.
Before proceeding, it is also worth stressing that we have assumed that there is no relationship between the numbers of people who lived in each household and the size of the total ground floor area of each structure, following earlier work by Hanson and others.Footnote 50 This is important, as it means that the sizes of these residential units can be used as a proxy for the wealth of their inhabitants, while the numbers and diversities of rooms can be used as a proxy for the amount and range of activities that occurred within them, both of which are standard assumptions within the wider social sciences.Footnote 51 This is because we would not only expect larger structures to have cost more to build in terms of land, building materials, and labor, but also for them to have been associated with a larger volume of other kinds of moveable wealth, such as tableware, furniture, textiles, etc., while the reason for associating different spaces with different activities should be self-explanatory, especially within pre-industrial contexts.Footnote 52
Finally, it is worth discussing the sizes of the estimated populations of these sites briefly, given that these are essential for not only evaluating how the overall levels of social and economic stratification that are revealed by the housing stock of these settlements compare with other contexts, but also for assessing whether the properties of any relationship between the numbers of rooms within these structures and their total ground floor footprints vary with the size of the settlement with which they are associated. As Hanson and Ortman have shown, it is possible to derive a series of new estimates for the populations of sites by investigating the overall relationship between the numbers of residential units within a given part of a site and the inhabited areas of sites, using a sample of over 50 sites from throughout the Greek and Roman world.Footnote 53 As they have shown, aside from Rome and a few other sites, this also provides us with estimates for the populations of Ostia, Pompeii, and Herculaneum of roughly 35,000, 10,000, and 2,000, respectively, the last of which may be a little low because of underestimating the size of the inhabited area of the site.Footnote 54 These figures therefore generally align remarkably closely with the kinds of figures that have been suggested by other scholars in the past, who have generally provided a figure of about 25,000–30,000 for Ostia, 10,000 for Pompeii (although some scholars, such as Osanna and Zuchtriegel, have suggested higher figures, of up to 30,000 or even higher, in the light of recent evidence, but which probably reflects the numbers of individuals who lived in both the city and its hinterland), and 5,000 for Herculaneum.Footnote 55 Meanwhile, according to most scholars, Delos had an estimated population of between about 10,000 and 20,000 by the early 1st c. BCE.Footnote 56 For example, Zarmakoupi has suggested a figure of about 15,000 for the population of the settlement itself, based on Hoepfner and Schwandner’s work.Footnote 57 The approach provided by Hanson and Ortman, meanwhile, provides a slightly higher figure of about 18,000 (strictly, 18,364), based on an inhabited area of about 95 ha and a projected population density of 193 people per hectare, meaning that it is very much within the same broad neighborhood.Footnote 58 These estimates therefore seem reliable enough for us to proceed.Footnote 59
Results and discussion
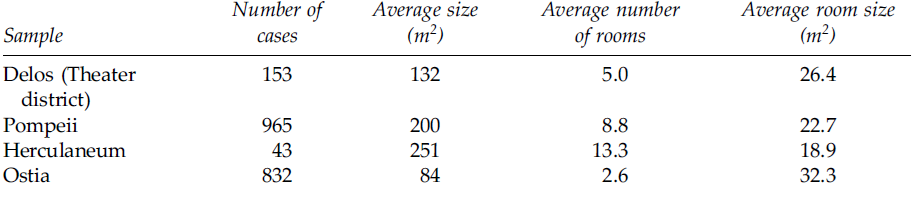
In total, this provides us with evidence for just under 2,000 residential units, including 153 residential units from Delos, 965 from Pompeii, 43 from Herculaneum, and 832 from Ostia (Table 4), roughly half of which can be categorized as houses and roughly half as either shops or workshops in each case, with the exception of Ostia, in which the proportion of 1 or 2 room structures is much higher (coming to roughly 4/5th).Footnote 60 In each case, there is a great deal of variation within the housing stock of each site, with a wide range between the smallest and the largest residential units within them, but there are also no sharp breaks in the data. This means that these structures cannot be easily divided into different groups, such as “rich” and “poor,” “elite” and “non-elite,” or even “Greek” and “Italian,” indicating little social and economic stratification.Footnote 61 These residential units are also generally denser toward the center of the settlement, making them consistent with both contemporary settlements and some other historical settlements.Footnote 62
Some descriptive statistics for the case studies used in this article. The figures for Pompeii are from Hanson Reference Hanson2023b.

Table 4. Long description
A table comparing residential units across Delos, Pompeii, Herculaneum, and Ostia. The table has four rows and four columns. Column headers are Number of cases, Average size (m²), Average number of rooms, and Average room size (m²). Row labels are Delos (Theater district), Pompeii, Herculaneum, and Ostia. Row 1: Delos (Theater district), 153, 132, 5.0, 26.4. Row 2: Pompeii, 965, 200, 8.8, 22.7. Row 3: Herculaneum, 43, 251, 13.3, 18.9. Row 4: Ostia, 832, 84, 2.6, 32.3.
In the first place, these data allow us to consider the relationships between the minimum, maximum, and average total ground floor footprints of structures and the numbers of rooms within them and the estimated populations of the sites they are associated with, which can then be compared to the figures for other sites. Although we have to be extremely cautious about the results, given that the size of the sample is too small to be assessed statistically, they do nonetheless seem to suggest that there is an inverse relationship between the average total ground floor footprints of these residential structures and the estimated populations of sites, which appears to have a slope, or exponent, of −2/3. This clearly echoes earlier work by showing that the average sizes of properties decrease with population, meaning that settlements become more dense.Footnote 63 Perhaps more importantly, however, these results also suggest that the average numbers of rooms within these structures decrease even more strongly with population, at nearly −1. This is important, as it means that the average sizes of the rooms within them therefore actually increase with the estimated populations of sites – and perhaps at the rate of about 1/3. This relationship is therefore consistent with not only wider theoretical models, but also with wider empirical findings from other contexts, including the expectation for the average wealth of the inhabitants of settlements.Footnote 64 These results could be interpreted as reflecting both the greater pressure on space within larger settlements, leading, on average, to smaller residential units and numbers of rooms within them, and rising standards of living and quality of life, which is reflected in the fact that the rooms that were built were, again on average, a little larger, providing more useable space.
Although the overall level of social and economic inequality is not the primary focus of this article and, again, although we have to be careful about the size of the sample used, it is interesting to note that there also appears to be a relationship between the estimated populations of these settlements and the overall level of social and economic stratification represented by the coefficients described above. In fact, the available information provides us with a coefficient of 0.54 for the sizes of residential units within Delos, 0.61 for Pompeii, 0.58 for Herculaneum, and 0.52 for Ostia (results that are broadly comparable with earlier work).Footnote 65 This means that there is an inverse relationship between the overall level of social and economic inequality and the estimated populations of sites, suggesting that larger sites are less unequal and vice versa. Interestingly, this also suggests that the very broad patterns that have been identified across the world and over time break down at this scale of investigation.Footnote 66 It is also interesting to note, in passing, that the coefficients for the numbers of rooms within these structures all tend to be a little lower (0.49 for Delos, 0.51 for Pompeii, 0.46 for Herculaneum, and 0.50 for Ostia), illustrating the importance of using the same types of measures to compare sites.Footnote 67
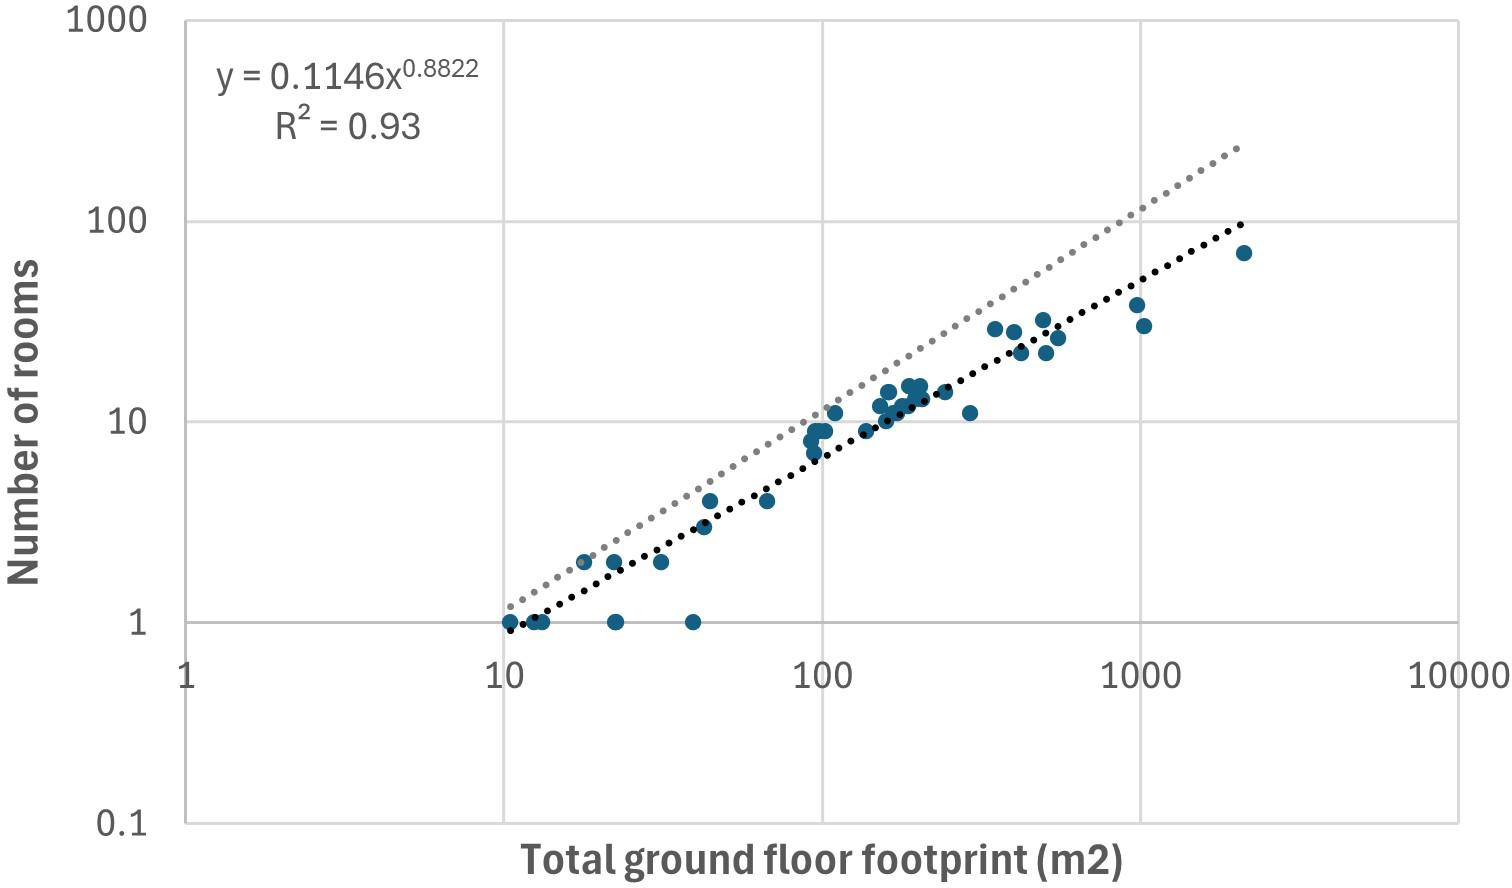
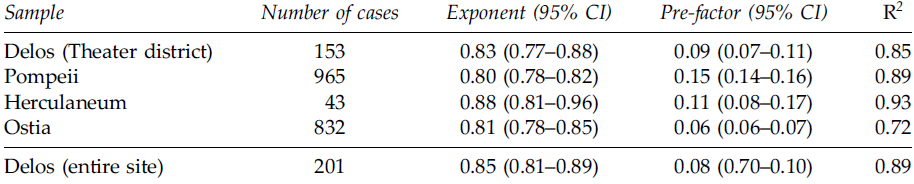
At first sight, these results suggest that there are remarkably similar relationships between the numbers of rooms within residential units and the total ground floor footprints of these structures within all four of these sites, despite the different social and economic circumstances of these settlements. These relationships are also slightly sublinear, with slopes, or exponents, that are close to 5/6, with the result that the numbers of rooms increase more slowly than the sizes of structures. In particular, although, as Hanson has shown, the overall relationship for all of the structures within Pompeii, including both atrium-peristyle houses and tabernae, has a slope, or exponent, of about 0.80, the equivalent results for both Delos and Herculaneum and Ostia (i.e., including all of the structures that are available) have slopes of 0.83, 0.88, and 0.81 respectively.Footnote 68 This means that they are not only consistent with the wider theoretical models, but also with the empirical findings for entire systems of settlements discussed above. These relationships also have surprisingly high R 2 (ranging between about 0.7 and 0.9), especially for ancient contexts, and are statistically significant at a very high level (<0.0001) (Table 5 and Fig. 1 to Fig. 4).
The relationship between the total number of rooms within residential units within Pompeii and their total ground floor footprints (in m2). Both scales are logarithmic. The dotted black line indicates the line of best fit, while the dotted grey line denotes a linear relationship, which is given for reference.

The relationship between the total number of rooms within residential units within Delos (Theater district) and their total ground floor footprints (in m2). Both scales are logarithmic. The dotted black line indicates the line of best fit, while the dotted grey line denotes a linear relationship, which is given for reference.

The relationship between the total number of rooms within residential units within Herculaneum and their total ground floor footprints (in m2). Both scales are logarithmic. The dotted black line indicates the line of best fit, while the dotted grey line denotes a linear relationship, which is given for reference.

The relationship between the total number of rooms within residential units within Ostia and their total ground floor footprints (in m2). Both scales are logarithmic. The dotted black line indicates the line of best fit, while the dotted grey line denotes a linear relationship, which is given for reference.

The results of regressing the total numbers of rooms within structures and their total ground floor footprints (in m2). All regressions have been performed using ordinary least squares regression, using logarithmically transformed data. All results are significant at the <0.0001 level.

Table 5. Long description
A table comparing regression results of room numbers and ground floor footprints across different sites. The table has 5 rows and 5 columns. Column headers are Sample, Number of cases, Exponent (95% CI), Pre-factor (95% CI), and R2. Row labels are Delos (Theater district), Pompeii, Herculaneum, Ostia, and Delos (entire site). Row 1: Delos (Theater district), 153, 0.83 (0.77–0.88), 0.09 (0.07–0.11), 0.85. Row 2: Pompeii, 965, 0.80 (0.78–0.82), 0.15 (0.14–0.16), 0.89. Row 3: Herculaneum, 43, 0.88 (0.81–0.96), 0.11 (0.08–0.17), 0.93. Row 4: Ostia, 832, 0.81 (0.78–0.85), 0.06 (0.06–0.07), 0.72. Row 5: Delos (entire site), 201, 0.85 (0.81–0.89), 0.08 (0.70–0.10), 0.89.
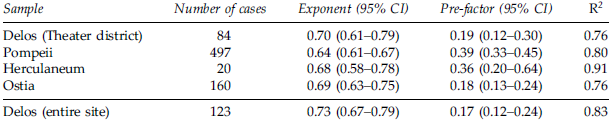
An important feature of these results, however, is that the overall distribution of structures appears to follow a slightly angular trend in each case, with a break point toward the lower end of the distribution, while many of these relationships also tend to have a slightly “fat tail” (i.e., they are slightly heteroscedastic). The first is important, as it suggests that the overall pattern might also conceal two separate relationships (one for each part of the angle) with slightly different slopes and exponents, which might no longer conform to the wider theoretical models and the wider empirical findings described above. This could, for example, be the result of combining two different types of structures within the same set of data, and seems to coincide with the division between house- and apartment-like structures and shop- and workshop-like structures. The second can be explained by the relatively small amount of variation that there is in the numbers of rooms within the smallest structures, which are again most likely to be a feature of shops and workshops rather than houses. This means that it is important to investigate the effects of isolating the latter, again following earlier work, which allows us to account for both of these effects. This reveals that there is still an almost identical relationship between the numbers of rooms within house- and apartment-like structures and their total ground floor footprints within these contexts, which are now well described by a single line of best fit, although these relationships now tend to increase at the rate of about 2/3, regardless of context (the exact figures are 0.70 for Delos, 0.64 for Pompeii, 0.68 for Herculaneum, and 0.69 for Ostia; although note the relatively small sample size for Herculaneum). This means that they are still consistent with the theoretical models and empirical findings discussed above. These relationships also have a high R 2 and are statistically significant at a very high level (Table 6).
The results of regressing the total numbers of rooms within houses and their total ground floor footprints (in m2). All regressions have been performed using ordinary least squares regression, using logarithmically transformed data. All results are significant at the <0.0001 level.

Table 6. Long description
A table comparing regression results of room numbers and ground floor footprints across different sites. The table has 6 rows and 5 columns. Column headers are Sample, Number of cases, Exponent (95% CI), Pre-factor (95% CI), and R2. Row labels include Delos (Theater district), Pompeii, Herculaneum, Ostia, and Delos (entire site). Each row provides specific values for each column. Notable trends include varying exponent and pre-factor values across different sites, with R2 values indicating the goodness of fit for each regression model.
Another important aspect of these results, therefore, is that both of these sets of relationships increase at a sublinear rate, notwithstanding the minor difference in their exact rates. As noted above, this is important, given that it suggests that the numbers of rooms within these residential units can be interpreted as being a form of infrastructure and, in particular, as a kind of infrastructure for social interaction, given the strength of the similarities between them and the wider theoretical models and wider empirical results that also concern infrastructure. This is particularly remarkable, given the differences in the layouts, designs, and proportions of the different kinds of structures within each site, the different architectural designs and interior decoration of these structures, and the different ways in which they were used to shape social interactions between individuals and groups, differentiate between public and private spaces, reinforce social and economic hierarchies (such as according to age, gender, or status), and articulate the relationship between different groups of different statuses, including social and economic dependents, from context to context – or even the sharing of residential units by different families.Footnote 69 Finally, although it is not possible to evaluate this on the basis of the available information, these results also strongly suggest that we would expect to find a series of relationships between the diversities, or the numbers of different types of rooms, within structures and the total ground floor footprints, if only by analogy with wider theories and results.
Although we have sounded some notes of caution about them, these results suggest that, although the number of rooms within all of the structures that have been studied tends to increase with the total ground floor footprints of structures at a rate of a multiple of 1/6 (i.e., 5/6), those within houses tend to increase at a rate of a multiple of 1/3 (i.e., 2/3), meaning that the former is more compatible with our view of modern settlements and the latter with ancient ones. As noted above, although this might not initially seem like an important distinction, it might have significant implications for our understanding of both the ancient and the modern world, and of the interplay between the social networks operating at the level and scale of households and settlements, given the fact that the difference between the rates associated with ancient and modern settlements has normally been explained by variations in the extent to which the social networks and transportation systems that supported them are connected and integrated.Footnote 70 In other words, the results may well suggest that the social networks associated with individual households were more effective, at least in terms of ensuring flows of information and resources, than those within entire systems of settlements. This also clearly deserves further investigation.
As noted above, another advantage of the approach used in this article is that it allows us to use the pre-factor of these relationships to calculate the average baseline number of rooms that are incorporated into these structures (Table 5). These can then be converted into a per capita figure by multiplying by an average number of people per household, if required. These results provide a figure of about 0.09 rooms per household for Delos, 0.15 for Pompeii, 0.11 for Herculaneum, and, finally, 0.06 for Ostia. These results mean that there is also a strong correlation between the average baseline numbers of rooms per residential unit and the estimated populations of these settlements, which have similar properties and therefore a similar interpretation, as the results discussed above. This means that these results can not only be interpreted as reflecting a greater pressure on space in larger cities, but also an increase in the average standard of living and quality of life of the inhabitants of structures, as the estimated populations of the settlements they are associated with increased. Finally, the results have interesting wider consequences, since they not only suggest that the settlement scaling and residential scaling relationships discussed above (i.e., the variation across settlements and the variation within them) can be seen as being two sides of the same coin, but also reveal the links between them, by demonstrating the extent to which the initial conditions for each settlement are conditioned by the overall patterns for settlements. This also requires further investigation.
Finally, as noted above, this approach allows us to calculate the extent to which each structure deviates from the underlying relationship, whether positively or negatively (values that are known as “residuals”). These residuals, however, do not seem to have any particular geographical or chronological pattern, since both positive and negative values are relatively evenly distributed throughout the built environment and do not seem to be concentrated on particular streets or the intersections between them. These results are therefore a little intriguing, since they suggest that these deviations might well be random. More detailed work is also required to resolve this.
These results therefore not only reveal that there are almost identical relationships between the numbers of rooms and the total ground floor footprints of the residential units within these settlements, regardless of their different social and economic contexts, but also that these relationships are remarkably consistent with both the wider theoretical models and the wider empirical findings from other contexts discussed above, despite the fact that one describes the variation within settlements and one between them. This is significant, as it not only demonstrates that it is possible to replicate the results for Pompeii, but also reveals that it is possible to find the same, or similar, patterns in at least three other contexts from different regions and periods. This suggests that we may be dealing with a much more widespread phenomenon than we might have expected, which may be the equivalent of the regularities that have been identified between the infrastructure and social and economic conditions of settlements and their estimated populations in other contexts. This may allow us to extend earlier work on scaling in two major directions, by showing that the same line of reasoning can be used not only to understand the variation between households within a settlement, but also to assess the variation between sites. At the same time, these results also provide the first evidence that the overall scaling approach can be applied to both the Hellenistic and the Roman world. This suggests that more research in this area, including relating to both settlement scaling and residential scaling, may be extremely profitable.
These results therefore have a number of significant implications for our understanding of both ancient and modern urbanism. In the first place, they suggest that it is possible to detect analogous relationships both within individual settlements and across entire systems of settlements, given the comparability of the slopes, or exponents, of both sets of relationships (i.e., the earlier results for the cities of the Greek and Roman world and the newer results for Pompeii and the other sites discussed here). This is important, as it strongly suggests that both of these patterns can be regarded as being the result of the same, or similar, social and economic mechanisms and, in particular, that they can both be regarded as being a product of how the properties of social networks of settlements change once they are embedded within the built environment. In doing so, these results have important implications for our broader understanding of how settlements operate in general terms, given that they not only suggest that comparable social network effects must have existed at a range of scales, including at both the settlement and the household level, but also that both types of structures can be seen as part of the same continuum of settlement, running from individual households to entire systems of settlements. It is also striking that, although there is a relationship between the pre-factors of these relationships and the estimated populations of settlements, there is apparently no relationship between their slopes and the same variable. This means that the latter is effectively scale-free. Investigating this in more detail should also be a matter for future research.
More generally, these results raise important issues about the overall relevance and utility of the typologies that have traditionally been used to distinguish between Greek and Roman residential units, including both the “Delian ‘normal house’” and the Pompeian “atrium-peristyle house,” for studying the variation between households both within and between settlements, given the apparent uniformity of the relationships discussed above. This means that, although the detailed typologies of structures that have been constructed for scholars still have enormous value for understanding the differences in the cultural backgrounds, architectural traditions, and building materials and construction techniques of different sites, they may have also concealed important and fundamental similarities in how they were used in social and economic terms, which it is also important to bear in mind when discussing the residential architecture or housing stocks of sites.
These results are a reminder of the value of earlier, and more extensive, but often less rigorous excavations for our understanding of the ancient world, despite the large amount of stratigraphic detail that has often been lost in the process, especially if paired with appropriate theoretical methods and accompanying empirical findings. The results also suggest that the relative lack of evidence for upper floors may not be as detrimental as one might have expected.
Our work suggests a number of aims and objectives for future research. The most important will be to continue to develop the existing theoretical models discussed above in the light of the new empirical findings presented here, meaning that they can be used to explain both settlement scaling and residential scaling. As noted above, there is no reason why they should not be able to do so, given that both are essentially concerned with how the properties of social networks change once they are embedded within the built environment.Footnote 71 As Hanson has noted elsewhere, another important ambition for future research will be to continue to derive comparable figures for other sites from a range of regions and periods, which can then be used to explore how widespread this phenomenon really is (the most promising candidates for which are the Classical Greek world (such as Olynthus, Priene, Piraeus, or Miletus), Medieval and Early Modern Europe, and contemporary nation states), and also to assess whether there are different rates of social and economic development in different places and periods.Footnote 72 This approach could therefore be used to significantly improve our understanding of the overall levels of connectivity and integration that were enjoyed by ancient cities, given that we would expect the sites with the most comparable rates to be the most connected and integrated. It would also be interesting to explore whether there are any patterns in the residuals of these relationships, including common factors, which might reveal why some households were more successful than we might have expected, based on their sizes, than others. Finally, another aim for future research will be to determine the exact dates of structures and establish what effect, if any, slight differences in these have on the overall results, as well as considering the diversities of the rooms within structures.
Conclusions
In this article, we have attempted to explore whether it is possible to detect the same, or at any rate similar, relationships both across entire systems of settlements and within individual settlements, building on earlier work on Pompeii, by focusing on three other well-known and well-documented sites, Delos, Herculaneum, and Ostia. The results reveal that there are almost identical relationships between the numbers of rooms and the total ground floor footprints of the residential units within these settlements, despite their different social and economic circumstances, which are completely consistent with wider theoretical models and recent empirical findings from other contexts, despite the fact that one describes the variation within settlements and one between them. This suggests that these relationships are almost certainly much more widespread than we might have expected and that they are the product of the same or similar social network effects. In addition, these results suggest that there is a correlation between the average baseline numbers of rooms per residential unit and the estimated populations of these settlements, which can then be used as a proxy for the average standard of living and quality of life of the inhabitants of these structures, as well as a correlation between the overall level of social and economic inequality of these settlements and the estimated populations of settlements, which might suggest that larger settlements were less unequal and vice versa. This approach therefore offers a promising direction for future research, since it provides us with a much better way of understanding the extent of the variation within residential units between different regions and periods, and of situating individual residential units within their wider context, after taking their different sizes into account. This potentially allows us to suggest a much more ambitious model of how both households and settlements function across contexts, which regards the variation between them as being a product of similar forces, including social network effects. More work is needed on this in the future.
Supplementary material
The supplementary material for this article can be found at https://doi.org/10.1017/S104775942610097X
Acknowledgements
We would like to thank the editor, Professor Mantha Zarmakoupi, and the anonymous readers for their helpful comments and suggestions, which have made this a better piece of work. We are also grateful to the Craven Committee at the University of Oxford for funding the collection of parts of the data used in this article by Marie Wittmann.








 Open access

