Implications
The health status of dairy cows in early lactation and their reproductive performance can be influenced by feeding pre- and post-calving through effects on body reserves at calving and negative energy balance post-calving. This study found that cows in adequate condition at calving benefited from a high-energy diet (H) post-calving, primarily in terms of lower mobilisation of body reserves compared to cows in adequate condition offered a low-energy diet (L) post-calving. Cows in poorer condition at calving did not mobilise differently when offered H or L post-calving. Milk production was not affected by pre- or post-calving diet.
Introduction
A substantial amount of research has been carried out during the last decade to investigate how to prime the dairy cow for the subsequent lactation. Different approaches have been tested, involving diet strategies designed to maximise feed intake in the last part of the dry period, in order to minimise the decline in dry matter intake (DMI) that normally occurs around calving (Bertics et al., Reference Bertics, Grummer, Cadorniga-Valino and Stoddard1992; Grummer, Reference Grummer1995). Another approach has been to feed cows according to or below their energy requirements during the dry period to stimulate DMI post-calving (Overton and Waldron, Reference Overton and Waldron2004) and the capacity of the liver to oxidise fatty acids post-calving (Litherland et al., Reference Litherland, Dann, Hansen and Drackley2003; Douglas et al., Reference Douglas, Overton, Bateman, Dann and Drackley2006). These two feeding strategies have been compared in a number of experiments but have often failed to show significant effects on metabolic indicators of fat and liver metabolism post-calving. Offering a high-energy-density diet (H) in the dry period has, in some studies, increased non-esterified fatty acids (NEFA) post-calving, compared to a low-energy-density diet (L) (Rukkwamsuk et al., Reference Rukkwamsuk, Wensing and Geelen1998; Holtenius et al., Reference Holtenius, Agenäs, Delavaud and Chilliard2003), but most studies have found no effect (Minor et al., Reference Minor, Trower, Strang, Shaver and Grummer1998; Tesfa et al., Reference Tesfa, Tuori, Syrjälä-Qvist, Pösö, Saloniemi, Heinonen, Kivilahti, Saukko and Lindberg1999; Holcomb et al., Reference Holcomb, Van Horn, Head, Hall and Wilcox2001; Doepel et al., Reference Doepel, Lapierre and Kennelly2002; Rabelo et al., Reference Rabelo, Rezende, Bertics and Grummer2005; Dann et al., Reference Dann, Litherland, Underwood, Bionaz, D’Angelo, McFadden and Drackley2006). Different results have also been reported for liver lipid/triacylglycerol (TAG) where one study has shown a decreased content post-calving for cows offered an H diet in the dry period compared to an L diet (Doepel et al., Reference Doepel, Lapierre and Kennelly2002), others the opposite (Rukkwamsuk et al., Reference Rukkwamsuk, Wensing and Geelen1998; Douglas et al., Reference Douglas, Overton, Bateman, Dann and Drackley2006), whereas others again have found no effect (Grum et al., Reference Grum, Drackley, Younker, LaCount and Veenhuizen1996; Tesfa et al., Reference Tesfa, Tuori, Syrjälä-Qvist, Pösö, Saloniemi, Heinonen, Kivilahti, Saukko and Lindberg1999; Rabelo et al., Reference Rabelo, Rezende, Bertics and Grummer2005). These discrepancies between studies are likely to be explained by a variety of factors, such as number of animals per treatment, time points for blood/liver sampling post-calving, inclusion/exclusion of cows with clinical/subclinical ketosis or other diseases, and last but not least, the differences obtained in body condition scores (BCS) at calving between cows offered an H or L diet.
A higher BCS at calving (>2.5) leads to a higher degree of mobilisation of body reserves in early lactation assessed by changes in BCS and live weight (Garnsworthy and Topps, Reference Garnsworthy and Topps1982a; Treacher et al., Reference Treacher, Reid and Roberts1986; Jones and Garnsworthy, Reference Jones and Garnsworthy1989) and would therefore be expected to cause higher blood NEFA and perhaps also higher liver TAG in early lactation, if cows are offered the same post-calving diet. In the trials mentioned earlier, concerning dry cow feeding, a period of 3 to 8 weeks in the dry period was mostly too short to create differences in BCS or live weight at calving (Grum et al., Reference Grum, Drackley, Younker, LaCount and Veenhuizen1996; Minor et al., Reference Minor, Trower, Strang, Shaver and Grummer1998; Tesfa et al., Reference Tesfa, Tuori, Syrjälä-Qvist, Pösö, Saloniemi, Heinonen, Kivilahti, Saukko and Lindberg1999; Doepel 5wet al., Reference Doepel, Lapierre and Kennelly2002) but not always (Agenäs et al., Reference Agenäs, Burstedt and Holtenius2003). Using the last 10 to 12 weeks of gestation to adjust BCS to obtain fat or thin cows has enabled differences in BCS at calving of 1.0 to 1.8 units (Garnsworthy and Topps, Reference Garnsworthy and Topps1982a; Jones and Garnsworthy, Reference Jones and Garnsworthy1988 and Reference Jones and Garnsworthy1989). However, few metabolites were measured in these studies, limited statistics were presented and, surprisingly, blood NEFA concentration was not always higher in fat cows when measured post-calving (Garnsworthy and Topps, Reference Garnsworthy and Topps1982b; Jones and Garnsworthy, Reference Jones and Garnsworthy1988 and Reference Jones and Garnsworthy1989).
Given that cows with a higher BCS at calving have a greater potential to mobilise body fat compared to cows with a lower BCS, it was of interest to investigate whether this mobilisation could be affected by energy intake in early lactation. In particular, increasing energy intake in early lactation could reduce mobilisation of body tissue in high BCS cows, thereby reducing the risk of ketosis and fatty liver. However, contrasting results have been obtained in this respect. One study showed that cows in good condition at calving offered either an H or L diet post-calving showed no difference in BCS in early lactation (Jones and Garnsworthy, Reference Jones and Garnsworthy1989), whereas another study found that fat cows mobilised less body reserves, assessed by BCS and live weight, if they were offered diet H compared to diet L (Garnsworthy and Jones, Reference Garnsworthy and Jones1993).
The present experiment examined the effect of offering either an H or L diet in both late gestation and early lactation on physiological parameters, BCS, live weight and milk production in early lactation. Production results in terms of milk yield, milk fat, milk protein and DMI are presented by Law et al. (Reference Law, Young, Hameleers, Patterson and Mayne2009). The main hypothesis to be tested was that cows fed a high-energy diet pre-calving would have a higher risk of metabolic stress/imbalance than cows fed a low-energy diet pre-calving, because of excessive fat mobilisation from adipose tissues. It was also our hypothesis that a high-energy diet post-calving would alleviate the metabolic stress of cows fed a high-energy diet pre-calving.
Material and methods
Animals and design
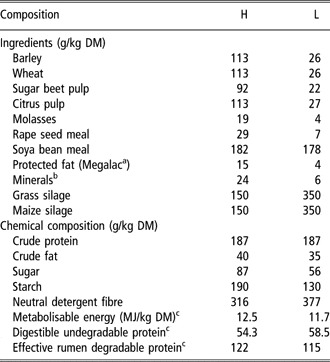
In all, 40 Holstein cows in second to sixth parity were blocked in groups of four according to parity, genetic merit for milk production, BCS assessed before the cow entered the trial and expected calving date. Cows within each block were allocated to one of four treatments in a 2 × 2 factorial design. The factors were H- or L-energy-density total mixed rations (TMRs) both pre- and post-calving, resulting in four treatments: HH, HL, LL and LH. The pre-calving treatment was initiated 100 days prior to expected calving, the L TMR was restricted to 10 kg DM/day and the H TMR was offered ad libitum until cows were dried off at day 42 before expected calving (further details in Law et al. (Reference Law, Young, Hameleers, Patterson and Mayne2009)). After drying off, cows on diet H were still fed ad libitum, whereas cows on diet L were restricted to 7.0 kg DM/day corresponding to 75% of metabolisable energy (ME) requirements (Agricultural and Food Research Council (AFRC), 1993). This level of restriction was shown to be effective in producing significant differences in BCS by Agenäs et al. (Reference Agenäs, Burstedt and Holtenius2003). Both diets were offered ad libitum post-calving until the end of the experiment at 70 days post-calving. The concentrate/roughage ratios of diets H and L were 70/30 and 30/70, respectively, providing 12.5 and 11.7 MJ ME/kg DM (Table 1). During the dry period, minerals were adjusted to standard dry-cow mineral requirements (Table 1). The cows were fed once a day at 1000 h. The cows were housed in a cubicle loose housing system and milked twice a day beginning at 0530 h and 1530 h. No incidences of clinical ketosis were observed.
Ingredients, chemical composition and energy value of the post-calving total mixed rations with high- (H) or low- (L) energy-density

DM = dry matter.
aVolac Ltd, Orwell, Hertfordshire, UK.
bMineral mix contained vitamins A, D and E (Devenish Nutrition, Belfast, UK). During the dry period, each cow received 120 g of a dry-cow mineral mix including vitamins A, D and E (Trouw Nutrition, UK).
cAs defined by AFRC (1993).
Measurements
The diets were offered in feeding boxes placed on load cells and the amount of feed consumed at every visit was recorded and used in the calculation of daily intake, from which weekly means were calculated. BCS were determined weekly on a scale from 0 (thin) to 5 (fat), rising in 0.25-point intervals according to Edmonson et al. (Reference Edmonson, Leen, Weaver, Farver and Webster1989). Milk yield was recorded at every milking and used in the calculation of daily yield, from which weekly means were calculated. Milk samples were collected weekly during two consecutive milkings (a.m. and p.m.) and analysed for fat, protein and lactose, which were used for calculating energy-corrected milk (ECM) yield (Sjaunja et al., Reference Sjaunja, Baevre, Junkarinen, Pedersen and Setala1990). Milk samples that were analysed for beta-hydroxybutyrate (BHB) were collected at 0100 h and 1300 h milking on two consecutive days, once a week, for the first 7 weeks post-calving. Milk samples were stored at −18°C until they were analysed for BHB using the method described by Nielsen et al. (Reference Nielsen, Ingvartsen and Larsen2003).
Blood samples were collected once weekly between 0900 and 1100 h from week 3 pre-calving to week 10 post-calving, by puncture of the coccygeal vein/artery using heparinised Vacutainer tubes (BD Vacutainer Systems, Plymouth, UK). Plasma was harvested, following centrifugation at 2000 × g for 20 min at 4°C, and stored at −18°C until analysis. Glucose (enzymatic basis: glucose hexokinase), NEFA (enzymatic basis: acyl-CoA-synthetase and acyl-CoA-oxidase) and urea (enzymatic basis: urease and glutamate dehydrogenase) in plasma were analysed on an autoanalyser (Hitachi, Tokyo, Japan) using commercially available kits (Boehringer Mannheim GmbH, Mannheim, Germany and Wako Chemicals GmbH, Neuss, Germany). BHB in plasma was also determined on an autoanalyser (Hitachi, Tokyo, Japan) according to the method of McMurray et al. (Reference McMurray, Blanchflower and Rice1984).
Liver biopsies were taken at −13, 10, 22 and 56 days post-calving from four cows on each of the four treatments. Liver biopsies (approximately 20 mg wet weight per biopsy) were obtained through an incision on the right side of the cow between the 10th and 11th rib, where it crossed a line from the hip (tuber coxae) to the upper part of the right front leg (mid-humerus). Before taking the biopsies, a 5 × 5 cm2 area was shaved and disinfected whereupon a local anaesthesia was given. After a minimum of 10 min, a 0.5-cm incision in the skin was made. Liver biopsies were taken from this incision using a PRO-MAG biopsy instrument with 14 gauge × 10 cm needles (MDTECH, FL, USA). The biopsies were immediately frozen in liquid nitrogen and later stored at −80°C until analysed. Liver biopsies were homogenised, centrifuged and the supernatant analysed for glycogen and TAG content on an autoanalyser, based on enzymatic colorimetric kits (Andersen et al., Reference Andersen, Mashek, Larsen, Nielsen and Ingvartsen2002b).
Statistical analyses
Data were analysed using the MIXED procedure of SAS (SAS Institute, 1999). The effects of diet H and L pre-calving on energy intake, BCS and blood metabolites pre-calving were analysed using a model including weeks pre-calving (−3, −2, −1 for blood metabolites) and pre-calving TMR (H, L) as fixed effects. The variability in time from last sample to calving was not accounted for in the analyses. The content of TAG and glycogen in the liver 13 days pre-calving was analysed with a model including pre-calving TMR (H, L) as a fixed effect. The effects of diet H and L, pre- and post-calving, on post-calving energy intake; ECM yield; BCS; live weight and metabolites in blood and milk were analysed using a model including weeks from calving (1 to 10); pre-calving TMR (H, L) and post-calving TMR (H, L) as fixed effects and all their interaction terms. Liver TAG and glycogen were analysed using the same model except that it included days 10, 22 and 56 post-calving, instead of weeks. The model for BHB in milk included weeks 1 to 7 post-calving. In the models with repeated samplings across weeks/days, the REPEATED statement in SAS was used and the covariance structure yielding the best fit was chosen (SAS defined ARH(1) for live weight, NEFA, ECM, LiverTAG and AR(1) for the rest), assessed by Akaike’s information criterion. The PDIFF option of the LSMEANS statement was used to identify which pair-wise differences between treatment combinations (HH, HL, LH and LL) were significant. The PDIFF option was used with a Tukey statement to adjust significance tests for multiple comparisons.
Results
Effect of pre-calving diet on pre-calving measurements
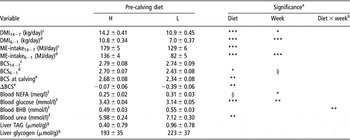
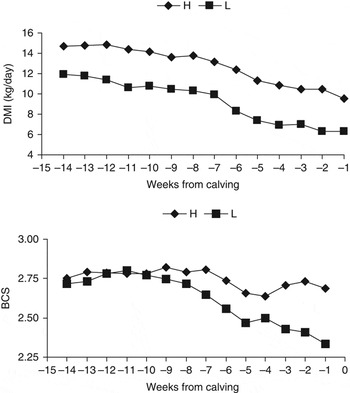
Production results in terms of milk yield, milk fat, milk protein and DMI are presented by Law et al. (Reference Law, Young, Hameleers, Patterson and Mayne2009). The effects of pre-calving diet on pre-calving measurements are presented in Table 2 and DMI and BCS are further presented in Figure 1. As expected, cows offered diet H pre-calving had a 3.3 kg/day higher DMI than cows offered diet L during late lactation, whereas the difference was marginally higher (3.8 kg/day) during the last 6 weeks of gestation because of the restriction of cows offered diet L. DMI of both diets decreased gradually during late lactation and the dry period (Figure 1). ME intake changed similarly to DMI. BCS was not different between diets during late lactation (weeks 14 to 7 pre-calving) but an average difference of 0.27 units (P < 0.05) was obtained across the last 6 weeks of gestation and at calving; the difference was 0.34 units (P < 0.01; Figure 1). Cows receiving diet H were overfed relative to standard requirements for dry cows (AFRC, 1993) but not overfat, as they had a BCS of 2.68 at calving, whereas cows offered diet L had a BCS of 2.34. BCS at the start of the pre-calving period was 2.74 (Figure 1). Thus, cows offered diet H or L pre-calving lost 0.07 and 0.39 units of BCS during the last 14 weeks of gestation (P < 0.01), respectively. Blood NEFA showed a tendency (P = 0.08) to be higher and blood glucose was lower (P < 0.001) in cows offered diet L compared to cows offered diet H. Blood NEFA increased during the last 3 weeks of the dry period, whereas blood glucose showed the same level in weeks 3 and 2 pre-calving and then decreased in the week prior to calving (data not shown). Blood BHB was generally not affected by the diet, although an interaction (P < 0.01) between diet and week indicated that blood BHB was higher in week 2 pre-calving in cows offered diet L. Blood urea was higher in cows offered diet L compared to cows offered diet H (P < 0.05; Table 1). The content of TAG and glycogen in the liver 13 days pre-calving was not significantly affected by diet.
Least square means (±s.e.) of pre-calving dry matter intake (DMI), metabolisable energy (ME) intake, body condition score (BCS) and metabolites in blood and liver for cows offered a high- (H) or a low- (L) energy-density diet pre-calving

NEFA = non-esterified fatty acids; BHB = beta-hydroxybutyrate; TAG = triacylglycerol.
aP values indicated by §P < 0.1; *P < 0.05; **P < 0.01; ***P < 0.001.
bThe interaction term was tested for all variables except BCS at calving, ΔBCS, liver TAG and liver glycogen.
cCovering week 14 to week 7 pre-calving.
dCovering week 6 to week 1 pre-calving.
eBCS at calving was calculated as an average of BCS assessed in week −1 and +1 post-calving; ΔBCS was calculated as the difference between BCS in week −14 and BCS at calving.
fBlood samples were collected in weeks 3, 2 and 1 pre-calving.
gLiver biopsies were taken at day 13 pre-calving. Liver TAG and glycogen were based on eight cows per diet, whereas the other variables were based on 20 cows per diet. Liver TAG and glycogen are per g wet weight of tissue.
Least square means of dry matter intake (DMI) and body condition score (BCS) in cows offered a high- (H) or low- (L) energy-density diet for the last 14 weeks of gestation. Cows were dried off in week 6 pre-calving. The average standard errors for DMI were 0.52 and 0.58 for diet H and L, respectively, and 0.07 and 0.08 for BCS.

Effect of pre- and post-calving diet on production variables post-calving
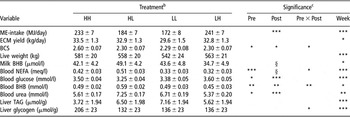
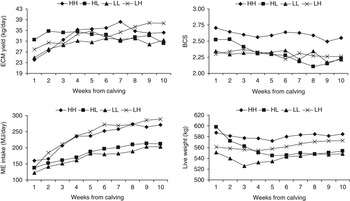
The effects of pre- and post-calving diet on post-calving production variables are presented in Table 3 and Figure 2. The pre-calving diet had no effect on post-calving ME-intake, live weight and ECM yield. An interaction (P = 0.06) between post-calving diet and weeks of lactation revealed that cows fed diet H post-calving had a higher ECM yield, except for the first few weeks after calving. ME-intake and ECM yield were lowest in the first week after calving and then increased as lactation progressed in the first 10 weeks after calving. An interaction (P < 0.05) between pre- and post-calving diets revealed that cows on treatment HH had a higher BCS post-calving than cows on the other three treatments (Table 3) and thus, that the post-calving diet had an effect on BCS but only when cows had been offered diet H pre-calving (Figure 2). Overall, BCS was not significantly affected by weeks from calving (Table 3) but HL cows lost significantly more BCS than the other treatments (Figure 2). Live weight generally decreased during the first few weeks post-calving and was rather constant thereafter, throughout the trial period (Figure 2).
Least square means (±s.e.) of post-calving production variables and physiological parameters for cows offered a high- (H) or a low- (L) energy-density diet pre- and post-calvingFootnote a

ME = metabolisable energy; ECM = energy-corrected milk; BCS = body condition score; BHB = beta-hydroxybutyrate; NEFA = non-esterified fatty acids; TAG = triacylglycerol.
a Measurements were made weekly in the first 10 weeks of lactation, except for BHB in milk where it was the first 7 weeks post-calving, and liver TAG and glycogen where liver biopsies were taken 10, 22 and 56 days post-calving. Liver TAG and glycogen were based on four cows per treatment, whereas the other variables were based on 10 cows per treatment.
b The first letter refers to the pre-calving diet and the second letter to the post-calving diet.
c P values indicated by §P < 0.1, *P < 0.05, **P < 0.01, ***P<0.001.
The interaction term Pre × Week was only significant for milk BHB. The interaction term Post × Week was only significant for ME-intake and tended to be significant for ECM (P = 0.06). The three-way interaction term Pre × Post × Week was not significant for any variables.
Least square means of energy corrected milk (ECM) yield, energy intake, body condition score (BCS) and live weight for cows offered a high- (H) or low- (L) energy-density diet pre- and post-calving. Thus, HL refers to cows that were offered an H diet pre- and an L diet post-calving. The average standard errors across treatments and weeks were: ECM yield, 1.1; energy intake, 10.3; BCS, 0.10 and live weight, 22. Cows on treatment HH had a significantly higher BCS post-calving than cows on the other three treatments. Metabolisable energy intake and ECM yield were significantly higher in cows offered diet H post-calving, except for the first 3 weeks of lactation.

Compared to the pre-calving diet, the post-calving diet had more influence on production variables. Thus, ME-intake and ECM yield were higher in cows offered diet H post-calving, except for the first 2 to 3 weeks of lactation (interaction between weeks and post-calving diet, P < 0.05).
Effect of pre- and post-calving diet on metabolites post-calving
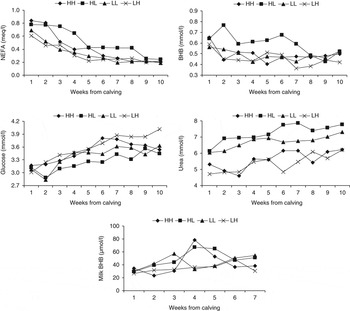
The effects of pre- and post-calving diet on post-calving blood, milk and liver metabolites are presented in Table 3 and Figures 3 and 4. Cows offered diet H pre-calving had higher post-calving concentrations of blood NEFA and urea, and lower glucose concentrations compared to cows offered diet L pre-calving (Table 3). An interaction (P < 0.05) between diets offered pre- and post-calving revealed that cows on treatment HL had higher blood concentrations of NEFA and BHB than cows on the other three treatments (Table 3) and thus, that the post-calving diet had an effect on NEFA and BHB but only when cows had been offered diet H pre-calving. Cows offered diet H post-calving had higher concentrations of glucose and lower concentrations of urea compared to cows offered diet L post-calving. Blood metabolites were influenced by weeks from calving, resulting in increasing glucose and urea concentrations during the first 10 weeks of lactation, whereas BHB and especially NEFA decreased (Figure 3).
Least square means of non-esterified fatty acids (NEFA), glucose, beta-hydroxybutyrate (BHB) and urea in blood and BHB in milk for cows offered a high- (H) or low- (L) energy-density diet pre- and post-calving. Thus, HL refers to cows that were offered an H diet pre- and an L diet post-calving. The average standard errors across treatments and weeks were: NEFA, 0.07; glucose, 0.11; blood BHB, 0.06; urea, 0.44 and milk BHB, 8.7. Note that BHB in milk was only measured the first 7 weeks of lactation. Cows on treatment HL had a significantly higher blood concentration of NEFA and BHB than cows on the other three treatments. Cows offered diet H post-calving had significantly higher concentrations of glucose and lower concentrations of urea compared to cows offered diet L post-calving.

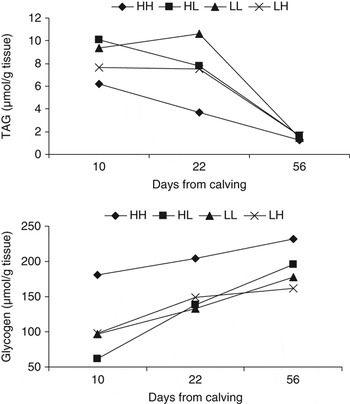
Least square means of triacylglycerol (TAG) and glycogen in liver tissue for cows offered a high- (H) or low- (L) energy-density diet pre- and post-calving. Thus, HL refers to cows that were offered an H diet pre- and an L diet post-calving. The average standard errors across treatments and days were 2.2 and 27 for TAG and glycogen, respectively. Cows on treatment HH had a significantly higher concentration of liver glycogen compared to the other three treatments.

Beta-hydroxybutyrate in milk was higher in weeks 4 and 5 for cows offered diet H pre-calving (interaction between weeks and pre-calving diet, P < 0.05) and there was a tendency (P = 0.08; Figure 3) that diet H post-calving caused lower levels of BHB in milk. The content of liver TAG post-calving was unaffected by pre- and post-calving diet. An interaction (P < 0.05) between pre- and post-calving diets revealed that cows on treatment HH had a higher concentration of glycogen in the liver compared to the other three treatments (Table 3) and thus, that the post-calving diet had an effect on glycogen content but only when cows had been offered diet H pre-calving. Liver TAG and glycogen were influenced by time from calving resulting in lower TAG and higher glycogen concentrations as lactation progressed (Figure 4).
Discussion
Effect of diet on pre-calving measures
A primary objective of this study was to create differences in BCS at calving between cows by offering diets with low or high energy content in late gestation. A limited, but significant difference in BCS at calving was obtained because cows on diet L lost more body condition during the last 14 weeks of gestation, and particularly during the last 6 weeks, relative to the cows offered diet H (Figure 1). Given that the differences in calculated ME contents of H and L were small, the differences in energy intake pre-calving were largely the result of differences in DMI brought about by the restricted feeding of diet L. It was surprising that cows on diet H did not gain condition but actually tended to lose condition during the dry period, but this has also been reported in other studies (Grum et al., Reference Grum, Drackley, Younker, LaCount and Veenhuizen1996; Tesfa et al., Reference Tesfa, Tuori, Syrjälä-Qvist, Pösö, Saloniemi, Heinonen, Kivilahti, Saukko and Lindberg1999). The explanation for this lack of gain in BCS for cows offered diet H pre-calving could partly be attributed to a higher milk yield during late lactation (data not shown) than cows offered diet L; as has also been reported by Ingvartsen et al. (Reference Ingvartsen, Foldager, Aaes and Andersen1995), these cows appear to have channelled the extra energy supply into milk rather than body reserves. However, cows offered diets H or L were provided with 136 and 82 MJ ME/day, respectively, during the last 6 weeks of gestation, which should have been sufficient to create greater differences in condition score than the 0.34 units observed here (Garnsworthy and Topps, Reference Garnsworthy and Topps1982a; Agenäs et al., Reference Agenäs, Burstedt and Holtenius2003). For example, Agenäs et al. (Reference Agenäs, Burstedt and Holtenius2003) obtained a difference of 1.0 unit BCS between two groups of cows by feeding 71 and 106 MJ ME/day during an 8-week dry period.
The content of TAG and glycogen in the liver pre-calving was unaffected by diet, which has also been the case in other studies where liver samples have been collected 2 to 1 weeks pre-calving (Rukkwamsuk et al., Reference Rukkwamsuk, Wensing and Geelen1998; Tesfa et al., Reference Tesfa, Tuori, Syrjälä-Qvist, Pösö, Saloniemi, Heinonen, Kivilahti, Saukko and Lindberg1999), and it must therefore be concluded that it is difficult to affect liver TAG and glycogen 2 to 1 weeks pre-calving by differences in feeding intensity (assuming no pre-treatment differences in liver TAG). The higher glucose and lower NEFA concentrations during the last 3 weeks of gestation (Table 2) in cows offered the H diet suggest that these cows were mobilising less body fat than cows offered diet L, which was attributable to the differences in energy intake. A similar effect has also been observed during the last few weeks of gestation in other experiments (Grum et al., Reference Grum, Drackley, Younker, LaCount and Veenhuizen1996; Holtenius et al., Reference Holtenius, Agenäs, Delavaud and Chilliard2003; Rabelo et al., Reference Rabelo, Rezende, Bertics and Grummer2005; Douglas et al., Reference Douglas, Overton, Bateman, Dann and Drackley2006).
Effect of diet on post-calving measures
There was no effect of pre-calving diet on energy intake post-calving, which is in accordance with results from other studies where limited effects on BCS at calving have been obtained (Grum et al., Reference Grum, Drackley, Younker, LaCount and Veenhuizen1996; Tesfa et al., Reference Tesfa, Tuori, Syrjälä-Qvist, Pösö, Saloniemi, Heinonen, Kivilahti, Saukko and Lindberg1999; Keady et al., Reference Keady, Mayne, Fitzpatrick and McCoy2001; Dann et al., Reference Dann, Litherland, Underwood, Bionaz, D’Angelo, McFadden and Drackley2006). However, if the difference in BCS at calving had been of greater magnitude, a higher post-calving ME-intake would have been expected for cows which had been offered diet L pre-calving (Treacher et al., Reference Treacher, Reid and Roberts1986; Garnsworthy and Jones, Reference Garnsworthy and Jones1993; Agenäs et al., Reference Agenäs, Burstedt and Holtenius2003; Douglas et al., Reference Douglas, Overton, Bateman, Dann and Drackley2006). As expected, feeding diet H post-calving led to a higher ME-intake but surprisingly ECM yield was not significantly increased. One possibility is that the low forage : concentrate ratio of 30 : 70 could have caused an impaired rumen environment, resulting in reduced digestibility of the fibre fraction in the ration and thereby lowering net energy available for milk production in cows fed diet H. Cows on treatment HL had numerically higher ECM yield than those on treatment LL, although this difference was not significant. The higher ECM yields for cows on treatment HL could be attributed to a significantly higher mobilisation of body reserves (Figure 2) and a slightly higher energy intake post-calving compared to cows on treatment LL (Table 3).
Normally, a significant decrease in BCS would be expected during early lactation (Reist et al., Reference Reist, Erdin, von Euw, Tschuemperlin, Leuenberger, Delavaud, Chilliard, Hammon, Kuenzi and Blum2003; Andersen et al., Reference Andersen, Friggens, Larsen, Vestergaard and Ingvartsen2004), but in the present study, BCS curves were relatively flat during the first 10 weeks of lactation, except for cows on treatment HL. This could be explained by the relatively low BCS at calving and thereby limited amounts of body fat available for mobilisation, an effect which has been illustrated by Broster and Broster (Reference Broster and Broster1998). The live weight curves were also relatively flat during early lactation, except for cows on treatment HL that lost around 50 kg live weight during the first 5 weeks of lactation, which corresponded to the changes observed in BCS. Post-calving blood concentrations of NEFA also indicated that cows on treatment HL mobilised more body reserves than cows on the other treatments. The higher NEFA concentrations, post-calving, in cows offered diet H pre-calving were most likely because of the higher BCS of these cows at calving and thus their tendency to mobilise more in the first weeks of lactation (Figure 2); this is in accordance with other studies where a difference in BCS was obtained during the last part of gestation (Reid et al., Reference Reid, Roberts, Treacher and Williams1986; Holtenius et al., Reference Holtenius, Agenäs, Delavaud and Chilliard2003). The higher BHB level and lower glucose level post-calving in cows on treatment HL was probably a consequence of their higher NEFA level that was partly oxidised to ketone bodies in the liver. A higher glucose level post-calving because of a lower BCS at calving has also been reported by Holtenius et al. (Reference Holtenius, Agenäs, Delavaud and Chilliard2003) 1 to 4 weeks post-calving, whereas other studies have found no effect (Reid et al., Reference Reid, Roberts, Treacher and Williams1986; Jones and Garnsworthy, Reference Jones and Garnsworthy1988).
The high loss of body reserves in the first weeks of lactation for cows on treatment HL compared to cows on treatment LL suggests that some priority is being set by the cow to mobilise as long as body reserves are available in early lactation. In this context, cows fed L pre-calving had a level of body reserves that was low enough for them not to mobilise even when fed L post-calving, and HH cows had no need to mobilise as they received the energy-dense feed. These different mobilisation ‘strategies’ were achieved without significantly affecting ECM. A physiological explanation for this mobilisation could be some degree of insulin resistance, which has been shown to occur in early lactation cows that were overfed during the dry period (Holtenius et al., Reference Holtenius, Agenäs, Delavaud and Chilliard2003). The interaction between diets offered pre- and post-calving for BCS and blood NEFA indicates that the higher degree of mobilisation by cows offered diet H pre-calving can be limited post-calving by feeding an energy-rich diet, as cows on treatment HH lost fewer body reserves as assessed by BCS, live weight and blood NEFA than cows on treatment HL. Thus, cows in good condition at calving should be fed an energy-rich diet in order to reduce the mobilisation of body reserves and increase milk yield.
The higher glucose concentration in cows offered diet H post-calving is in accordance with other trials in which different energy densities have been offered post-calving (Nachtomi et al., Reference Nachtomi, Halevi, Bruckental and Amir1991; Dhiman et al., Reference Dhiman, Cadorniga and Satter1993; Reist et al., Reference Reist, Erdin, von Euw, Tschuemperlin, Leuenberger, Delavaud, Chilliard, Hammon, Kuenzi and Blum2003; Andersen et al., Reference Andersen, Friggens, Larsen, Vestergaard and Ingvartsen2004) and likewise for the lowered NEFA (Nachtomi et al., Reference Nachtomi, Halevi, Bruckental and Amir1991; Dhiman et al., Reference Dhiman, Cadorniga and Satter1993; Reist et al., Reference Reist, Erdin, von Euw, Tschuemperlin, Leuenberger, Delavaud, Chilliard, Hammon, Kuenzi and Blum2003). The higher glucose level post-calving for cows offered diet H post-calving was most likely caused by a higher absorption of glycogenic precursors, especially starch, because of a higher DMI. The higher blood urea content in cows offered diet L post-calving was most likely a consequence of its higher content of crude protein derived from more rumen degradable ingredients compared to diet H (Table 1).
The absence of a significant ‘NEFA-effect’ on liver TAG suggests that the liver of cows offered diet H pre-calving had decreased uptake of NEFA, increased beta-oxidation of NEFA, decreased esterification of NEFA or an increased export of TAG. It is noteworthy that the level of TAG pre- and post-calving was lower than has been reported elsewhere, whereas glycogen was similar (Andersen et al., Reference Andersen, Larsen, Nielsen and Ingvartsen2002a; Nielsen et al., Reference Nielsen, Friggens, Larsen, Andersen, Nielsen and Ingvartsen2007). An explanation for the generally lower liver TAG content could be the relatively low losses of BCS post-calving in this study compared to the experiments mentioned earlier.
Conclusion
This experiment has shown that feeding a high- v. low-energy-density diet in the last 100 days of gestation created a small but significant difference in BCS at calving. ECM yield and ME intake in the subsequent early lactation were not affected by pre-calving diets. Changes in BCS and blood concentrations of NEFA, BHB and glucose in early lactation showed that cows in adequate condition at calving (offered diet H pre-calving) generally mobilised more body reserves compared to cows in poorer condition (offered diet L pre-calving). Cows in good condition at calving benefited from diet H post-calving in terms of lower mobilisation of body reserves compared to cows in good condition offered diet L post-calving. Cows in poorer condition at calving (offered diet L pre-calving) did not mobilise differently whether they were offered diet H or L post-calving.
Acknowledgements
The authors thank the technical staff at Hillsborough for their work with sampling of milk, blood and liver tissue and preparing datasets; in particular Brian Hunter, Stephen Gilkinson, Ken McKinley, Kenny Clark, Mike Davies and Sandy Rankin. The analysis of blood samples at the Veterinary Sciences Division is greatly acknowledged. Klaus Lønne Ingvartsen, Sinclair Mayne and Desmond Patterson are thanked for their comments on this manuscript. The authors also thank Lene Niklassen, Dorte Agnholt, Jens Balslev Clausen and Carsten Berthelsen for the analyses of liver biopsies and BHB in milk. The Department of Agriculture and Rural Development for Northern Ireland and AgriSearch funded this study. The Danish participation in the study was funded by a grant financed by the Directorate for Food, Fisheries and Agri Business, the Danish Cattle Association and the Danish Institute of Agricultural Sciences.