Introduction
The Đurđevac Sands in northeastern Croatia constitute a small-scale and stabilized dune relief, bordering the southern limit of the Drava River valley (Fig. 1a, b). Even though their aeolian origin was clearly recognized in the previous century (see references in Franjo, Reference Franjo1997), the circumstances and timing of the formation of dunes and their stabilization remain hypothetical due to a lack of chronological and paleoenvironmental data. However, exploring and resolving this aeolian archive would significantly increase our understanding of aeolian landscape evolution in the southern part of the Pannonian Basin (i.e., the chronology of events and the paleoenvironmental conditions). Furthermore, it would allow potential correlations with other areas in the Pannonian Basin, as well as elsewhere in Europe, such as the European Sand Belt (ESB).
Location of the study area and sites mentioned in the text. (a) Location of the Đurđevac area (#1) in Europe (EuroDEM https://www.mapsforeurope.org/datasets/euro-dem; [accessed 8 November 2023]); #2 refers to the Inner Somogy area (Hungary); #3 refers to the Danube–Tisza interfluve area (Hungary); #4 refers to the Nyirség area (Hungary); #5 refers to the East Slovak Basin (Slovakia); #6 refers to the Morava Basin (Czechia); #7 refers to the Deliblato Sands area (Serbia). Altitudes are in meters above sea level (m asl). (b) Digital elevation model of the Đurđevac area. See Figure 2 for the corresponding position of the black rectangle. The same rectangle also refers to the areas depicted in Figure 3. The red dot indicates the position of the sand pit. Altitudes are in m asl. AT = Austria, BA = Bosnia and Herzegovina, HR = Croatia, HU = Hungary, IT = Italy, RO = Romania, RS = Serbia, SI = Slovenia

Various episodes of aeolian activity, such as strong aeolian deflation (Sebe et al., Reference Sebe, Csillag, Ruszkiczay-Rüdiger, Fodor, Thamó-Bozsó, Müller and Braucher2011), loess accumulation (Marković et al., Reference Marković, Stevens, Kukla, Hambach, Fitzsimmons, Gibbard and Buggle2015) and sand dune development (Gábris et al., Reference Gábris, Horváth, Novothny and Ruszkiczay-Rüdiger2012) have been reported in the Pannonian Basin (Fig. 1a). In Hungary, in the northern Pannonian Basin, Late Pleistocene and Holocene aeolian activity has been registered at the Danube–Tisza interfluve (Ujházy et al., Reference Ujházy, Gábris and Frechen2003), the Gödöllő Hills (Novothny et al., Reference Novothny, Frechen and Horvath2010), and the Nyirség area (Kiss et al., Reference Kiss, Sipos, Mauz and Mezősi2012; Buró et al., Reference Buró, Sipos, Lóki, Andrási, Félegyházi and Négyesi2016). Aridification and declining vegetation cover is usually seen as the main driving factors, while during later Holocene periods human pressure on the landscape is mentioned as a major driver (Buró et al., Reference Buró, Sipos, Lóki, Andrási, Félegyházi and Négyesi2016).
Farther north, in Czechia (Morava Basin) and Slovakia (East Slovak Basin), dune systems have been studied, emphasizing the role of the atmospheric circulation pattern on dune orientation, as well as the effect of local topography (Holuša et al., Reference Holuša, Nývlt, Woronko, Matějka and Stuchlík2022, 2024; Bónová et al., Reference Bónová, Bóna, Mikuš and Ferková2024). In the southern part of the Pannonian Basin, in northern Serbia, the earliest phases of aeolian activity and dune formation are dated to the Pleniglacial, while subsequent aeolian activity occurred during the Late Glacial and the Holocene. Dune formation is usually attributed to declining vegetation cover during drier periods (Sipos et al., Reference Sipos, Marković, Gavrilov, Balla, Filyó, Bartyik and Mészáros2022; Marković et al., Reference Marković, Perić, Gavrilov, Markovic, Vandenberghe, Schaetzl and Obreht2024) and attributed to SE winds in (north)eastern Serbia, and NW winds in northern Serbia. While in the south of the Pannonian Basin steppe vegetation dominated throughout the Pleniglacial and Late Glacial, with little variation during interstadials and stadials (Magyari et al., Reference Magyari, Pál, Vincze, Veres, Jakab, Braun, Szalai, Szabó and Korponai2019; Obreht et al., Reference Obreht, Zeeden, Hambach, Veres, Marković and Lehmkuhl2019), in the north cool or mixed coniferous forest could develop at the end of the Pleniglacial and in the Late Glacial (Magyari et al., Reference Magyari, Pál, Vincze, Veres, Jakab, Braun, Szalai, Szabó and Korponai2019). During colder periods, the growing period was shorter, and biomass production was smaller, which might have played a role in triggering aeolian activity, rather than the vegetation type itself (Obreht et al., Reference Obreht, Zeeden, Hambach, Veres, Marković and Lehmkuhl2019). Phases of landscape stability, with less aeolian activity and soil formation, have been described in Hungary (Buró et al., Reference Buró, Sipos, Lóki, Andrási, Félegyházi and Négyesi2016), in Serbia (Marković et al., Reference Marković, Perić, Gavrilov, Markovic, Vandenberghe, Schaetzl and Obreht2024) and northern Croatia (Galović et al., Reference Galović, Beerten, Hećej and Posilović2023a). The paleosoils consistently show a Bølling-Allerød (BA) age (ca. 15–13 ka).
In northern and western Europe, in the European Sand Belt (ESB), extensive aeolian sand sheets and dune fields developed during the Pleniglacial and the Late Glacial. The initiation of sand movement and the subsequent formation of sand sheets and dunes in the ESB during the Late Weichselian has been attributed to different factors, including the availability of a sand source (e.g., thick fluvial deposits), the sparse or non-existing vegetation, the depth of the groundwater table, low and periodical sand supply, permafrost degradation, and finally increased aridity (see Kasse, Reference Kasse1997; Łopuch et al., Reference Łopuch, Zieliński and Jary2023). Parabolic dunes seem to be the most common aeolian landform in the EBS (Łopuch et al., Reference Łopuch, Zieliński and Jary2023, and references therein). Permafrost melting during the latest part of the Pleniglacial seems to have triggered the development of sand sheets in northwestern Europe (Kasse, Reference Kasse1997), while the formation of dunes is more typical for the Younger Dryas (Kasse et al., Reference Kasse, Vandenberghe, De Corte and Van den Haute2007, Reference Kasse, Woolderink, Kloos and Hoek2020). Similar to the Pannonian Basin, a Late Glacial soil developed and is widespread across the ESB, known as the Usselo and/or Finnow soil (Derese et al., Reference Derese, Vandenberghe, Paulissen and Van den Haute2009; Kaiser et al., Reference Kaiser, Hilgers, Schlaak, Jankowski, Kuhn, Bussemer and Przegiȩtka2009; Vandenberghe et al., Reference Vandenberghe, Derese, Kasse and Van den haute2013; Kasse et al., Reference Kasse, Woolderink, Kloos and Hoek2020).
Based on the principle of superposition, Hećimović (Reference Hećimović1988) assigned an exclusively Holocene age to the Đurđevac Sands in Croatia. This view was later revised by Franjo (Reference Franjo1997), who distinguished three periods of aeolian activity, without the use of real age markers: Pleniglacial maximum (ca. 20 ka), Early Holocene Boreal period (ca. 10 ka), and finally during the seventeenth through nineteenth centuries. Aeolian reworking of larger dunes since the Middle Ages, and subsequent dune stabilization since the late nineteenth century is further documented by Petrić (Reference Petrić2009). Franjo (Reference Franjo1997) also mentioned the presence of at least two relict pedological horizons in the dune sands.
The objective of this paper is to describe the morphology of one of the dune areas constituted by the Đurđevac Sands and elucidate the timing and causes of aeolian activity (dune formation) and landscape stabilization from outcrop investigations, Digital elevation model (DEM) data, and geophysical soundings. Finally, the findings will be placed in a broader regional (Pannonian Basin) and supra-regional (ESB) context where similar and/or time-equivalent dunes, sediments, and paleosoils have been described.
Geological setting
In northern Croatia, the sedimentary record is mostly continuous, from the Neogene to the Quaternary, and is related to the sedimentary evolution of the Pannonian Basin (Pavelić, Reference Pavelić2002), which was influenced by active tectonics during the Quaternary (Prelogović et al., Reference Prelogović, Saftić, Kuk, Velić, Dragaš and Lučić1998).
The Đurđevac Sands are located in the southwestern marginal part of the Pannonian Basin, next to the peri-alpine area (Fig. 2). Alpine rivers, such as the Drava, quickly change from erosional to aggradational mode soon after leaving peri-alpine Slovenia and form broad floodplains in Croatia. These floodplains are predominantly composed of Alpine material (Zakwan et al., Reference Zakwan, Pham, Bonacci and Đurin2022). The Pleistocene sediment succession mainly consists of alluvial and aeolian sediments (Fig. 2) (Wacha et al., Reference Wacha, Matoš, Kunz, Lužar-Oberiter, Tomljenović and Banak2018).
Geological map of the area (after Hećimović, Reference Hećimović1988). The Đurđevac Sands correspond with the assumed Holocene aeolian sands indicated by ‘p’. The red asterisk is added to indicate that these sands are proven to be at least partially Late Pleistocene in age, as shown in Galović et al. (Reference Galović, Beerten, Hećej and Posilović2023a). The red dot indicates the position of the Draganci sandpit. For the location of the black rectangle see Figure 1. The coordinate system of this map is EPSG:3765 – HTRS96.

During the Pleistocene glaciations, an increase in the volume of ice resulted in intense physical weathering of rocks in the Alps. This material was subsequently transported, and fragmented, by newly formed rivers (such as the Drava River) to lowlands and floodplains (such as the Podravina area) (Hećimović, Reference Hećimović1987). Gravels, sands, and even finer-grained material were deposited in these floodplains. According to Hećimović (Reference Hećimović1987), the sand fraction was repeatedly redeposited by northwestern winds and formed dunes during the Holocene (later revised by Galović et al., Reference Galović, Beerten, Hećej and Posilović2023a), the so-called Đurđevac Sands (Fig. 2). These natural separation processes resulted in the accumulation of medium-sorted sand with a high percentage of heavy-mineral fraction (HMF) (7–54%). The light-mineral fraction (LMF) is dominated by quartz, and the HMF is dominated by garnet (Hećimović, Reference Hećimović1987; Galović and Posilović, Reference Galović, Posilović, Bašić and Feletar2017), reflecting the composition of the original fluvial material. Within the dune sands, several darker horizons have been observed and interpreted as paleosoils, such that the sand must have been deposited in several separate phases of strong aeolian activity (Franjo, Reference Franjo1997).
The Đurđevac Sands (symbol ‘p’ in Fig. 2) discordantly lie on top of the Pleistocene loess of the Bilogora Mt. slopes (‘l’), as well as in the Drava River valley on top of the assumed Holocene sands and gravels of the second alluvial terrace (‘a2’) and partially on organic-rich marshy sediments (‘b’). The age of the Đurđevac Sands was thus determined by the superposition principle, based on the assumed Holocene age of the underlying material in the Drava River valley (‘a2’ and ‘b’). Recent radiocarbon dating from a paleosoil found within the Đurđevac Sands indicates that the lower aeolian units must have been deposited already during the Pleistocene (Galović et al., Reference Galović, Beerten, Hećej and Posilović2023a), which disproves the assumed Holocene age of the dune sands.
Methodology
Digital elevation model (DEM)
A high-resolution digital elevation model is generated from a ground-classified point cloud dataset. The resolution of the ground points is around 4 points per m2, from which we generated the DEM using the average binning method with a one-meter resolution and resample raster using linear interpolation with a two-meter resolution for manageable handling and field investigation. For usage in a GIS environment, we used the HTRS96/TM coordinate system and the HVRS71 elevation reference system. For further morphological investigation, several visualizations of the DEM were generated, including hillside and color relief. Individual dune fragments were individualized based on the classification scheme of du Pont et al. (Reference du Pont, Rubin, Narteau, Lapôtre, Day, Claudin and Livingstone2024) and the corresponding dune heights for the different dune fragments were determined. Note that only part of the Đurđevac Sands dune relief was analyzed in the DEM, given that a suitable outcrop could be found only in that area at the time of the field survey (Fig. 1b).
Geoelectrical soundings
Geophysical investigations were carried out using specific electrical resistivity methods arranged in five profiles, s-1 to s-5. Thirty geoelectric soundings were measured (distributed over the 5 profiles) covering a total length of several kilometers. Geoelectric soundings were performed using the Schlumberger symmetrical array of direct current and potential electrodes with an electric range AB/2 of up to 200 meters. A direct electrical source was used as a power supply. A transistor compensation instrument (TK-24; manufactured by Geoinstitut Belgrade, now Geological Survey of Serbia) was used for measuring. Data processing was done using Res2dinv software. Quantitative interpretation of geoelectric data was based on a determination of the value of the electrical resistivity and thickness of the registered geoelectrical units. Values of electrical resistivity for various sediments were determined based on Lévesque et al. (Reference Lévesque, Walter, Chesnaux, Dugas and Noel2023).
Field observations
Field observations and sampling were performed in the abandoned Draganci sandpit (46°00′09″N, 17°10′14″E). Dune sands and paleosoils were investigated in four sections, denoted profile K, L, M, and N (see Results section). Based on field observations, several soil horizons and sedimentary units were distinguished and sampled. At least 0.5 m of the outcrop surface was removed to reduce the influence of recent weathering and vegetation. Fluvial sands were sampled from a shallow hand drilling into the quarry floor. Color (Munsell Color, 2010) and the presence or absence of stratification and bioturbation were described.
Grain-size analysis
Samples (n = 21) were air-dried at a temperature below 40°C for approximately one month. Particle-size analyses were performed at the Croatian Geological Survey (CGS) by sieving (1.25-, 0.9-, 0.45-, 0.25-, 0.125- and 0.09-mm size fractions) and using the pipette method, and preceded by the removal of soil organic matter with H2O2, carbonates with 4% HCl, and dispersion with Na2SiO3 (ISO 11277, 2011) as described in Galović et al. (Reference Galović, Frechen, Halamić, Durn and Romić2009, Reference Galović, Frechen, Peh, Durn and Halamić2011). Based on constructed cumulative granulometric curves and Wentworth classification of sediments according to size particles (Wentworth, Reference Wentworth1922), the percentages of individual fractions were determined and the basic granulometric parameters were calculated: coefficient of sorting (So), median (Md), and skewness (Sk) (Galović, Reference Galović2014). The ratio So/Sk was used to distinguish paleosoils and their degree of pedological development, and compare them to paleosoils of the same age in different locations (Galović, Reference Galović2014).
Carbonate content
The percentage of calcium carbonate (% CaCO3) in the sample was determined from a special weighing on the SCM1 Calcimeter instrument. Calibration was done with calcium carbonate (CaCO3). The sample was weighed into an Erlenmeyer flask, distilled water was added, and hydrochloric acid (4 mol/L HCl p.a.) was added separately to the test tube. After reaction of hydrochloric acid with the sample, carbon(IV)-oxide (CO2) is formed, a gas that displaces water from the burette. Based on the reading of the displaced volume of water, the percentage of calcium carbonate (% CaCO3) in the sample was calculated.
Organic matter
The proportion of organic matter was determined gravimetrically. The samples were weighed into dry porcelain pots and dried overnight in an oven at 110°C. After cooling and weighing, the samples were covered with hydrogen peroxide solution (30%). The dried samples were annealed in a muffle furnace for 6 hours at 450°C. The proportion of organic matter in the sample was calculated from the obtained weights.
Modal analyses
To determine the qualitative and semi-quantitative mineral composition of heavy- and light-mineral associations, 21 samples were extracted after disaggregation in the ultrasonic bath and sieved to the 0.09–0.16 mm size fraction, followed by the subsequent dissolution of calcite. This fraction was selected for the analysis because it includes all mineral species in proportions representative of the bulk sample. The heavy-mineral fraction (HMF) was separated using sodium polytungstate (SPT) (ρ = 2.8 g/cm3). Slides of heavy- and light-mineral fraction (LMF) were examined in polarized light. Canada balsam was used as the mounting medium. The qualitative and semi-quantitative composition of a sample was established after the determination of 300–400 grains and the percentage of each mineral was calculated.
Besides mineral identification, microscopic examination distinguished weathered from fresh grains of quartz and feldspar. Fresh quartz grains are transparent, with any inclusions clearly defined and featuring sharp grain edges. In contrast, weathered quartz grains are abraded, which decreases their transparency. The rough surfaces of weathered grains are suitable for coating them with opaque Fe/Mn or fine-grained foliated minerals. In the case of feldspar grains, chemical weathering is more prominent than abrasion. Like quartz, fresh feldspar grains are transparent, with clearly defined inclusions and sharp grain edges. However, weathered feldspar grains undergo kaolinization and sometimes even sericitization, resulting in a loss of transparency (Rubinić et al., Reference Rubinić, Galović, Husnjak and Durn2015, Reference Rubinić, Galović, Lazarević, Husnjak and Durn2018; Faivre et al., Reference Faivre, Galović, Sümegi, Cvitanović, Náfrádi and Horvatinčić2019; Galović et al., Reference Galović, Husnjak, Šorša and Martinčević Lazar2023b).
Since the specific gravity of muscovite is between 2.76 and 3.00 g/cm3, it is predominantly a component of HMF, but some crystals remain in LMF. Therefore, the number of muscovite crystals counted as a component of LMF was multiplied by the percentages of LMF and added to the percentages of muscovite in HMF.
Optically stimulated luminescence dating
Samples (n = 10) were taken to determine the equivalent dose (De) by hammering light-tight cylinders into the profile. Sample preparation and OSL measurements were performed in darkroom conditions in the luminescence facility of the Radiation Dosimetry and Calibration group of SCK CEN. Sample preparation was conducted following the procedures given by Beerten et al. (Reference Beerten, Lomax, Clémer, Stesmans and Radtke2006). The quartz fraction between 100 and 200 µm was used for dating purposes. OSL measurements were done with the Riso OSL/TL-DA-20 reader, using blue LED stimulation and a Hoya U-340 UV filter to prevent stimulation light from reaching the photomultiplier tube. Forty-eight were prepared for each sample using a 4-mm mask and silicone oil spray to attach the grains to stainless steel discs. Artificial doses were delivered using the built-in 90Sr-beta source operating at a dose rate of ∼0.12 Gy/s. Routine OSL measurements were done by stimulating the sample for 40 seconds at 125°C. Test dose monitoring was done using a cut-heat of 200°C (5°C/s) and an optical clean-out (OSL for 40 seconds at 280°C) after measuring the test dose.
Three dose points were used for De determination, with recycling and zero dose points. Dose recovery and preheat plateau tests were executed to check the performance of the applied single aliquot regeneration (SAR) dose protocol following recommendations by Murray and Wintle (Reference Murray and Wintle2003). In the dose recovery test, natural aliquots were bleached, and a known dose was given close to the expected dose, which was measured with the SAR protocol. Four aliquots were used for each preheat temperature (10 s) in the range 180–260°C. These tests allowed us to select an appropriate preheat temperature of 240°C (10 s) and a cutheat temperature of 200°C. The subsequent dose recovery test revealed a recovery ratio of 1.01 ± 0.11. For De calculation, aliquots were accepted if recuperation and recycling values were less than 10%. Outliers were removed from the equivalent dose data sets iteratively, retaining only those aliquots that are within ± 2 standard deviations from the arithmetic mean. The average of that cleaned population was used as the best estimate for the burial dose and age.
Samples for dose rate determination (D) were taken after removal of the OSL sampling cylinders from the profile by collecting sufficient sediment from the surrounding matrix (20–30 cm diameter from the sampling point). The samples were weighed, dried at 105°C until constant weight, and reweighed to determine the moisture content. The dried sediment mass was then put in tightly closed plastic bottles (200 mL) and stored for three weeks. Samples were then measured using high-resolution gamma-spectrometry. Activity concentrations were recalculated to radionuclide concentrations of the relevant parent isotope (238U, 235U, 232Th, and 40K), from which dose rates were calculated using the conversion factors from Adamiec and Aitken (Reference Adamiec and Aitken1998). Dose rates were corrected for water content and beta-dose attenuation (correction factor of 0.9). Cosmic dose rates were calculated from Prescott and Hutton (Reference Prescott and Hutton1994) and internal alpha-radioactivity was accounted for (Vandenberghe et al., Reference Vandenberghe, De Corte, Buylaert, Kučera and Van den haute2008).
Radiocarbon dating
Charcoal fragments (n = 7) were extracted from sands and paleosoils and submitted for radiocarbon dating. They were pre-treated according to a standard acid-base-acid protocol, combusted to oxidize organic matter to CO2, reduced back to graphite, pressed into the cathode, and measured by accelerated mass spectrometry (AMS) in Direct AMS (a division of Accium BioSciences, Seattle, Washington, USA). A beam of C ions is produced by bombarding the surface of a graphite sample with Cs+ ions. As such, the C beam is accelerated, focused, and split into 14-, 13-, and 12-amu beams. The results of radiocarbon dating have been corrected for isotopic fractionation (Taylor, Reference Taylor1987). Radiocarbon age was calibrated with OxCal4.4 online software, using Bayesian analysis (Bronk Ramsey, Reference Bronk Ramsey2009) and according to the IntCal20 calibration curve for the Northern Hemisphere (Reimer et al., Reference Reimer, Austin, Bard, Bayliss, Blackwell, Bronk Ramsey and Butzin2020).
Results
Digital elevation model (DEM)
The resulting DEM of the dune field is shown in Figure 3a. The maximum height of the field is ∼16 m (summit at 129 m asl), which is close to the sampling spot (red circle). The area where the geoelectrical soundings were performed is shown in Figure 3b (labeled s-1 to s-5). The relative heights of the corresponding dune fragments are: 9 m for s-1 (summit at 120 m altitude), 11 m for s-2 (summit at 123 m), 8 m for s-3 (summit at 121 m), 13 m for s-4 (summit at 126 m) and 16 m for s-5 (summit at 129 m). A hillshade version of the DEM, shown in Figure 3c, is overlain by the geological map from Figure 2. The DEM analysis excludes the distal eastern part of the dune field, since it does not seem to belong to the population of dunes in which the sandpit is located (Fig. 3d). The dune field (symbol ‘p’ in Fig. 3c) is located ∼6–10 km from the current Drava River channel (Fig. 2), but it borders Drava terraces (denoted a2 and a2p) in the north, and local clay–sandy silt deposits (denoted ‘lp’) in the south. The lateral contact of the dune field (‘p’) with the terrace deposits (a2) seems to have a gradual and transgressive nature (sand ‘p’ blown over the fluvial terrace deposits), while the contact of the dune field with the local silts (‘lp’) clearly shows an abrupt transition in morphology, accentuated by fluvial erosional features (see thick blue lines in Figure 3a that mimic wide meanders) that clearly post-date the formation of the dune field. This erosion phase, probably caused by a local fluvial system that was blocked by the migrating dune field, and thus forced to flow to the east instead of towards the north to northeast, was responsible for the subsequent remodeling of the southern part of the dune field, such that only fragments remain visible there. Even though the eastern distal part of the dune field is not included in the analysis, it can be shown that the contact between that part of the dune field and terrace deposits a2p is also erosional, suggesting that those terrace deposits post-date the formation of the eastern distal part of the dune field.
Results of the DEM analysis. (a) Morphology of the dune field. The red dot marks the position of the studied cross-section in the abandoned quarry. Altitudes are given in m asl. (b) Location of geoelectrical profiles s-1 to s-5. (c) Hillshade DEM of the dune field, overlain with the geological map from Figure 2. (d) Identification of individual dunes and dune fragments. Dotted lines indicate fragments of large parabolic dunes, thick black lines indicate smaller parabolic dunes, thin black lines indicate the smallest parabolic dunes, closed polygons indicate dome-shaped dunes. Points indicate the locations used for determining dune heights. Altitudes are given in m asl. The red dot marks the position of the studied cross-section in the abandoned quarry.

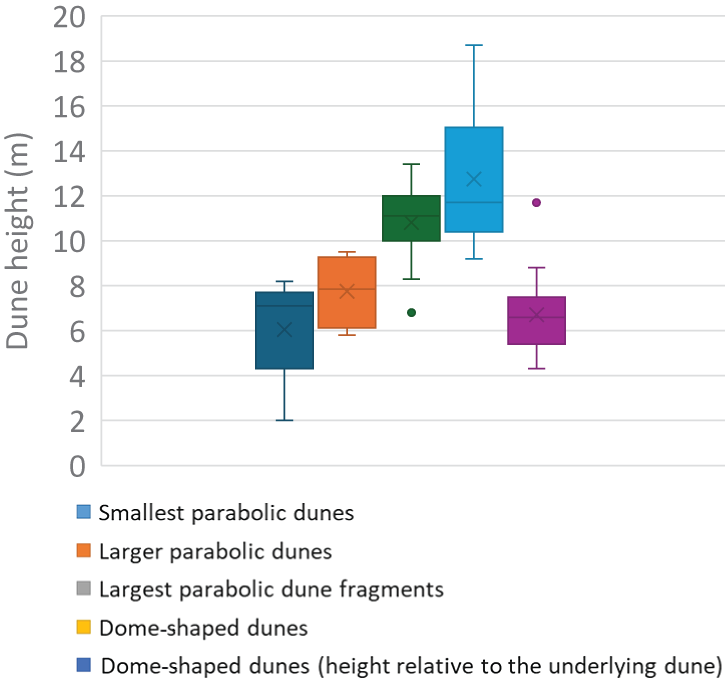
Based on the combination of the DEMs shown in Figure 3a, c, d, individual dunes and dune fragments were identified (Fig. 3d). It has to be noted that the original dune morphology seems to be disturbed in some places, probably due to subsequent human activity in the region, such that the identification is subject to a high degree of uncertainty and remains hypothetical in some cases. Nevertheless, it can be seen that most dunes and dune fragments seem to belong to the parabolic dune type (du Pont et al., Reference du Pont, Rubin, Narteau, Lapôtre, Day, Claudin and Livingstone2024), except for several dome-shaped dunes. The largest parabolic dune fragments, for which the average dune height ranges between 8–14 m (Fig. 4), are found near the southern edge of the dune field. As indicated above, in this case, due to posterior fluvial erosion, only fragments of this dune type were preserved. A slightly smaller parabolic dune type shows dune heights of 6–10 m. The investigated outcrop is most likely linked to this dune type. Next, the smallest parabolic dunes are 2–8 m high, and they are typically found near the northern edge of the dune field. Another, and different, type of dune or dune fragment is dome shaped. They are up to 18 m high, but relative to the topography of the underlying parabolic dunes, on which they are superimposed, their height measures 4–9 m. In summary, the morphology and genesis of the dune field can be described as a transgressive dune field, with vaguely preserved morphology of the older parabolic dunes, that are transgressively overprinted by smaller (both in height and length) parabolic dunes, and dome-shaped dunes.
Statistics of dune heights for the different dune types. Boxes indicate the 0.25–0.75 interquartile range, horizontal line is the median, cross indicates the mean, whiskers indicate the minimum and maximum, and points refer to outliers.

Geoelectrical soundings
All profiles show the same overall characteristic of a high-resistivity top layer over a low-resistivity bottom layer (Fig. 5a–e). The range of measured resistivities is quite large. In the shallow subsurface, down to depths of 5–15 m, values of more than 500 Ω.m and even up to 2500 Ω.m are registered. Conversely, values as low as 100 Ω.m and even lower are observed towards the bottom of the profiles. When evaluating these profiles with geological knowledge of the region, we can conclude that the high resistivity layer, usually coinciding with values of more than 500 Ω.m, corresponds to 5–15 m thick unsaturated fine- to medium-grained aeolian sand with low silt and clay content. The low-resistivity layer, with values lower than 200 Ω.m, corresponds to saturated (sandy) gravels and silts of the Drava alluvial plain that underlie the aeolian sands (Fig. 5f–j). The interpreted profiles clearly indicate palaeo-relief on the surface of the fluvial deposits. The resistivity values of the uppermost high-resistivity layer in profiles s-4 and s-5 systematically exceed values of 2000 Ω.m. This trend cannot be observed in profiles s-1 and s-3, and only to a small extent in profile s-2. This suggests that there is a correlation between the geoelectrical signature of the dune fragments and their relative height (see Section Digital elevation model (DEM)).
Results of the geoelectrical measurements. (a–e) Cross-sections of electrical resistivity for profile s-1 (a), profile s-3 (b), profile s-2 (c), profile s-5 (d), and profile s-4 (e). (f–j) Interpretation of geoelectrical measurements for profile s-1 (f), profile s-3 (g), profile s-2 (h), profile s-5 (i), and profile s-4 (j). Ohmm = Ω.m.

Field observations
The location of the investigated cross-section with reference to the dune morphology is shown in Figure 3a–d (red circle), which is located in a presumed eastern wing of a smaller parabolic dune, overlain by a dome-shaped dune. A schematic overview of the studied cross-section is shown in Figure 6, with the positions of the 4 different profiles that were sampled. The individual profiles (except for the very small profile N in the fluvial sands) are shown in Figure 7, as observed after cleaning the surface and preparing steps. Six different units were identified: 3 aeolian units (A1, A2 and A3), two paleosoils (S1 and S2), and one modern soil (S3), which was not considered for analysis.
Schematic drawing of the investigated cross-section in the sandpit, with indication of the different profiles (K, L, M, N), and observed units (A1, A2, A3, S1, S2, S3).

Locations and overviews of the investigated profiles. (a) General view of the investigated cross-section in the sandpit with indication of the different profiles. (b, c) Overview of profile K. (d) Overview of profile L. (e) Overview of profile M. Refer to the red dot in Figure 3 for the exact location of the cross-section in the sandpit and the wider area.

Sedimentary logs based on observations in the field and analytical results are shown in Figure 8. Unit A1 (Fig. 9a), the lowermost aeolian unit, is up to 7 m thick and consists of yellowish-brown to brown (2.5Y 10YR4/4-4/2) medium-grained sand, with clear oblique parallel lamination dipping 26°N, and the presence of carbonate (dispersed and in concentrations). Paleosoil S1 (Fig. 9b, e, f) is up to 1 m thick and consists of slightly silty fine-grained sand, has a darker color than the under- and overlying dune sands (7.5 10YR4/3-3/2), and lacks any stratification. Carbonate is present in the form of concentrated accumulations, and in a dispersed form. The lower boundary of this paleosoil is often vague (Fig. 9e), while the upper boundary is usually very sharp (Fig. 9b–f). Bioturbation features are numerous and can be quite large (up to 10 cm, see Fig. 9b). In profile L, the paleosoil has the appearance of a double paleosoil (Fig. 9e), with a 30-cm-thick sand layer separating the upper and lower part (Galović et al., Reference Galović, Beerten, Hećej and Posilović2023a).
Sedimentary logs with sampling locations, the corresponding sampling codes, dating results, and positions of the photographs shown in Figure 9. (a) Profile K. (b) Profile L. (c) Profile M.

Photographs of various units as observed in the abandoned sandpit. Black vertical bars represent 20 cm in the field. (a) Aeolian sand unit A1 with inclined parallel lamination as shown by the arrows (profile K). (b) Paleosoil unit S1 is characterized by a darker color, slightly finer grain size, concentrated carbonate enrichment (lower arrow), and bioturbation (upper arrow). The sharp upper boundary of the paleosoil is shown by the dashed line (profile K). (c) Aeolian sand unit A2 is also characterized by laminations (arrows); bioturbation is absent (profile K). (d) Paleosoil unit S2 is characterized by an orange color and bioturbation (arrow); the lower boundary is shown by the dashed white line (profile K). (e) Photograph of paleosoil S1, from profile L, showing bioturbation (arrow); the sharp upper boundary is shown by the dashed line, the lower boundary is rather vague; the double-ended arrow indicates an interval with aeolian sand, within the paleosoil at this location (see Galović et al., Reference Galović, Beerten, Hećej and Posilović2023a). (f) Aeolian sand unit A3 from profile M shows inclined parallel lamination (arrows) while bioturbation is absent; the boundary between paleosoil S1 and unit A3 is sharp and well defined.

Aeolian unit A2 (thickness up to 2 m) was deposited on top of S1, and consists of oblique parallel laminated medium-grained sand, while neither bioturbation nor any calcium carbonate enrichment can be observed (Fig. 9c). This unit is only present in profile K. Unit A2 is overlain by paleosoil S2, which is ∼50 cm thick, with a marked yellowish-brown color (7.5 10YR4/4) and consists of slightly silty medium-grained sand. There is no stratification and carbonate is nearly absent. Bioturbation can clearly be observed (Fig. 9d). The lower boundary of this soil is rather abrupt, as is its upper boundary. Aeolian unit A3 (up to 3 m thick) is again characterized by oblique parallel laminated medium-grained sand, with dispersed calcium carbonate but no bioturbation (Fig. 9f). In profile M, the sharp lower boundary with paleosoil S1 can be clearly seen (Fig. 9f). Finally, the recent soil (S3) is several dm thick and characterized by bioturbation, without any distinct coloration. It was not possible to verify the presence of paleosoil S2 in profile M (due to sudden access restrictions to the site), thus the lateral continuity of this soil can only be assumed, but most likely it was partially eroded prior to deposition of unit A3.
Grain size, organic matter content, and CaCO3 content
Results from grain-size analyses, and organic matter and CaCO3 content are shown in Figure 10. In profile K, aeolian units are mostly composed of medium-grained sand, without silt, while paleosoils always contain a small fraction of silt-sized particles (see Galović et al., Reference Galović, Beerten, Hećej and Posilović2023a). Overall, the texture of paleosoil S1 is fine-grained sand, and it even contains a significant proportion of very fine-grained sand (Fig. 10a). The sorting parameter (So) in itself is not diagnostic, but the skewness (Sk) is diagnostic (Fig. 10b). Skewness (Sk) is systematically lower in paleosoils S1 and S2, compared to aeolian units A1, A2 and A3. The image becomes very clear when combined in the So/Sk ratio. The paleosoils show slightly elevated So/Sk ratios, a diagnostic criterion already put forward in Galović et al. (Reference Galović, Beerten, Hećej and Posilović2023a).
Laboratory results for profiles K, M, and N. (a, d, g) Grain-size distribution for profile K (a), profile M (d), and profile N (g). (b, e, h) Median (Md), sorting (So), skewness (Sk) and So/Sk ratio for profile K (b), profile M (e), and profile N (h). (c, f, i) Organic matter and CaCO3 content for profile K (c), profile M (f), and profile N (i). Results for profile K were published in Galović et al. (Reference Galović, Beerten, Hećej and Posilović2023a). F = fluvial.

Next, the organic matter and CaCO3 contents are shown in Figure 10c. Here, the data clearly show elevated CaCO3 levels in unit A1 and the lower part of paleosoil S1 (from a few % up to 10%), intermediate levels in units A3 and S3 (around 1%), and finally very low levels in the top of paleosoil S1, unit A2, and paleosoil S2 (down to 0.2%). The organic matter content seems to be slightly elevated in the lower part of paleosoil S1. Otherwise, there was no clear trend observed for this parameter (Galović et al., Reference Galović, Beerten, Hećej and Posilović2023a).
Results from profile M in the sandpit are shown in Figure 10d–f. In general, the results are comparable with those from profile K, except for the fact that the sand overall seems to be a bit finer grained, especially in units A1 and S1. There is another maximum for the So/Sk ratio in paleosoil S1. Inorganic carbon shows very low values in S1, maximum values in A1, and higher values in the overlying unit A3. Note that units A2 and S2 are missing here. This will be further explained and discussed below. Organic carbon content is not diagnostic for the paleosoil S1.
Finally, in Figure 10g–i, laboratory results from the fluvial samples that were taken below the quarry floor are shown (profile N). Note that the total depth of the profile is only 0.6 m. The lithology ranges from sandy gravel to medium-grained sand, and thus confirms the fluvial origin of the material (Hećimović, Reference Hećimović1987, Reference Hećimović1988). The extremely large So/Sk ratio might be related to the presence of a paleosoil, but further investigation is needed. Inorganic carbon content is relatively high, with values of 2–7%.
Modal composition
The amount of HMF is significant (18–37% gravimetric weight) in the aeolian and paleosoil samples, while it is significantly higher in the fluvial samples (22–57%) (Table 1; Fig. 11). Opaque grains are the most abundant non-transparent minerals (4–11%) and are mainly represented by limonite. Biotite is present in all samples with percentages below 8% (Fig. 12a) but contributes less than 2% in the fluvial samples. Chlorite (2–6%) is well-rounded (Fig. 12b) and often represents chloritized biotite (Fig. 12c).
Results of the modal analysis. (a) Percentages of HMF and LMF. (b) Percentages of quartz (Qz), feldspar (Fsp), and lithic fragments (L) within the LMF. (c) Percentages of muscovite (Ms), epidote–zoisite (Ep–Zo), amphibole (Amp), pyroxene (Px), garnet (Grt), and rest (Rest) in the transparent HMF fraction. See Table 1 for the composition of the rest fraction.

Micro-photographs of minerals from LMF and HMF of samples of the investigated profiles in polarized light with parallel (N-) or crossed (N+) nicols. (a) Well-rounded fresh biotite – K-a. (b) Well-rounded fresh chlorite – K-b. (c) Chloritized biotite – K-b. (d) Garnet partly plastered with biotite flakes – K-g. (e) Muscovite with ragged rims and containing an elongated mineral with parallel extinction – K-i. (f) Well-rounded muscovite – M-a. (g) Fresh quartz with zircon inclusions – K-i. (h) Weathered quartz with regeneration rim – M-e. (i) Fresh K-feldspar rich in elongated inclusions – M-a. (j) Kaolinized and sericitized K-feldspar – K-i.

Modal analysis results. LMF = light mineral fraction, HMF = heavy mineral fraction, THM = transparent heavy minerals, Qz = quartz, Fsp = feldspar, L = transparent lithic particles, Op = opaque minerals, Chl = chlorite, Bt = biotite, Ms = muscovite, Ep–Zo = epidote–zoisite, Amp = amphibole, Px = pyroxene, Grt = garnet, Ky = kyanite, St = staurolite, Tur = tourmaline, Zrn = zircon, Rt = rutile, Ttn = titanite, Chr = chromite, Ap = apatite, + = minerals with occurrence < 0.5% (symbology according to Warr, Reference Warr2021).

Among the HMF, transparent heavy minerals (THM) are most abundant. Their abundance is nearly equivalent in aeolian and fluvial samples and ranges between 78% and 91%. The dominant transparent heavy minerals are resistant garnet grains (Fig. 12d). They are slightly enriched in the fluvial samples (63–74% of THM), compared to aeolian samples (45–69%). Grains are mostly slightly pink, indicating pyrope. Aeolian garnet grains are sometimes covered by biotite plates (Fig. 12d). The most abundant minerals in the analyzed HMF are muscovite, amphiboles, pyroxenes, and minerals from the epidote–zoisite group.
Muscovite is present in all samples and its content varies from 5 to 22%. It can be clear or with black marks. In the fluvial samples, the amount of muscovite is less and ranges between 5% and 12%, represented mostly by flakes and rarely by sericite grains. The muscovite flakes in aeolian samples Mb–d and Kc–i dominantly have ragged rims, while the flakes from fluvial sediment and samples M-a, K-a, and K-b are well-rounded (Fig. 12e, f). Almost as a rule, muscovite is enriched in samples that are enriched in other sheet minerals (biotite and chlorite).
In contrast to the more resistant garnet minerals, amphiboles are more present in aeolian samples (11–18%) than in fluvial samples (9–12%). Accessory minerals are kyanite, staurolite, tourmaline, zircon, rutile, titanite, and chromite. Their total share in THM is between 4% and 10%, and their specific share is less than 3% (Fig. 11).
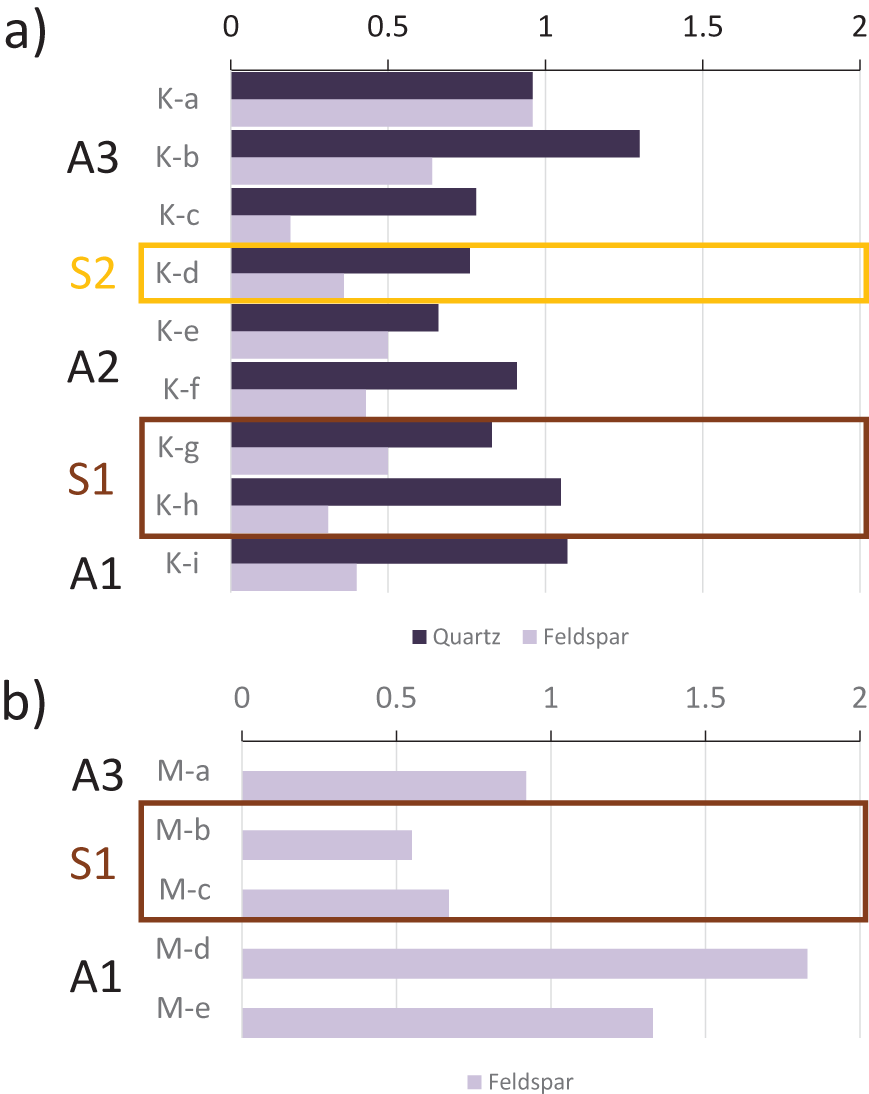
The LMF is slightly more dominant in the aeolian and paleosoil samples than the fluvial samples (Fig. 11). The dominant component in the LMF is quartz (58–75%), followed by feldspars (8–16%) and lithic fragments (11–25%). Comparing the proportions of weathered and fresh quartz grains, it seems that weathered quartz grains are dominant in unit A1, the upper part of unit A3, and unit S3. The proportion is smaller in paleosoils S1 and S2, and in unit A2 (Table 2; Fig. 13). Rare grains with regeneration rims indicate more cycles of quartz crystallization (Fig. 11h). Feldspars are almost exclusively represented by K-feldspars, which are mostly orthoclase and rarely microcline. Fresh feldspar grains are equally represented in the uppermost horizons of dune profiles (i.e., Ka-b and Ma) (unit A3; Fig. 12i) and dominate in unit A1 of profile M, while weathered feldspars dominate in the paleosoil horizons of S1 and S2 (Table 2; Fig. 13). The fresh grains are rich in elongated inclusions (Fig. 12i). In the rare cases where this was possible, the inclusions were determined to be idiomorphic tourmaline, hornblende and/or zircon. Weathered feldspars are kaolinized, sometimes even sericitized, and do not contain inclusions (Fig. 12j). Plagioclase is represented by up to 2% (in the dune profiles samples) and 4% (in the fluvial core samples) of Na-rich, equally weathered and fresh grains with a characteristic polysynthetic twinning. Lithic fragments are represented mainly by metamorphic rocks (quartzite, muscovite, and chlorite schists and gneiss) and sporadically by chert. The most important morphological feature of typically (hyp-)idiomorphic crystals, such as tourmaline and zircon, is their roundness.
Ratios of fresh versus weathered quartz and feldspar grains in LMF. (a) Profile K. (b) Profile M. Note that quartz was not analyzed in this profile.

Results of LMF counting for fresh and weathered quartz and feldspars; n/a = not analyzed.

Optically stimulated luminescence and radiocarbon dating
The OSL results are summarized in Table 3. The bulk equivalent dose distributions showed relative standard deviations between 11% and 61%. After applying the iterative procedure to remove outliers (see Methods section), the relative standard deviations were reduced to between 9% and 34%, with one outlier of 41%. Taking into account the fact that the relative standard deviation in the dose recovery test is already 11%, we regard these values as a good measure of the spread that would be expected in natural environments where bioturbation is proven to have been an important process and beta dose rate heterogeneity is likely to be present, given the elevated heavy mineral content. The resulting equivalent doses range between ∼12 and 29 Gy. Dose rates are relatively high, especially for quartz-rich aeolian sand, and range between ∼1.4 and 1.9 Gy/ka.
OSL dating results. Zero age = AD 2022.

* Relative standard deviation
** Uncertainties quoted at 1σ
The radiocarbon dating results are presented in Table 4 in units of percent modern carbon (pMC) and the uncalibrated radiocarbon age before the present (BP; 0 BP = 1950 CE). All results have been corrected for isotopic fractionation with an unreported δ13C value. In summary, the ages range from approximately 15.1 ka to 11.8 ka, except for one: the uppermost sample in profile K has a modern age.
Radiocarbon dating results.

* Uncertainties quoted at 1σ
** Uncertainties quoted at 2σ
*** Data from Galović et al., Reference Galović, Beerten, Hećej and Posilović2023a
Unit A1 shows consistent OSL and radiocarbon ages between ca. 18 ka and 14.5 ka. The apparent OSL age reversal for this unit in profile M is insignificant with respect to the reported standard errors (Fig. 8; Table 3). Next, the radiocarbon ages for charcoal in the overlying paleosoil S1 suggest that it was formed between 13.6 cal ka BP and 14.7 cal ka BP. The OSL ages of bleached sand in the soil do not contradict this age (15.6 ± 1.4 ka and 13.2 ± 0.8 ka). The analytical dating results of unit A2 show some inconsistency, in the sense that the OSL age of sample K-3 is much older than the radiocarbon ages of the underlying paleosoil S1 (and older than 1 out of 2 OSL dates for that soil). We thus argue that the OSL age of sample K-3 does not represent the true burial age of unit A2. Instead, the radiocarbon age of 11.8 ± 0.2 cal ka BP and the mean OSL age (samples K-4 and K-5) of 10.8 ± 0.9 ka seem to be a better estimates for the depositional age. Finally, unit A3 shows OSL ages ranging between 7.9 ± 0.5 ka and 3.0 ± 0.4 ka, which is stratigraphically consistent with the results from underlying units. However, given the very large relative standard deviation of the OSL dose distribution for K-6 (41%), it can be argued that the OSL age might be inaccurate and not represent the true burial age. Indeed, charcoal from sample K-10, taken just a couple of cm above OSL sample K-6, has a modern radiocarbon age, suggesting that the upper part of unit A3 might actually be very young (i.e., less than 100 years old).
Discussion
Phases of aeolian activity, landscape stability, and weathering in the Podravina area
The investigated dune field can be described as a combination of individual large (poorly preserved), smaller, and very small parabolic dunes or dune fragments, and small dome-shaped dunes. Orientation of the parabolic dunes suggests a dominant wind direction from the north during their formation. Exposed material from northward-situated fluvial terraces of the Drava River were the main source. Individual dunes are arranged in such a way that the larger parabolic dunes are situated downwind, while the overall size of upwind parabolic dunes gradually decreases. Such dune stacking has been described as an indication of the slowing migration rates in the distal zone of the dune field (Hesp et al., Reference Hesp, Martinez, da Silva, Rodríguez-Revelo, Gutierrez, Humanes and Laínez2011). Dome-shaped dune fragments are mostly situated on top of smaller or larger parabolic dune (fragments).
The geoelectrical soundings show a similar pattern for dune fragments s-1 and s-3, which in turn are different from those of dune fragments s-4 and s-5. Geoelectrical profile s-4 covers the area where the outcrop is located. From the geoelectrical data we could thus assume that the pedostratigraphy of geoelectric profiles and dune fragments s-4 and s-5 is similar. The lower resistivities for geoelectrical profiles s-1 and s-3 (less than ∼1250 Ω.m) could imply that they are characterized by a different pedostratigraphy (e.g., more silt and/or clay), and may thus represent a different phase of sand movement and dune building than s-4 and s-5. This hypothesis needs further verification. Water content could also play a major role in the geoelectrical signature of the various dune fragments. On the one hand, finer-grained material has a stronger water-retention capacity, but on the other hand, lower dunes are, as a whole, closer to the water table and have a thinner unsaturated zone.
The pedo-sedimentary record observed within this dune field in the Podravina clearly shows the presence of several phases of morphodynamic changes, as well as episodes of landscape stability and weathering as evinced by the preservation of paleosoils. The earliest phase of sand movement and dune building at the sampled location is represented by unit A1. It is characterized by up to 7–8 m of sand accumulation in a time span of several thousand years during the Pleniglacial, from ca. 18 ka (and even a bit earlier, since the very bottom of the dune could not be sampled) until ca. 15 ka. The material of this aeolian phase consists of fresh and unweathered, reworked fluvial material that was blown from the surface of the adjacent and exposed terrace of the Drava River. The availability of sufficient source material, groundwater table lowering due to incision of the Drava River, and possibly increased aridity and the declining vegetation cover could have played roles in the initiation of aeolian activity (Kasse, Reference Kasse1997; Łopuch et al., Reference Łopuch, Zieliński and Jary2023). As a result, parabolic dunes started to develop.
The next phase is a phase of landscape stability, as witnessed by the development of the paleosoil (or pedocomplex) S1, which is a weak soil. It is identified based on its slightly different color, slightly finer grain size, decalcified top, the larger amount of weathered feldspar grains, and the slightly increased So/Sk ratio (Figs. 10–13).
The So/Sk ratio was used before in the identification and assessment of the degree of pedological development of paleosoils in loess sequences of eastern Croatia (Galović, Reference Galović2014). All paleosoils intercalated in loess have So/Sk ratios larger than 2.2, which was assumed as the lower limit. By comparing the distribution of the So/Sk ratio of the paleosoils intercalated in that aeolian sediment and the results obtained in this research, the paleosoils intercalated in the Podravina dunes have a significantly lower So/Sk ratio (1.5–1.7). This can be interpreted as a weaker degree of pedogenetic development of the soil in the dune sands due to a less-reactive surface during the weathering of sand compared to that of silt.
All radiocarbon data are consistent with the BA (from 14.7 ka to 12.9 ka) age for S1, as well as the OSL data (within one standard error). It thus means that, even though it was a phase of landscape stability, there was at least some input of sand in this paleosoil. The top of S1 is decalcified, while the underlying unit A1 is not, which suggests that an episode of stronger leaching, probably related to increased precipitation, started during or by the end of the BA interstadial.
The following phase of sand movement, unit A2, consists of 2–4 meters of decalcified sand with abundant weathered feldspar and quartz grains. This phase post-dates the BA interstadial and can be assigned a latest Late Glacial (Younger Dryas, 12.9–11.7 ka) or earliest Holocene (Early Holocene, 11.7–8.2 ka; Preboreal–Boreal, 11.7–8.9 ka). It implies that the next paleosoil S2, which also is decalcified and shows increased values of weathered light minerals, is at least Holocene in age. The accuracy and precision of the dating results (especially the OSL ages) do not allow to be more specific about the age of S2, except that it most likely belongs to the Early Holocene.
The decalcified interval, which extends from the top of paleosoil S1, over unit A2, to paleosoil S2, represents an episode of increased carbonate dissolution, covering the latest part of the BA interstadial up to the Early Holocene. The same vertical interval shows increasing amounts of weathered quartz grains (from the top of S1 over A2 to the top of S2), and significant amounts of weathered feldspar, especially in paleosoil S2. It can be concluded that chemical weathering started to play a significant role in the Podravina landscape, from the BA onwards, which caused increased input of weathered material in the aeolian record (as seen from the carbonate content and the mineralogy) until fresh and less-weathered material was brought into the dune record again.
The last phase of aeolian activity, represented by unit A3 (and forming the parent material for the modern soil S3), shows a large scatter in dating results, from the Middle Holocene (8.2–4.2 ka) to modern ages. This unit again shows a larger carbonate content, and higher levels of fresh versus weathered feldspar and quartz, and points to the input of fresh material from the Drava River. Possibly, this was due to a rearrangement of the main river channel within the Drava floodplain and/or to changing inundation dynamics. Floodplain reconstructions of the Drava River, several tens of kilometers southeast of the study area, indicate that during the Holocene, the Drava River was forced into a more southern course due to tectonic activity (Słowik et al., Reference Słowik, Dezső, Salem, Puhl-Rezsek, Gałka and Kovács2023). In any case, this material was not exposed to the same weathering conditions as the underlying material S1–A2–S2, possibly because it was exposed for a too little time, or because the weathering conditions changed since then. This last Holocene phase most likely corresponds with the formation of the dome-shaped dune fragments and may indicate a period of reduced vegetation cover again.
Aeolian dynamics in the Podravina as seen from the mineralogy
Similar to previous research, the modal compositions of the dune sands in this work point to the Drava floodplain region as the main source of material for the dunes (Hećimović, Reference Hećimović1987). The upstream, Slovenian part of the Drava River drainage system is built predominantly of igneous and metamorphic rocks (Paleozoic) with rare occurrences of sedimentary rocks (mostly Mesozoic) (Mioč and Žnidarčič, Reference Mioč and Žnidarčič1977). Downstream, towards Croatia, the terrain is geologically different, composed almost solely of sedimentary rocks of Tertiary and Quaternary ages (Mioč and Marković Reference Mioč and Marković1998). Pebbles are composed of quartzite, high- and low-grade schists, chert, and gneiss, and the modal composition (Hećimović, Reference Hećimović1987; Peh et al., Reference Peh, Šajn, Halamić and Galović2008) corresponds to the modal composition of the fluvial samples analyzed here (Table 1; Fig. 11).
The preferential sorting of lighter minerals by wind can clearly be observed in the data, where the fluvial samples have, on average, a slightly higher HMF content than the dune samples (Fig. 11). As already shown in Galović et al. (Reference Galović, Beerten, Hećej and Posilović2023a), there is quite some lateral variation in the mineralogical composition of the S1 soil horizon, as well as in the underlying dune sand A1, which clearly changes towards the south, in the downwind direction (see dashed line in Fig. 6, internal sedimentological boundary in unit A1). This is supported by the increased proportion of fresh K-feldspars in A1 in profiles K and M, particularly in the southern profile M (Fig. 13). It can also be seen in the different mineralogical compositions of samples K-g to K-i compared to samples M-b to M-e. It may mean that the parent material is similar, but not entirely the same, or it may be due to internal sorting processes near the leeward slope of the dune.
Additionally, morphologic observations of muscovite flakes from both aeolian and fluvial sediments indicate that the fluvial flakes have nice, rounded edges and smoother surfaces (Fig. 12f) because water is denser than air and collisions with other grains have less impact. As such, muscovite grains that are finally transported by wind can be successfully distinguished from the ones transported by water only because they are overprinted by aeolian abrasion, showing less rounding, fewer rough edges, and fewer surface microfractures (Fig. 12e) (Galović, Reference Galović2014, Reference Galović2016; Galović et al., Reference Galović, Husnjak, Šorša and Martinčević Lazar2023b). Repeatedly reworked dune sand that covered long distances by saltation would therefore very rarely preserve the original fluvial signature. Since the shape of the mica flakes in the uppermost horizons (unit A3) of the dune sections, and the amount of muscovite, are analogous to those from the fluvial samples underlying the dunes, it can be concluded that the top part of the dunes is built up of fresh aeolian material transported from the Drava River valley during the Middle to Late Holocene phase, which is represented by unit A3. Furthermore, this material was not repeatedly transported by saltation, because, in that case, muscovite flakes would have more ragged edges. This leads to the conclusion that during deposition of unit A3, in the Middle and Late Holocene, there was no resedimentation of older dunes on a large scale as had occurred during the Pleistocene and Early Holocene, and that transport distances were rather short. This, again, is in line with a more southern course of the Drave River during the Holocene (Słowik et al., Reference Słowik, Dezső, Salem, Puhl-Rezsek, Gałka and Kovács2023).
Aeolian activity and paleosoil formation in the Pannonian Basin
The investigated dune field in the Podravina presumably formed under the same wind pattern (N–NNW) as the nearest dune field just north of it, in the Inner Somogy in Hungary (Györgyövics and Kiss, Reference Györgyövics and Kiss2013) (Fig. 1a). The orientation of the parabolic dunes is compatible with the orientation of the individual dunes in the Podravina described here. It is even in accordance with the anticipated wind direction that caused the formation of yardangs north of the Inner Somogy (Sebe et al., Reference Sebe, Csillag, Ruszkiczay-Rüdiger, Fodor, Thamó-Bozsó, Müller and Braucher2011) several 100 ka ago. It may suggest that if massive aeolian activity is taking place in this region, it has always operated under similar wind patterns. In another study, preliminary OSL ages reported for the Inner Somogy dunes show that periods of sand movement occurred during the Pleniglacial, the Late Glacial, Early Holocene, and Late Holocene (Györgyövics et al., Reference Györgyövics, Kiss and Sipos2014). The authors also described a paleosoil in the dune sands, which presumably correlates with the BA paleosoil (S1) investigated here. Recently, Holuša et al. (Reference Holuša, Moska, Nývlt and Woronko2024) made a comprehensive overview of the timing of aeolian activity, based on the frequency distribution of OSL dates in the Pannonian Basin and the ESB. Outside the ESB, aeolian activity peaked around 16 ka (latest Pleniglacial), followed by a minor peak around 12–13 ka (Younger Dryas) and the Early Holocene. Inside the ESB, the pattern seems to be reversed, with the major peak of aeolian activity having occurred during the late glacial (mostly Younger Dryas) and Early Holocene.
It is clear that aeolian activity in the Podravina fits into the scheme of the Pannonian Basin. Decreased aeolian activity during the BA is in line with radiocarbon ages obtained from paleosoils in Hungary, on the Danube-Tisza interfluve (Fig. 1a), that roughly range between 15.5 cal ka BP and 13 cal ka BP (Ujházy et al., Reference Ujházy, Gábris and Frechen2003). Similar observations are reported in the east of Hungary, in the Nyírség area (Fig. 1a) where a BA paleosoil is intercalated between Pleniglacial and Late Glacial aeolian sand (Buró et al., Reference Buró, Sipos, Lóki, Andrási, Félegyházi and Négyesi2016). Oval-shaped hummocks and asymmetric parabolic dunes indicate a prevailing wind direction from the north.
Periods of enhanced aeolian activity during the Late Weichselian in the Pannonian Basin are generally thought to be linked with climate change, resulting in an aridification of the steppe environment (Buró et al., Reference Buró, Sipos, Lóki, Andrási, Félegyházi and Négyesi2016; Magyari et al., Reference Magyari, Pál, Vincze, Veres, Jakab, Braun, Szalai, Szabó and Korponai2019; Obreht et al., Reference Obreht, Zeeden, Hambach, Veres, Marković and Lehmkuhl2019; Marković et al., Reference Marković, Perić, Gavrilov, Markovic, Vandenberghe, Schaetzl and Obreht2024), although a colder–warmer and wetter–drier gradient may have existed from north to south. Paleosoil formation during the BA was most likely caused by ecosystem turnover with the expansion of forest in a wetter climate. Indeed, indications of a wetter climate are visible in the Podravina dune section described here, in which decalcification probably started during the BA as a result of enhanced leaching and dissolution.
The development of dunes in the Pleniglacial, prior to 15 ka, is a common feature in the Pannonian Basin, as well as the development of a paleosoil during the BA and reduced aeolian activity (in comparison with the period before the BA) afterwards. This stands in contrast with sites in the ESB, where dune formation seems to have been more prominent in the Younger Dryas than during the Pleniglacial. Most likely this was due to the persistence of vegetation cover throughout the Late Glacial in many parts of the Pannonian Basin, in contrast to the ESB where climate deterioration was much more expressed during the Younger Dryas. Unlike in the ESB, permafrost degradation does not seem to have played an important role, since permafrost is thought to have been absent during the Pleniglacial, especially in the southern part of the Pannonian Basin (Lehmkuhl et al., Reference Lehmkuhl, Nett, Pötter, Schulte, Sprafke, Jary and Antoine2021). The climatic gradient over Europe during the Late Glacial may also be expressed by the usually very thin BA paleosoil in the western part of the ESB, compared to the thicker paleosoils in the southern Pannonian Basin (e.g., Kaiser et al., Reference Kaiser, Hilgers, Schlaak, Jankowski, Kuhn, Bussemer and Przegiȩtka2009).
Conclusion
At least part of the studied dune field, south of the Drava River, in the Podravina, northern Croatia, originated in the Pleniglacial (before 15 ka), probably as a combined result from changing fluvial dynamics in the floodplain and aridification. The resulting dune forms are parabolic. Undoubtedly, fluvial sand from the Drava River was the source material, and it appears that it underwent repeated phases of resedimentation from its source to sink, before final deposition. Subsequently, following climate transition from the Pleniglacial to the Late Glacial, a paleosoil developed. This paleosoil is dated to the BA and shows only weak signs of pedogenesis (slighter finer grain size, partially decalcified, and higher content of weathered minerals). The next phase of aeolian activity is dated to the Younger Dryas and/or the Early Holocene (Preboreal or Boreal) and is witnessed by the presence of decalcified sand with abundant weathered feldspar and quartz grains. The decalcified interval in the investigated profile ends towards the top with an orange-colored horizon, which is a weak paleosoil that is Holocene in age. However, its exact age is difficult to establish at present. Nevertheless, the decalcified interval can be interpreted as being the result of increased chemical weathering, most likely due to the climate amelioration that started in the BA. After development of the orange horizon (paleosoil), fresh sand, not decalcified, was blown in from the Drava River floodplain. This Mid- to Late Holocene phase of aeolian activity consists of sand that indicates short transport only, in contrast to the Pleistocene and Early Holocene sand and resulted in the formation of dome-shaped dunes. It is not clear yet whether this sand is less weathered because it was not exposed long enough, or whether the weathering conditions changed in the course of the Mid- to Late Holocene. Dune building in the Podravina fits into the overall scheme of the Pannonian Basin, with strong aeolian activity before, reduced aeolian activity after, and soil formation during the BA interstadial.
Acknowledgments
We are grateful to the State Geodetic Administration of Croatia (DGU) for providing data for high-resolution digital elevation model investigations. We would like to express our gratitude to Nina Hećej (Croatian Geological Survey, now at the University of Bergen, Norway) for assistance with fieldwork and OSL sampling. This work has been fully supported by Croatian Science Foundation under the project ACCENT (3274).
Competing interests
The authors declare no competing interests.