


1. A paradigm shift
It is one of the aims of any scientific discipline to construct models that will account for as many observations as possible within a coherent framework. These models, and the framework of which they are a part, constitute a scientific paradigm. A paradigm commonly includes a set of dogmas, or key assumptions concerning both the nature of certain phenomena and the methodologies employed to study them that are never doubted as long as the paradigm appears to work well. The history of science, as it turns out, is a history of overturned dogmas and supplanted paradigms (Kuhn 1970). The discovery of new phenomena – anomalies – that appear to violate a central dogma or dogmas – perhaps, according to the paradigm, they have been deemed incapable of existing – can constitute a serious challenge to a paradigm. Sometimes, these phenomena can successfully be accounted for by the current paradigm and incorporated into it. But when they cannot, a new paradigm will emerge from new models constructed to better explain the phenomena. This is the process that Thomas Kuhn (1970) famously called a “paradigm shift” or a scientific revolution.
The science of genetics is undergoing a paradigm shift (Dear Reference Dear2009; Gressler & Haslberger Reference Gressler and Haslberger2010; McClellan & King Reference McClellan and King2010; Ooi & Wood Reference Ooi and Wood2008; Petronis Reference Petronis2010; Sgaramella & Astolfi Reference Sgaramella and Astolfi2010; Whitelaw & Whitelaw Reference Whitelaw and Whitelaw2006). Consider the following developments:
-
1. It has been a long-standing dogma in molecular genetics that an individual's genome, his or her entire DNA sequence, is fixed at the moment of conception and, with the exception of the occasional point mutation or mutations associated with, for example, cancer, does not change throughout life. It has become increasingly clear that DNA is dynamic rather than static, being subject to a wide array of rearrangements, insertions, and deletions. During embryogenesis, the genome is altered by such phenomena as retrotransposons, or “jumping genes,” which are mobile DNA elements that “copy and paste” themselves at various positions in an individual's DNA sequence; de novo copy number variations – deletions, insertions, and duplications in segments of DNA; and aneuploidy, alterations in the number of copies of chromosomes per cell. Some of these phenomena, such as retrotransposition, likely continue throughout the course of life and may be environmentally responsive.
-
2. These same phenomena challenge another long-standing dogma – that persons have identical DNA in all the cells and tissues of their bodies (with the exception of germ cells, red blood cells, and certain cells in the immune system). It is appearing more and more likely that the normal human condition is one of somatic and chromosomal mosaicism, that is, different genomes in different cells and tissues of the same individual.
-
3. Since DNA's discovery in 1953, it has been a key dogma of molecular genetics that DNA is the sole biological agent of heritability, and it is still commonly treated as such. We now know, however, that it is not. The epigenome, that is, the complex biochemical system that regulates DNA expression, turning genes on and off and modulating their “transcribability,” has been found to be heritable, both somatically and intergenerationally via the germline, enabling the biological inheritance of traits with no changes to the DNA sequence. Furthermore, the epigenome is highly environmentally responsive. Environmentally induced changes in gene transcribability can have long-term – sometimes lifelong – phenotypic consequences.
-
4. The idea that environmentally induced phenotypic changes can be inherited transgenerationally violates a central dogma of neo-Darwinism, which insists that this is an impossibility. It bespeaks (to neo-Darwinists) a resurrection of the “Lamarckian heresy” – Lamarck, a predecessor of Darwin, having proposed just such a possibility. It is not uncommon nowadays to encounter in respected scientific journals defenses of “neo-Lamarckianism” – minus Lamarck's quasi-teleological ideas (Gissis & Jablonka Reference Gissis and Jablonka2011; Champagne Reference Champagne2008; Ho & Burggren Reference Ho and Burggren2010; Lemke et al. Reference Lemke, Coutinho and Lange2004).
What are the implications of these recent paradigm-shifting developments in genetics for behavior genetics? This article is an attempt to answer this question. As we shall see, the cumulative evidence of recent discoveries in genetics and epigenetics calls into question the validity of two classes of methodologies that are central to the discipline: twin, family, and adoption studies, which are used to derive heritability estimates, and gene association studies, which include both genome-wide and candidate-gene association studies. In fact, what the cumulative evidence calls into question is a paradigm of the relationship between genotype and phenotype. Let us call this the genetic paradigm. Some of the elements of this paradigm have already been mentioned, and others will be considered below.
Contrasting with the genetic paradigm is what I shall call the postgenomic view. I do not call it a paradigm because it has not yet coalesced around a core set of principles or assumptions characteristic of a paradigm. Despite its nascent state, it is nonetheless capable of being characterized largely on the basis of the developments in genetics and epigenetics that I examine in this article. In the most general terms, the biological worldview of postgenomics is characterized by extreme complexity, variability, multilevel reciprocal interactionism, and stochasticity as an inherent property of biological systems, which all contribute to what might be called the blurring of boundaries, in particular, the boundary between genes and environment.
While the developments to be considered have implications for all of genetics, they are particularly significant for behavior genetics for at least three reasons: First, phenomena that are transforming our conception of the genome – epigenetics, retrotransposons, copy number variations, chromosomal aneuploidy – seem to be particularly prevalent in the human brain and are likely relevant for a good deal of human behavior. Epigenetics, for example, represents a new frontier in the study of mammalian behavior. Second, heritability and gene association studies are the two methodologies in genetics that are most dependent upon the genetic paradigm. Because these methodologies in large measure define the discipline of behavior genetics, the impact of these developments upon this discipline is likely to be most profound. Third, these developments have important implications for one of the most influential generalizations in behavior genetics concerning human behavior to emerge from the use of heritability studies. This can be referred to as the principle of minimal shared maternal effects, according to which the early (primarily maternal) rearing environment, prenatal and postnatal, is not a cause of phenotypic concordance among offspring but, if anything, a cause of phenotypic discordance.
As it turns out, the phenomena we shall consider have a significant bearing upon the validity of this principle, and for reasons independent of the soundness of the methodology used to derive it. This is because these same phenomena appear to play a number of critical roles in embryogenesis, fetal development, and the early postnatal period. One of these roles is in enabling what is termed “adaptive phenotypic plasticity.” As we shall see, the principle of adaptive phenotypic plasticity is fundamentally at odds with the principle of minimal shared maternal effects, with implications not only for the sources of behavioral variation but for developmental and evolutionary biology as well.
Finally, although my focus is on behavior genetics throughout, the phenomena I shall consider have profound implications for all of genetics and for the ongoing search for the role of genes in any number of human diseases. Heritability and gene association studies have been employed, and continue to be employed, in the search for the causes of cancer, heart disease, and diabetes, among other phenotypes.
2. Genes, heritability, and gene association studies: A few basics
2.1. Genes and alleles
Genes are segments of DNA coded for the production of RNA molecules and proteins. Transcription is the process in which the DNA molecule is used (by a cell) as a template to produce messenger RNA (mRNA), which in turn serves as a template for protein synthesis (translation). Persons possess two copies of each gene in the cells of their bodies (except for sperm and egg cells, red blood cells, and genes located on the X and Y chromosomes in males), one copy of which comes from the mother and one from the father. Each of the copies of a gene is called an allele of the gene. Alleles of a gene from the two parents may be identical, or they may differ slightly, sometimes differing by only a single nucleotide substitution (nucleotides are the basic subunits that make up the DNA molecule). These minor structural differences between alleles can be found in many different configurations or versions. When two or more versions of an allele for a single gene occur in greater than 1% of a given population, it is referred to as a polymorphism. A version of an allele that occurs in less than 1% of the population is called a mutation. When both of the alleles for a given gene are identical, then one is homozygous for that gene; when the alleles differ, one is heterozygous.
Individual alleles are inherited in a Mendelian manner, which can be best illustrated by considering the inheritance of single-gene or monogenic disorders (e.g., cystic fibrosis, sickle cell anemia), a discrete class of disorders caused by mutations on one or both alleles of the same gene. If the disorder is dominant, then only one mutated allele is necessary to present the disease phenotype; if the disorder is recessive, then both alleles must have mutations. When a monogenic disorder is completely penetrant (i.e., those who present the mutated allele[s] always have the disease phenotype) and the gene mutation known, then based upon the genotype of the parents and whether or not the disorder is dominant or recessive, the odds that the child will inherit the disorder (the risk factor) can be calculated precisely according to the simple rules of Mendelian inheritance. Because the vast majority of human traits are not caused by variations on one or two alleles, they are not inherited in a Mendelian manner.
2.2. Heritability studies
Heritability is defined as the proportion of phenotypic variance attributable to genotypic variance in a given population at a given time. According to the prevailing methodological approach, the heritability of a given trait is ascertained by comparing phenotypic concordances and discordances between subjects relative to their presumed degree of genetic similarity. For example, monozygotic (MZ) twins, inasmuch as they are derived from the division of a single fertilized egg cell, are assumed to share 100% of their segregating genes (genes shared by descent) – that is, they are genetically identical. Dizygotic (DZ) twins, on the other hand, are derived from two separate fertilized egg cells and share on average 50% of their segregating genes, the same percentage as non-twin siblings. Assuming that the environments of MZ and DZ twins do not differ in any systematic ways that would affect the trait under consideration – the so-called trait-specific equal environment assumption (Guo Reference Guo2001) – greater phenotypic concordance between MZ twins as opposed to DZ twins is taken as evidence of a genetic component. The same principles underlie family and adoption studies: Siblings (or singletons) share on average 50% of their segregating genes; half siblings share 25%; and adopted siblings do not share any segregating genes with their (non-adopted) siblings.
One of the simplest and most widely used modeling techniques for estimating heritability partitions total phenotypic variation for a trait (V P) into a contribution attributable to genotypic variation (V G) and a contribution attributable to environmental variation (V E): V P = V G+V E. This model assumes additive genetic variance (A) – that is, independent genetic effects are fully transmitted from parent to offspring, and each allele adds a fixed amount to the genetic component of a given trait. As many researchers in behavior genetics acknowledge, the genetic contributors to variation in behavioral phenotypes likely do not act in this simple manner (Plomin Reference Plomin2004), and additional terms can be added for non-additive genetic effects including interactions among alleles at a single locus (dominance-recessiveness), interactions among alleles at a different locus (epistasis), and interactions between alleles and the environment (gene by environment [G × E] interaction).
2.3. Gene association studies
Gene association studies typically involve the search for statistically significant differences in the prevalence of a polymorphism between individuals who possess a trait of interest and those without the trait. In a candidate-gene association study, an association is proposed between a particular allelic variant and a given phenotype. Suppose that gene A comes in two common forms (polymorphisms), allele A1 and allele A2. A claim for an association in a candidate-gene association study generally takes the following form: Those with allele A1 are more likely to display behavior X than those with allele A2 (or vice versa); or, those homozygous for gene A (alleles A1A1 or A2A2) are more likely to display behavior X than those who are heterozygous (alleles A1A2),Footnote 1 or vice versa. Candidate-gene association studies are hypothesis driven, the hypothesis depending upon an assumption concerning the manner in which the protein for which the candidate gene is encoded affects behavior. The hypothesis is commonly tested in behavior genetics by the use of large data sets that contain both a certain amount of genetic data as well as behavioral data (usually in the form of subject responses to a questionnaire). Genome-wide association studies are non-hypothesis driven and involve sequencing all or most of the entire genome, typically of hundreds or thousands of individuals who possess a given phenotype. The researcher looks for any single nucleotide polymorphisms that those who exhibit the trait of interest possess in statistically significant numbers relative to those without the trait. Recently, the use of genome-wide studies has expanded to include a variety of other common (and uncommon) forms of DNA variation, including many of those we consider below.
3. Six basic assumptions
Heritability and gene association studies depend upon the following set of assumptions (among others) that I would like to highlight. These assumptions can be broken into two groups on the basis of their relevance for either heritability or association studies.
Heritability studies (HS):
-
1. HS1. 100% of the genes of MZ twins are genetically identical. On average, 50% of the genes of DZ twins are genetically identical. On average, 50% of the genes of non-twin siblings are genetically identical.
-
2. HS2. The percentages of genetic identity in H1 never change (i.e., they are unvarying). That is, MZ twins, from conception to death, are always 100% genetically identical; DZ twins are always ~50% genetically identical; and non-twin siblings are always ~50% genetically identical (heritability, however, can change over the life course).
-
3. HS3. All causes of phenotypic variation that impact human behavior can be attributed to a latent genetic (G) or environmental (E) parameter, or the interaction of the two (G × E).
HS1 sets out the relations of genetic identity upon which heritability estimates depend. HS2 ensures that these relations of genetic identity remain constant over the life course. HS3 ensures that the categories used to explain the causes of phenotypic variation are sufficient and complete.
Gene association studies (GAS):
-
1. GAS1. Persons have identical DNA in all of the cells and tissues of their bodies (with the exception of germ cells, red blood cells, and certain cells in the immune system).
-
2. GAS2. The presence of a particular genotype (polymorphism or mutation) entails that it is turned on, that is, it is capable of being transcribed in a manner associated with that polymorphism or mutation. Hence, the same two polymorphisms in any given two individuals will have the same capacity to be transcribed in the same manner (precisely what this entails will be considered below, but it empathically does not mean that any two polymorphisms in any two individuals are always being transcribed to the same extent).
-
3. GAS3. Specific genes are coded for the production of specific proteins.
GAS1 ensures that any tissue that is genotyped (e.g., buccal cells) yields a genome that is present in all other cells and tissues of the body (e.g., neurons). GAS2 ensures that genes that are associated with phenotypes are in fact capable of being transcribed. GAS3 ensures that genes that are associated with phenotypes are in fact associated with whatever intermediate protein is associated with the phenotype. (GAS3 is likely more relevant for candidate gene than for genome-wide association studies [GWAS], inasmuch as the former are hypothesis driven and the latter are not. That is, the hypothesis in candidate-gene association studies depends upon an assumption concerning the manner in which the protein for which the candidate gene is encoded affects behavior).
As we shall see, recent developments in molecular genetics call into question the validity of every one of these assumptions.
4. The genome
Because the distinction between germline and somatic inheritance will be important for much that follows, it might be useful to clarify this distinction. Germline inheritance refers to the process whereby genetic information is transmitted to offspring through sexual reproduction via germ cells or gametes (egg and sperm). By contrast, somatic inheritance occurs postconception when changes to DNA in somatic (i.e., non-gametic) cells are transmitted to daughter cells through the process of mitotic cellular division. An example of somatic inheritance is the reproduction of specialized cell types during embryogenesis and throughout the life course; for example, kidney cells produce only kidney cells, and any given kidney cell inherits the (epi)genetic markings of its progenitor. Another example would be an error in DNA replication during embryogenesis that gives rise to a mutation in stem cells destined to become kidney cells, with the result that only kidney cells contain this mutation. Inasmuch as somatic mutations do not affect the germline, they cannot be inherited from parents and cannot be transmitted to offspring. Although germline and somatic inheritance are treated as two distinct modes of inheritance, the distinction between the two is not hard and fast, and they are not always easy to differentiate (Notini et al. Reference Notini, Craig and White2008). Heritability studies in behavior genetics are intended to measure solely germline inheritance – that is, the behavioral effects of the genes one inherits from one's parents and can transmit to one's offspring. Finally, de novo mutations refer to mutations that appear for the first time in the DNA of a particular cell, often as a result of an error or errors in replication. Such mutations can arise in germ cells as well as postconception in the somatic cells of the embryo.
4.1. Transposable elements
One striking finding to emerge from the completion of the human genome sequencing project is that an astonishing ~48% of the genome is composed of transposable elements, repetitive mobile DNA sequences – “jumping genes” – dispersed throughout the genome (Gibbs Reference Gibbs2003). Although there are many different kinds of transposable elements, they are divided into two classes according to their movement strategies. Class I elements are made up of DNA transposons, composing 3% of the human genome, which move as segments of DNA by a cut-and-paste mechanism, “cutting” themselves out of their current genomic location and “pasting” themselves into a new location (Craig et al. Reference Craig, Craigie, Gellert and Lambowitz2002). Class II elements are retrotransposons, which compose ~45% of the genome and move by a replicative copy-and-paste mechanism: They copy themselves to RNA, and the original DNA copy is maintained at the same location. The RNA copy is then reverse-transcribed into DNA – that is, RNA→DNA (the standard direction of transcription in the synthesis of proteins being DNA→RNA→proteinFootnote 2 ), and the DNA is inserted into the genome at a new location. Hence, these elements expand in number as they retrotranspose, leading to an increase in genomic DNA content and a change in DNA sequence and structure at the region of insertion (Goodier & Kazazian Reference Goodier and Kazazian2008).
Conventional wisdom holds that transposable elements are “selfish” DNA parasites living within the genomes of organisms in a manner analogous to viruses (Dawkins Reference Dawkins2006; Orgel & Crick Reference Orgel and Crick1980). And indeed, the activity of transposable elements can disrupt gene transcription and cause a variety of pathogenic conditions (more than 70 known diseases involve heritable and de novo retrotransposition events (Cordaux & Batzer Reference Cordaux and Batzer2009). Over time, mutations and truncations of transposable elements have rendered many of them inactive. Class I elements – transposons – are, for the most part, inert fossil remains of ancient elements in human DNA (Lander Reference Lander2001). And many Class II elements – retrotransposons – have been rendered incapable of retrotransposition; that is, they are transpositionally incompetent, which means they can no longer move about the genome, copying and inserting themselves (Gilbert et al. Reference Gilbert, Lutz, Morrish and Moran2005), while those that remain transpositionally competent are often associated with pathogenesis and normally immobilized by epigenetic gene-silencing mechanisms (Callinan & Batzer Reference Callinan, Batzer and Volff2006). The one-sided view of retrotransposons as wholly destructive DNA parasites or as “junk DNA,” however, is giving way to a much more complex picture.
Recent evidence indicates that three types of retrotransposons retain the capacity to retrotranspose (Ostertag & Kazazian Reference Ostertag and Kazazian2001; Ostertag et al. Reference Ostertag, Goodier, Zhang and Kazazian2003; Rowold & Herrera Reference Rowold and Herrera2000). A base pair is a pair of conjoined DNA bases (the steps of the DNA spiral staircase, i.e., double-helix) and is used as a unit of DNA measurement. A long interspersed nucleotide element (LINE-1 or L1), is a transposition-competent retrotransposon greater than or equal to 7,000 base pairs in length (= 7 kilobases). L1 is the most widespread class of transposable elements in mammals, constituting ~20% of mammalian genomic DNA. While most L1 sequences are transpositionally incompetent, ~100–150 retrotransposons in the human genome retain the capacity to retrotranspose and of these, 10% are classified as highly active or hot (Brouha Reference Brouha2003). Alu elements are members of the class of short (100–300 base pairs) interspersed nucleotide elements (SINEs). Alu elements are a class of primate-specific Footnote 3 retrotransposons constituting the most prevalent repetitive element in the human genome (more than one million in number) and accounting for ~11% of genomic DNA. The human genome contains on average 2,000–3,000 transposition competent Alu elements (unlike L1s, which can autonomously retrotranspose, Alu elements require certain functional products of L1s to retrotranspose). SVA elements are hybrid transposable elements, ranging from 700 to 4,000 base pairs and combining features of both short and long interspersed nucleotide elements (though like Alu elements, they are non-autonomous). Approximately 3,000 active SVA elements have been identified in the human genome, and they are believed to be the youngest primate specific family of retrotransposons (Hancks & Kazazian Reference Hancks and Kazazian2010; Wang et al. Reference Wang, Xing, Grover, Hedges, Han, Walker and Batzer2005).
Consider first transpositionally incompetent L-1s, Alu elements, and SVAs. That a retrotransposon is transpositionally incompetent does not mean that is has no effect upon gene transcription. Diverse DNA regions are involved in the process of gene transcription, including promoter and regulatory regions, exons and introns, stop and start sites, as well as histone proteins, and transpositionally incompetent transposable elements can affect each of these:
-
1. A promoter is a region of DNA where specific proteins – transcription factors – bind to initiate the process of gene transcription. Transpositionally incompetent L1s that act as alternate promoters have been identified thus far for over 40 human protein-coding genes (Matlik et al. Reference Matlik, Redik and Speek2006). The activity of an alternate promoter can impact gene transcription in a number of ways, including overexpression: higher rates of gene transcription than would occur with only a single promoter, resulting in higher levels of protein synthesis.
-
2. A regulatory region is a segment of DNA where transcription factors and other regulatory proteins preferentially bind, and genome-wide scans have identified some 23,000 candidate regulatory regions derived from transpositionally incompetent L1s (Faulkner et al. Reference Faulkner, Kimura, Daub, Wani, Plessy, Irvine and Carninci2009).
-
3. Human genes typically contain several DNA sequences that code for amino acids (the building blocks of proteins) known as exons, interspersed with several introns, non-coding regions, and transpositionally incompetent L1s and Alu elements can function as both exons and introns (Muotri et al. Reference Muotri, Marchetto, Coufal and Gage2007; Zhang & Chasin Reference Zhang and Chasin2006).
-
4. Transpositionally incompetent L1s and Alu elements can function as stop sites, which are DNA regions that indicate the termination point for transcription of a particular DNA sequence (Muotri et al. Reference Muotri, Marchetto, Coufal and Gage2007; Zhang & Chasin Reference Zhang and Chasin2006). About 250,000 retrotransposon-derived transcription start sites, which are DNA sequences where gene transcription commences, have been identified (Faulkner et al. Reference Faulkner, Kimura, Daub, Wani, Plessy, Irvine and Carninci2009).
-
5. DNA is organized into units known as nucleosomes, each of which consists of a segment of DNA of ~145–150 base pairs wound around a histone protein core (Richmond & Davey Reference Richmond and Davey2003). Recent research indicates that Alu elements play a critical role in the positioning of nucleosomes (Tanaka et al. Reference Tanaka, Yamashita, Suzuki and Nakai2010), and the configuration of histones plays a critical role in the extent to which any given gene can be transcribed.
Hence, retrotransposons probably have a key influence upon the transcriptional output (the transcriptome) of the mammalian genome (Faulkner Reference Faulkner2011).
In contrast to transpositionally incompetent retrotransposons, transpositionally competent L1s, Alu elements, and SVAs are continually expanding in number in the human genome through ongoing germline retrotransposition (Batzer & Deininger Reference Batzer and Deininger2002; Ostertag & Kazazian Reference Ostertag and Kazazian2001). Some new (i.e., de novo) germline (hence heritable) L1 and Alu retrotransposition insertions have been generated so recently that they are found in only a single individual and are designated private de novo insertions (Conrad et al. Reference Conrad, Keebler, Depristo, Lindsay, Zhang, Casals and Awadalla2011; Mills et al. Reference Mills, Andrew Bennett, Iskow and Devine2007). Humans harbor a large genetic load of recent transposon insertions along with several million fixed (transpositionally incompetent) insertions: Estimates suggest that up to 600 million of these private germline insertions have been generated in human genomes throughout the world (Cordaux & Batzer Reference Cordaux and Batzer2009; Mills et al. Reference Mills, Andrew Bennett, Iskow and Devine2007; Xing et al. Reference Xing, Zhang, Han, Salem, Sen, Huff and Jorde2009). This represents a significant mutagenesis of the genome, collectively equivalent to one insertion for every five base pairs of chromosomal DNA, and these mutations are expected to influence a wide range of human phenotypes (Iskow et al. Reference Iskow, McCabe, Mills, Torene, Pittard, Neuwald and Devine2010). The ability of transposable elements to move within the genome gives them an intrinsic propensity to affect genome evolution through the creation of new DNA sequences and structures and ultimately, to affect the evolution of species (Cordaux & Batzer Reference Cordaux and Batzer2009; Rebollo et al. Reference Rebollo, Horard, Hubert and Vieira2010).
Transpositionally incompetent retrotransposons, the positions of which are fixed within the genome, can be inherited, like other alleles, according to the principles of Mendelian inheritance. Such does not appear to be the case regarding active retrotransposons. One unusual mode of active retrotransposon inheritance involves the inheritance not of DNA, but of RNA. It will be recalled that L1s retrotranspose by copying themselves to an RNA molecule that is then reverse transcribed (RNA→DNA) to form a copy of the original L1 retrotransposon. Kano et al. (Reference Kano, Godoy, Courtney, Vetter, Gerton and Ostertag2009) reported that the RNA of L1 elements is abundant in both germ cells and embryos and that L1 RNA transcribed in male or female germ cells can be carried over through fertilization and integrate in daughter cells during embryogenesis. This RNA is then reverse transcribed creating a de novo L1 retrotransposition insertion in the genome of offspring. In other words, active L1s exhibit a non-Mendelian RNA-based inheritance.
De novo somatic retrotransposition also occurs postconception in the somatic cells of the zygote. The activity of L1s capable of retrotransposition is regulated by the epigenome (Ostertag & Kazazian Reference Ostertag and Kazazian2001) which regulates the expressional activity of genes by a number of processes, one of which is DNA methylation (see sect. 5). During gamete formation and in early embryogenesis, short waves of demethylation in a region of the L1 that serves as a promoter of expression allows L1s to escape epigenetic silencing (Beraldi et al. Reference Beraldi, Pittoggi, Sciamanna, Mattei and Spadafora2006), and research suggests that activated retrotransposons play a critical role in the development of the human brain.
Neural precursor cells have the capacity to develop into any kind of neuron (out of an estimated 10,000 different kinds) as well as other nervous system cells. Coufal et al. (Reference Coufal, Garcia-Perez, Peng, Yeo, Mu, Lovci and Gage2009) demonstrated that human neural precursor cells, whether derived from fetal brains or from cultured embryonic stem cells, support the retrotransposition of an introduced human L1, and cells into which L1s were introduced generated distinct types of functional neurons. Using advanced DNA analysis on biopsied human heart, skin, liver, and brain cells, Coufal et al. detected more L1s in the genome of adult human brain cells than in the genomes of heart or liver cells from the same individual – as many as 100 extra copies per neuron tested relative to other organs, and they estimated 80–800 new insertions per cell in some brain regions. This is consistent with both somatic retrotransposition and with neural precursor cells having undergone more retrotransposition events than other tissues.
Applying high-throughput sequencing techniques to study somatic retrotransposition in human brain tissue, Baillie et al. (Reference Baillie, Barnett, Upton, Gerhardt, Richmond, De Sapio, Brennan, Rizzu, Smith, Fell, Talbot, Gustincich, Freeman, Mattick, Hume, Heutink, Carninci, Jeddeloh and Faulkner2011) identified 7,743 L1 insertions, 13,692 Alu insertions, and 1,350 SVA insertions in the hippocampus and caudate nucleus of three healthy individuals. A number of key loci were found to contain somatic L1 insertions, including dopamine receptors and serotonin neurotransmitter transporters. Baillie et al. also identified a disproportionate number of intronic L1 insertions, which is noteworthy inasmuch as introns are the protein-coding loci of DNA, and determined that genes containing intronic insertions were twice as likely to be differentially overexpressed (i.e., overtranscribed) in the brain. As they note of their findings: “The hippocampus seems to be predisposed to somatic L1 retrotransposition, which is intriguing given that [it] is a main source of adult neurogenesis” (Baillie et al. Reference Baillie, Barnett, Upton, Gerhardt, Richmond, De Sapio, Brennan, Rizzu, Smith, Fell, Talbot, Gustincich, Freeman, Mattick, Hume, Heutink, Carninci, Jeddeloh and Faulkner2011, pp. 3–4). For more on the hippocampus and neurogenesis, see section 4.1.1.
Given that each retrotransposition event that occurs in a cell results both in an increase in nuclear DNA (nDNA) and a change in DNA sequence, the discovery of 80 new retrotransposon insertions in some neurons, 800 in others, and more in the brain than in other tissues, entails somatic mosaicism, the existence in one and the same individual of two or more distinct genomes. It has been a long-standing dogma that humans have identical copies of DNA – identical genomes – in the nucleus (i.e., nDNA) of all the cells of their bodies (with the usual exceptions):
Fortunately, in the face of ever-increasing levels of variation being discovered in the human genome, there is at least one touchstone: The genomes of all the cells in a cancer-free individual are the same.… [A]side from … peculiar exceptions, and barring mutations accumulated as part of the ageing process, the genomes in all of your cells are identical. Or are they? (Dear Reference Dear2009, p. 452)
As the author of this quote notes, they are not. In fact, as we shall see, all of the genetic phenomena to be considered in this article contribute, in one way or another, to widespread somatic mosaicism.
4.1.1. Postnatal retrotransposition
For approximately one hundred years it was a central dogma of neuroscience that adult neurogenesis was impossible – that humans were born with all of the brain neurons they would ever possess (Cajal Reference Cajal1899). By 1992, this dogma was effectively overturned (Reynolds & Weiss Reference Reynolds and Weiss1992). New neurons are continually generated throughout adulthood predominantly in two regions of the brain: the dentate gyrus in the hippocampus (a paired brain structure involved in memory, learning, and emotion) and the subventricular zone (a layer of cells found along the brain's lateral ventricles) (Fuchs & Gould Reference Fuchs and Gould2000; Kuhn et al. Reference Kuhn, Dickinson-Anson and Gage1996). The newly generated neurons form synapses and are functionally integrated into existing neuronal circuits. There is evidence that adult neurogenesis is important for synaptic plasticity – that is, the ability of synaptic connections between neurons to change in response to changes in their level of activity, learning, and memory (Bruel-Jungerman et al. Reference Bruel-Jungerman, Laroche and Rampon2005; Kitamura et al. Reference Kitamura, Saitoh, Takashima, Murayama, Niibori, Ageta and Inokuchi2009; Neves et al. Reference Neves, Cooke and Bliss2008).
The level of adult hippocampal neurogenesis is positively and negatively modulated by environmental conditions, including environmental enrichment, physical activity, stress, and aging (Kuzumaki et al. Reference Kuzumaki, Ikegami, Tamura, Hareyama, Imai, Narita and Narita2010; Lista & Sorrentino Reference Lista and Sorrentino2009; Zhao et al. Reference Zhao, Deng and Gage2008). Exercise is known to have a significant impact upon hippocampal neurogenesis: It significantly increases the amount of brain-derived neurotropic factor (BDNF) in the hippocampus, a protein that supports the survival of existing neurons and encourages the growth and differentiation of new neurons and synapses (Bednarczyk et al. Reference Bednarczyk, Aumont, Dècary, Bergeron and Fernandes2009; Borght et al. Reference Borght, Van der Kubor-Nyakas, Klauke, Eggen, Nyakas, Van der Zee and Meerlo2009; Cotman & Berchtold Reference Cotman and Berchtold2002). Figure 1A shows that the levels of hippocampal BDNF are significantly higher in wheel-running as opposed to sedentary rodents after five days; Figure 1B shows that the levels of hippocampal BDNF correlate with the level of activity; and Figure 1C shows a 3.1-fold increase in the number of new neurons in the dentate gyrus of running as opposed to non-running mice.
Exercise alters levels of BDNF, number of new neurons in the hippocampus, and neuronal DNA. A. Quantification of hippocampal brain-derived neurotrophic factor (BDNF) protein levels in the hippocampus of sedentary and exercising animals after 5 days of wheel-running. B. Rats and mice acclimate rapidly to the running wheel and progressively increase their extent of daily running, in some cases up to 20 kilometers (~12–13 miles) per night. BDNF protein levels correlate with running distance (average over 14 days running). A & B adapted from Cotman and Berchtold (Reference Cotman and Berchtold2002, p. 297), with permission from Elsevier. C. Running significantly increases the total number of newborn neural cells. D. Differences in degree of retrotransposition in the hippocampus of sedentary and running mice. Mice were assigned to either control non-runner (n = 7) or runner (n = 7) conditions. Mice in the runner group ran an average distance of 5.1 ± 0.8 kilometers per day. Running mice showed a threefold increase of retrotransposition events in the dentate gyrus of the hippocampus. C & D adapted from Muotri et al. (Reference Muotri, Marchetto, Zhao and Gage2009, p. 1004–5). Reprinted with permission.

Given that retrotransposon activity has been associated with neurogenesis, we would expect environmental events known to increase hippocampal neurogenesis to increase hippocampal L1 retrotransposition as well. This is precisely what was demonstrated by Muotri et al. (Reference Muotri, Marchetto, Zhao and Gage2009): Voluntary running in rodents doubled L1 retrotransposition in the hippocampus of the rodent brain (Fig. 1D). As was noted above (sect. 4.1), Baillie et al. (Reference Baillie, Barnett, Upton, Gerhardt, Richmond, De Sapio, Brennan, Rizzu, Smith, Fell, Talbot, Gustincich, Freeman, Mattick, Hume, Heutink, Carninci, Jeddeloh and Faulkner2011) found an elevated number of retrotransposition events in the human brain relative to other regions, which is consistent with increased retrotransposition during neurogenesis in adult humans. Muotri et al. (Reference Muotri, Marchetto, Zhao and Gage2009) also reported an increase in L1 retrotransposition not only in neurogenic areas but also in non-neurogenic areas, such as the cerebellum. This finding indicates that running not only increases the number of new L1 insertions in the brain but also activates silenced L1 insertions in other non-neurogenic brain regions. In humans, depending on its impact upon the brain, L1-induced somatic DNA variability might induce behavioral changes that could help the individual to adapt better to changing environments or, alternatively, increase the risk of neuropsychiatric disorders (Marchetto et al. Reference Marchetto, Gage, Muotri and Ulrich2010; and sect. 7).
Because where retrotransposons activated in neural precursor cells ultimately end up in the brain is largely a result of stochastic factors (or perhaps, controlled stochasticity), the brains of MZ twins will exhibit retrotransposon induced intertwin (in addition to intratwin) genetic heterogeneity (Marchetto et al. Reference Marchetto, Gage, Muotri and Ulrich2010; Martin Reference Martin2009; Singer et al. Reference Singer, McConnell, Marchetto, Coufal and Gage2010). Such heterogeneity will result not only from brain-wide retrotransposition during embryogenesis, but from ongoing neurogenesis in the hippocampus that occurs throughout life. It is entirely conceivable that differences in lifestyle, such as one twin exercising more than another, could further contribute to an already existing neuronal genetic heterogeneity. As Martin (Reference Martin2009, p. 1088) observes of retrotransposition in the human brain and retrotransposon induced genetic heterogeneity in MZ twins: “These findings challenge the notion of the genome as a constant entity with limited impact on neuronal plasticity, and blur the distinction between genetic and environmental effects on the nervous system.”
4.1.2. Retrotransposons and behavior genetics
Following are several examples of studies that identify retrotransposons as a potential causal element in specific behavioral disorders. (A similar list is presented for CNVs, aneuploidy, copy number variation, and mtDNA).
-
1. Rett syndrome is a neurodevelopmental disorder characterized by loss of speech, stereotypic movements, mental retardation, and social-behavioral problems (Chahrour & Zoghbi Reference Chahrour and Zoghbi2007). Studies have linked many Rett syndrome cases to a defect in the methyl-CpG-binding protein 2 (MeCP2) gene, MeCP2 being a protein involved in DNA regulation and numerous human neurodevelopmental disorders. Muotri et al. (Reference Muotri, Marchetto, Coufal, Oefner, Yeo, Nakashima and Gage2010) recently discovered that L1 neuronal transcription and retrotransposition are increased up to sixfold in rodents lacking MeCP2 (MeCP2 null mice) compared to normal controls. Using neural precursor cells derived from human stem cells and human tissues, they demonstrated that patients with Rett syndrome who carry specific MeCP2 mutations have increased susceptibility for L1 retrotransposition activity specific to certain brain regions correlated with brain regions in MeCP2 null mice.
-
2. Huang et al. (Reference Huang, Schneider, Lu, Niranjan, Shen, Robinson and Burns2010),Footnote 4 in a study of X-chromosome L1 sites in 69 males with clinically defined X-linked intellectual disability, verified six novel, relatively uncommon L1 insertions and three private (i.e., unique) insertions within this group. Three were located in or near brain-expressed genes or genes with known roles in central nervous system development.
4.2. Copy number variations
The single nucleotide polymorphism (SNP) is the most familiar form of DNA variation. Approximately 10 million SNPs have been identified in the human population, and many more are being discovered with the determination of each personal genome sequence (Wheeler et al. Reference Wheeler, Srinivasan, Egholm, Shen, Chen, McGuire and Rothberg2008). Until recently, SNPs were thought to be the predominant form of genomic variation and to account for most normal, as well as abnormal, phenotypic variation in human phenotypes with a genetic component. A recent and important development in human molecular genetics has been the discovery of the ubiquitousness of a variety of structural variations (SVs) in DNA – deletions, insertions, duplications, and inversions – as well as more complex multisite variants of varying sizes that change the chromosomal architecture (Redon et al. Reference Redon, Ishikawa, Fitch, Feuk, Perry, Daniel Andrews and Hurles2006). It is now apparent that human genomes differ more as a consequence of structural variation than from differences in single nucleotides (i.e., SNPs) (Alkan et al. Reference Alkan, Coe and Eichler2011; Conrad et al. Reference Conrad, Pinto, Redon, Feuk, Gokcumen, Zhang and Hurles2010; Li et al. Reference Li, Zheng, Luo, Wu, Zhu, Li and Wang2011).
The most extensively studied of these SVs are submicroscopic copy number variations (CNVs), defined as stretches of DNA at least 1,000 base pairs (1 kilobase) long and extending up to several million base pairs, that are either deleted or present in multiple copies relative to a model normal genome (Feuk et al. Reference Feuk, Carson and Scherer2006; Iafrate Reference Iafrate2004; Redon et al. Reference Redon, Ishikawa, Fitch, Feuk, Perry, Daniel Andrews and Hurles2006). Many CNVs discovered thus far have a population frequency of greater than 1%, in which case they are referred to as copy number polymorphisms. In 2006, Redon et al. (Reference Redon, Ishikawa, Fitch, Feuk, Perry, Daniel Andrews and Hurles2006) constructed a first-generation CNV map of the human genome, showing that 2,900 genes, or 10% of the total number of genes in the human genome, are encompassed by CNVs. The average size of the CNVs was 250,000 base pairs. Since the average nuclear gene is 27,000–60,000 base pairs long (Alberts et al. Reference Alberts, Johnson, Lewis, Raff, Roberts and Walter2002), many of the CNVs were composed of multiple copies (or deletions) of entire genes, in some cases exceeding 12 copies of a single gene, challenging the dogma that individuals possess two copies of each gene (i.e., two alleles) in their nDNA.
The functional impact of CNVs on gene transcription has been demonstrated across the full range of biology (Conrad et al. Reference Conrad, Pinto, Redon, Feuk, Gokcumen, Zhang and Hurles2010; Hurles et al. Reference Hurles, Dermitzakis and Tyler-Smith2008). They can alter the expression of multiple genes located in the region of variable copy number simultaneously – approximately half of CNVs identified thus far overlap protein-coding genes (Sebat et al. Reference Sebat, Lakshmi, Troge, Alexander and Young2004) – allowing expression levels to be higher or lower than could be achieved by a single copy gene (Hastings et al. Reference Hastings, Lupski, Rosenberg and Ira2009; Stranger Reference Stranger2007). And while CNVs can affect the activity of neighboring genes, they can also have an equivalent effect at a distance: There is now substantial evidence that regulatory elements of genes can reside up to a million base pairs or more away (Nobrega et al. Reference Nobrega, Ovcharenko, Afzal and Rubin2003).
CNVs can be inherited via the germline in the manner of SNPs, while exhibiting mutation rates from 100 to 10,000 times greater across the human genome (Zhang et al. Reference Zhang, Gu, Hurles and Lupski2009). This accelerated rate of mutation may help explain several unique characteristics of CNVs. First, CNVs comprise a large percentage of the genetic differences between humans and apes, and appear to be a major driving force in evolution, especially in the rapid evolution that has occurred, and continues to occur, within the human and great ape lineages (Bailey et al. Reference Bailey, Kidd and Eichler2008). Second, CNVs display extremely high interindividual variation: Studies indicate that the total amount of DNA sequence variation involving CNVs between two normal subjects is actually higher than for SNPs (Korbel Reference Korbel2007). Third, and even more surprising, this variation appears to be intraindividual as well as interindividual. In other words, CNVs are another source of somatic mosaicism.
For example, in an analysis of 34 tissue samples from healthy subjects, Piotrowski et al. (Reference Piotrowski, Bruder, Andersson, Diaz de Stahl, Menzel, Sandgren, Poplawski, von Tell, Crasto, Bogdan, Bartoszewski, Bebok, Krzyzanowski, Jankowski, Partridge, Komorowski and Dumanski2008) observed at least six CNVs affecting a single organ of one or more tissues of the same subject. These findings were recently confirmed by Rodríguez-Santiago et al. (Reference Rodríguez-Santiago, Malats, Rothman, Armengol, Garcia-Closas, Kogevinas and Perez-Jurado2010), who, as part of a genome-wide survey of mosaic genomic variation, analyzed blood or buccal DNA samples of 1,991 adult individuals. They found copy number mosaicism in 1.7% of tissue samples from the same individual, and these variants were present in anywhere from 17% to 98% of all cells from the same tissue. Liang et al. (Reference Liang, Conte, Skarnes and Bradley2008) demonstrated that CNVs involving gains or losses of millions of base pairs occur during mitotic divisions of mouse embryonic stem cells during routine culture involving relatively few cellular divisions. The frequency and extent of these genomic changes in embryonic stem cells suggest that most somatic tissues will be mosaics composed of variants of the zygotic genome (Dear Reference Dear2009).
If copy number somatic mosaicism occurs intraindividually in healthy individuals during embryogenesis, then since MZ twins begin as a single individual (a single zygote), somatic mosaicism should occur between healthy MZ twins as well, resulting in inter-MZ twin genetic discordance. Bruder et al. (Reference Bruder, Piotrowski, Gijsbers, Andersson, Erickson, Diaz de Stahl, Menzel, Sandgren, von Tell, Poplawski, Crowley, Crasto, Partridge, Tiwari, Allison, Komorowski, van Ommen, Boomsma, Pedersen, den Dunnen, Wirdefeldt and Dumanski2008) confirmed this in a study of 29 pairs of MZ twins using peripheral blood-derived DNA samples. The study included 10 phenotypically unselected normal MZ twins and 19 twin pairs both concordant and discordant for Parkinson's disease, parkinsonianism, and Lewy body dementia. They discovered large-scale CNVs among all the twins, healthy and diseased, with an estimated frequency of up to 10% variation per twin pair. Footnote 5
It should be emphasized that these variations were found in a single tissue (i.e., blood). Given somatic mosaicism, the actual total percentage is likely much higher, and it is for this reason that Bruder et al. (Reference Piotrowski, Bruder, Andersson, Diaz de Stahl, Menzel, Sandgren, Poplawski, von Tell, Crasto, Bogdan, Bartoszewski, Bebok, Krzyzanowski, Jankowski, Partridge, Komorowski and Dumanski2008, p. 766) note: “It is likely that the confirmed CNVs shown here represent the ‘tip of the iceberg’ of all CNVs that are actually present in the studied twins.”
Finally, it is important to keep in mind that CNVs are not the only kind of structural variation common in the human genome. For example, there are more than one million microsatellites, variable numbers of 1–6 base pair repeats that account for 3% of the DNA sequence (Weber et al. Reference Weber, David, Heil, Fan, Zhao and Marth2002); about 150,000 minisatellites and variable number tandem repeats, polymorphic sequences containing 20–50 copies of 6–100 base pair repeats (Naslund et al. Reference Naslund, Saetre, von Salome, Bergstrom, Jareborg and Jazin2005); and about one million deletions and insertions of DNA base pairs (Weber et al. Reference Weber, David, Heil, Fan, Zhao and Marth2002). Therefore, CNV mosaicism itself likely represents the tip of the mosaic iceberg.
4.2.1. CNVs and behavior genetics
Examples of studies that identify CNVs as a potential causal element in specific behavioral disorders.
-
1. In a genome-wide association study (GWAS) of rare (<1% frequency) CNVs involving 996 individuals with autism spectrum disorder and 1,287 matched controls, Pinto et al. (Reference Pinto, Pagnamenta, Klei, Anney, Merico, Regan and Betancur2010) found that cases carried a higher global burden of rare CNV variants (1.19 fold, P = 0.012), especially for loci previously implicated in either autism and/or intellectual disability (1.69 fold, P = 3.4 × 10(−4)). Among the CNVs there were numerous somatic de novo and inherited events, sometimes in combination in a given family. They also discovered an enrichment of CNVs disrupting functional gene sets involved in cellular proliferation, projection and motility, and intercellular signaling. Other studies have also reported an association between de novo CNVs and autism (Glessner et al. Reference Glessner, Wang, Cai, Korvatska, Kim, Wood and Hakonarson2009; Marshall et al. Reference Marshall, Noor, Vincent, Lionel, Feuk, Skaug and Scherer2008; Sebat et al. Reference Sebat, Lakshmi, Malhotra, Troge, Lese-Martin, Walsh and Wigler2007).
-
2. Several genome-wide association studies (GWAS) of individuals with schizophrenia have found a higher number of individually rare CNVs in cases versus controls, and these CNVs disproportionately disrupted genes known to be involved in neurodevelopment (Buizer-Voskamp et al. Reference Buizer-Voskamp, Muntjewerff, Strengman, Sabatti, Stefansson, Vorstman and Ophoff2011; Kirov et al. Reference Kirov, Grozeva, Norton, Ivanov, Mantripragada, Holmans and O'Donovan2009; Stefansson et al. Reference Stefansson, Rujescu, Cichon, Pietilainen, Ingason, Steinberg and Stefansson2008; Walsh et al. Reference Walsh, McClellan, McCarthy, Addington, Pierce, Cooper and Sebat2008).
-
3. In a GWAS of children with attention-deficit/hyperactivity disorder (ADHD) involving 366 cases and 1,047 controls, Williams et al. (2010) reported a significantly increased rate of CNVs in children with ADHD, with 57 large, rare CNVs identified in cases and 78 in controls.Footnote 6
In addition, CNVs have been associated with numerous classes of human disease with an underlying genetic basis (Almal & Padh 2012; Buchanan & Scherer Reference Buchanan and Scherer2008).
4.3. Aneuploidy
Humans possess 23 pairs of chromosomes, with each parent providing one chromosome in each pair, a condition referred to as diploidy (excepting male sex chromosomes: males contain a single X and a single Y chromosome). Any variation in the number of chromosomes, either more or less, is typically associated with pathogenesis. For example, trisomies are characterized by an extra chromosome (e.g., trisomy 21, or Down syndrome, and trisomy 18, or Edward syndrome); monosomies are characterized by the complete or partial absence of a chromosome (e.g., Turner syndrome, characterized by a single X chromosome instead of an XX or XY). Despite this association with pathogenesis, there is a surprisingly high degree of germline and somatic chromosomal mosaicism in healthy individuals.
It is estimated that 2–5% of healthy male sperm exhibit one or another form of aneuploidy, with significant intra- and interindividual variations (Tempest et al. Reference Tempest, Ko, Rademaker, Chan, Robaire and Martin2009; Templado et al. Reference Templado, Vidal and Estop2011). Approximately 2.26% of healthy sperm exhibits disomy (sperm should exhibit monosomy), while the estimated rate of 2× disomy is 4.5%. Longitudinal analysis in which sperm samples were obtained from healthy males, ages 18–32, every 6 months for 18 months, revealed significant time dependent intraindividual fluctuations in both the total amount of aneuploidy and in the chromosomes affected (Tempest et al. Reference Tempest, Ko, Rademaker, Chan, Robaire and Martin2009). Studies have associated increases in sperm aneuploidy frequency with a variety of environmental factors, including increases in consumption of caffeine, alcohol, drugs, and smoking; increased exposure to pesticides and endocrine compounds; and infection or illness (Härkönen Reference Härkönen2005; Robbins et al. Reference Robbins, Elashoff, Xun, Jia, Li, Wu and Wei2005; Shi et al. Reference Shi, Ko, Barclay, Hoang, Rademaker and Martin2001). In oocytes of healthy females, the rate of aneuploidy is much higher: Cytogenetic analysis places the aneuploidy rate at anywhere from 20% to 25% (Templado et al. Reference Templado, Vidal and Estop2011).
Distinguishing between germline and somatic chromosomal mosaicism is complicated because some chromosomal abnormalities, although the result of an abnormality in the parental gamete, are not considered inherited in the usual sense of that term. For example, a common form of trisomy 21 is the result of an error during meiosis – that is, during the formation of the maternal ovum. Because this error affects only one or several ova, the child who develops trisomy 21 has not inherited the mother's genotype (which is normal) but rather has developed from a defective ovum (Antonarakis et al. Reference Antonarakis, Lyle, Dermitzakis, Reymond and Deutsch2004; Hassold & Hunt Reference Hassold and Hunt2001). Hence, this form of aneuploidy is not considered germline aneuploidy. By contrast, germline aneuploidy has been thought to be a rare cause of aneuploidy in the human population, but recent evidence from cytological and population studies suggests otherwise. Molecular and cytogenic analyses have revealed that approximately 5% of young couples with a Down syndrome child show evidence of trisomies on chromosomes 13 and 19 (Kovaleva & Tahmasebi-Hesari Reference Kovaleva and Tahmasebi-Hesari2007). Most recently, direct analysis of fetal ovarian premeiotic, meiotic, and stromal cells (i.e., connective tissue) in normal offspring showed low-level trisomy 21 aneuploidy in every sample tested (Delhanty Reference Delhanty2011; Hulten et al. Reference Hulten, Patel, Westgren, Papadogiannakis, Jonsson, Jonasson and Iwarsson2010; Kovaleva Reference Kovaleva2010). This has led to the suggestion that the apparently universal trisomy 21 germline mosaicism in females may account for the relatively high occurrence of Down syndrome in the human population. As Delhanty (Reference Delhanty2011, p. 136) notes, “Based upon this evidence, germinal or gonadal mosaicism is likely to make a significant contribution to aneuploidy in the human population.”
Recent conservative estimates place the overall percentage of aneuploid neural cells in the normal adult brain at an astonishing 10%, involving monosomy, trisomy, tetrasomy, polyploidy (greater than four chromosomes), and uniparental disomy, that is, two copies of a chromosome from one parent (Iourov et al. Reference Iourov, Vorsanova and Yurov2006; Reference Iourov, Vorsanova, Liehr and Yurov2009; Rehen Reference Rehen, Yung, McCreight, Kaushal, Yang, Almeida, Kingsbury Cabral, McConnell, Anliker, Fontanoz and Chun2005). This is an indication of widespread chromosomal somatic mosaicism in the human brain (see Table 1). Given an estimated 100 billion neurons in the adult brain, this yields a rough (conservative) estimate of 10 billion neurons and 100–500 billion glial cells (neural cells that do not transmit electrical impulses but play an essential role in neuronal structure and function) with one or another form of chromosomal aneuploidy. It is estimated that roughly 28% of embryonic neural precursor cells exhibit chromosomal aneuploidy in one form or another (Iourov et al. Reference Iourov, Vorsanova, Liehr and Yurov2009). This chromosomal diversity appears to result from a high frequency of stochastic postzygotic chromosome mutations in somatic cells, whereby neuroprogenitor cells in numerous regions of the embryonic brain display cell division defects in normal cells that result in aneuploid adult cell progeny.
Percentage of whole chromosome 21 gain and loss in the normal brain varies within and among individuals

Note: Lymphocytes and Down syndrome cells were used to validate the counting criteria. Adapted from Rehen et. al. (Reference Rehen, Yung, McCreight, Kaushal, Yang, Almeida, Kingsbury Cabral, McConnell, Anliker, Fontanoz and Chun2005, p. 2178). Reprinted with permission.
Various lines of evidence indicate that brain tissues may be more prone to aneuploidy than other tissues (Rehen Reference Rehen, Yung, McCreight, Kaushal, Yang, Almeida, Kingsbury Cabral, McConnell, Anliker, Fontanoz and Chun2005). Mature aneuploid neurons are functionally active and integrated into brain circuitry, showing distant axonal connections (Kingsbury Reference Kingsbury2005). One likely result of this is neuronal signaling differences caused by altered gene expression, as documented in mammalian neural cells (Kaushal et al. Reference Kaushal, Contos, Treuner, Yang, Kingsbury, Rehen and Chun2003). Thus, a network composed of intermixed diploid and aneuploid neurons might produce unique signaling properties distinct from a network composed purely of diploid cells (Pavelka et al. Reference Pavelka, Rancati, Zhu, Bradford, Saraf, Florens and Li2010; Westra et al. Reference Westra, Rivera, Bushman, Yung, Peterson, Barral and Chun2010). Once again, the highly stochastic nature of chromosomal aneuploidy and resulting chromosomal mosaicism ensures that MZ twins will have differences in their neuronal chromosomes and that siblings will depart from a presumed 50% possession of the parental nuclear genome. MZ twins discordant for aneuploidy have been recognized for several decades: Discordant MZ twins have been reported for monosomy X, trisomy 1, trisomy 13, trisomy 21, and uniparental disomy (Gilgenkrantz & Janot Reference Gilgenkrantz and Janot1983; Nieuwint et al. Reference Nieuwint, Van Zalen-Sprock, Hummel, Pals, Van Vugt, Van Der Harten and Madan1999; Rogers et al. Reference Rogers, Voullaire and Gold1982; Uchida et al. Reference Uchida, deSa and Whelan1983; Weiss et al. Reference Weiss, Loevy, Saunders, Pruzansky, Rosenthal and Opitz1982).
4.3.1. Aneuploidy and behavior genetics
Many, if not most, of the disorders associated with aneuploidy affect cognitive functioning and behavior in one way or another (Borgaonkar Reference Borgaonkar1997; Gersen & Keagle Reference Gersen and Keagle2005).
Examples of studies that identify aneuploidy as a potential causal element in specific behavioral disorders
-
1. Comparing aneuploidy frequency in 12 control and 12 schizophrenia brains by scoring more than 50,000 individual brain cells, Yurov et al. (Reference Yurov, Iourov, Vorsanova, Demidova, Kravetz, Beresheva and Liehr2008) detected an approximately twofold increase of stochastic aneuploidy levels on chromosome 1 in the schizophrenia brain relative to controls.
-
2. Iourov et al. (Reference Iourov, Vorsanova, Liehr and Yurov2009) monitored aneuploidy in the cerebral cortex of normal and Alzheimer's disease brains by molecular cytogenetic approaches scoring more than 480,000 neural cells, using sets of DNA probes for chromosomes 1, 7, 11, 13, 14, 17, 18, 21, X, and Y. They found a 10-fold increase of chromosome 21-specific aneuploidy – both hypoploidy (<2 chromosomes per cell) and hyperploidy (>2 chromosomes) were detected in the Alzheimer's cerebral cortex (6–15% versus 0.8–1.8% in control). They concluded that somatic mosaic aneuploidy differentially contributes to intercellular genomic variation in the normal and Alzheimer's brain and noted that neural aneuploidy leading to altered cellular physiology may significantly contribute to the pathogenesis of neurodegenerative diseases.
4.4. Mitochondrial DNA
We are accustomed to discussing the human genome – the familiar double-stranded helix that exists in identical form in all the cells of our bodies. Humans, however, do not have a genome, but at least two entirely distinct genomes, differing not only in structure, but also in the manner in which they are inherited.
Mitochondria are intracellular organelles, small membrane-enclosed structures within the cell, in which the end product of the breakdown of glucose in cells is processed to form the primary source of cellular energy, adenosine triphosphate (ATP). Hence, mitochondria are commonly characterized as the powerhouses of the cell (McBride et al. Reference McBride, Neuspiel and Wasiak2006). However, mitochondria also play a central role in a number of critical cellular and metabolic processes, including cellular proliferation; apoptosis or programmed cell death (cellular suicide), a process aimed at destroying a physiologically unwanted cell (Desagher & Martinou Reference Desagher and Martinou2000); the regulation and homeostasis of intracellular calcium, which acts as an intracellular signal involved in numerous cellular processes including cellular expression and metabolism; fertilization and embryonic development (Cao & Chen Reference Cao and Chen2009); DNA repair (DNA is constantly exposed to endogenous and exogenous agents that generate DNA lesions and induce DNA instability; see Gredilla et al. Reference Gredilla, Bohr and Stevnsner2010); aging (Salvioli et al. Reference Salvioli, Bonafe, Capri, Monti and Franceschi2001); the regulation of steroid hormone synthesis in the adrenal cortex, including estrogen, testosterone, and cortisol (Almahbobi et al. Reference Almahbobi, Williams and Hall1992); synthesis of heme, one of the components of hemoglobin (Atamna Reference Atamna2004); and detoxification of ammonia from the liver (Jackson et al. Reference Jackson, Beaudet and O'Brien1986). Mitochondria also play a critically important role in the brain and are involved in the regulation of brain function, including synaptic plasticity and brain size (Chada & Hollenbeck Reference Chada and Hollenbeck2004).
Mitochondria possess their own genome composed of mitochondrial DNA (mtDNA), a circular structure of double-stranded DNA located within the mitochondrion itself and separate from the more familiar genome located in the cell's nucleus, that is, nuclear DNA (nDNA). Mitochondrial DNA exhibits a number of properties that distinguish it from nDNA. First, mtDNA is not inherited in Mendelian fashion, but rather, it is inherited from the mother; that is, it is exclusively transmitted by the oocytes. Second, mtDNA exhibits polyploidy, numerous multiple copies of the complete mitochondrial genome in a single cell that occur in variable numbers both within individual mitochondria, which possess 2–10 copies of mtDNA each, and in individual cells, which vary significantly in the amount of mitochondria, and hence mtDNA, that they contain, on the basis of cell-type (Clay Montier et al. Reference Clay Montier, Deng and Bai2009). For example, there are 1,075–2,794 copies of mtDNA per cell in muscle cells, 1,200–10,800 in neurons, and up to 25,000 in liver cells. Studies have shown differences in the mtDNA content of different oocytes from the same female ranging from 11,000–903,000 mtDNA molecules per oocyte (MayPanloup et al. Reference MayPanloup, Chretien, Malthiery, Reynier and Justin2007). Third, mtDNA exhibits heteroplasmy, the occurrence of allelic differences between the multiple copies of mtDNA in the same individual that often segregate differentially in different tissues (Pfeiffer et al. Reference Pfeiffer, Lutz-Bonengel, Pollak, Fimmers, Baur and Brinkmann2004). Fourth, the mtDNA mutation rate is anywhere from ~9 to 25 times greater than that for nDNA, and mutations are commonly inherited both somatically and via the germline (Lynch et al. Reference Lynch, Koskella and Schaack2006).
The association between human mtDNA mutations and phenotype is significantly complicated by the dual features of polyploidy and heteroplasmy. Due to heteroplasmy, not all copies of mutated mtDNA will exist in all of the copies of the mtDNA genome; due to polyploidy, the number of copies of the mtDNA genome possessing the mutation will vary in different cells and tissues of the body and may be preferentially segregated in certain tissue types. In the case of diseases known to be associated with a mtDNA mutation, whether or not the phenotype is expressed depends upon whether the mtDNA is localized in certain cells and tissues of the body, and if so, which cells and tissues, and whether the amount of mutated mtDNA surpasses a certain threshold level necessary for the appearance of the phenotype (Taylor & Turnbull Reference Taylor and Turnbull2005).
Because oocytes from the same mother can differ dramatically in the amount of mtDNA they contain and likewise in the amount of mutated mtDNA they contain, the amount of mtDNA any given sibling possesses is a result of whatever maternal oocyte he or she happened to develop from, as well as a host of other stochastic processes that occur during embryogenesis. Hence, siblings will not possess 50% of their mother's mtDNA, and although MZ twins develop from a single fertilized oocyte, mtDNA is stochastically partitioned with the first mitotic cell division. Suppose we are concerned with the heritability of a trait associated with a certain mtDNA mutation. It is possible for one MZ twin to receive more than half mutant mtDNA molecules while the other twin receives only a tiny fraction, depending on how the twins divide from each other and how much mutant mtDNA happens to be on each side of the division. Even with an even division, the mutant mtDNA in one twin may end up in cells that eventually die during normal development, while the mutant mtDNA in the other twin may end up in cells that differentiate into brain tissue (Clay Montier et al. Reference Clay Montier, Deng and Bai2009).
4.4.1. Mitochondrial DNA and behavior genetics
Polymorphic variation in mtDNA has been associated with the increased likelihood of developing various psychiatric disorders (Hroudová & Fišar Reference Hroudová and Fišar2011) including autism (Giulivi et al. Reference Giulivi, Zhang, Omanska-Klusek, Ross-Inta, Wong, Hertz-Picciotto and Pessah2010), schizophrenia (Clay et al. Reference Clay, Sillivan and Konradi2011), bipolar disorder (Rollins et al. Reference Rollins, Martin, Sequeira, Moon, Morgan, Watson and Vawter2009), depression (Kato et al. Reference Kato, Nakamura, Ichiba, Tomiyasu, Shimo, Higuchi and Sano2011), Parkinson's disease (Shinohara Reference Shinohara2001), and Alzheimer's (Coskun Reference Coskun, Flint Beal and Wallace2004), and has been associated with differences in cognitive ability (Dimauro & Davidzon Reference Dimauro and Davidzon2005).
5. The epigenome
Epigenetics is the study of heritable changes – both germline and somatic – in gene transcribabilityFootnote 7 and phenotype that occur without changes in DNA sequence (Bollati & Baccarelli Reference Bollati and Baccarelli2010). For the most part, genes are transcribed to produce RNA and proteins, but before a gene can be transcribed, it must be turned on – that is, activated (Martienssen et al. Reference Martienssen, Riggs and Russo1996). Genes are not self-activating, and the mere presence of a gene as part of an individual's genotype does not entail that it is capable of being transcribed. Rather, genes are turned on and off by the epigenome, the complex biochemical regulatory system that silences, activates, and changes the transcriptional activity of genes without any change to the DNA sequence itself (Bernstein et al. Reference Bernstein, Meissner and Lander2007). Just how significant these changes can be phenotypically can be illustrated by considering the role of the epigenome in cellular differentiation: A heart cell, for example, differs from a neuron not because of differences in DNA sequence or structure, but (in part) because of differences in epigenetic programming between the two cell types. While epigenetic modifications of the genome can be stable throughout the life course, such as the epigenetic modifications that contribute to cellular differentiation during embryogenesis, they can also be environmentally responsive, changing the transcribability of the genome in response to environmental input. The term environmental epigenomics reflects the constant interplay between the environment, which includes both endogenous (e.g., hormone levels or immune status) and exogenous (e.g., the perinatal environment) factors, and the epigenome (Jirtle & Skinner Reference Jirtle and Skinner2007).
While new epigenetic mechanisms are being uncovered, the best characterized are histone modification, DNA methylation, and the expression of non-coding micro RNAs (Chuang & Jones Reference Chuang and Jones2007; Kim et al. Reference Kim, Samaranayake and Pradhan2009). Within the cell's nucleus, nDNA is wrapped around a core of histone proteins that exhibit histone tails, which are histone strands that extend outside the nucleosome core and wrap around the DNA molecule. In histone modification, a variety of chemical modifications to the histone tails (e.g., acetylation, methylation, and phosphorylation) change the structure of histones in such a way as to make the DNA either more or less accessible to transcription factors. In DNA methylation, the addition of a methyl group to CpG dinucleotides (sites in the DNA molecule where a cytosine base is followed by a guanine base) acts as a physical barrier to transcription factors and attracts enzymes and proteins that further reduce the transcriptional activity of a gene. Non-coding RNAs (ncRNAs) are not involved in gene transcription, like the more familiar messenger RNA (mRNA), but function instead as a vast system for posttranscriptional regulation of DNA, regulating gene silencing by binding to mRNAs. Non-coding RNAs include at least 1,000 different kinds of micro RNA (miRNAs) – and the number may be as high as 20,000 – short RNA molecules approximately 22 nucleotides long. It was once believed that DNA was involved primarily in the transcription of proteins, but in fact, 97–98% of the transcriptional activity of the human genome is devoted to non-protein-coding RNA (Mattick Reference Mattick2001).
Studies indicate that epigenetic changes can be inherited via the germline as well as somatically, resulting in the intergenerational non-genomic inheritance of epigenetic states (Anway et al. Reference Anway, Rekow and Skinner2008; Crews et al. Reference Crews, Gore, Hsu, Dangleben, Spinetta, Schallert and Skinner2007; Cuzin et al. Reference Cuzin, Grandjean and Rassoulzadegan2008; Jablonka & Raz Reference Jablonka and Raz2009; Pentinat et al. Reference Pentinat, Ramon-Krauel, Cebria, Diaz and Jimenez-Chillaron2010; Skinner et al. Reference Skinner, Anway, Savenkova, Gore and Crews2008; Stouder & Paoloni-Giacobino Reference Stouder and Paoloni-Giacobino2010; Walker & Gore Reference Walker and Gore2011). It was once believed that genome-wide epigenetic reprogramming during gametogenesis and early embryogenesis would erase epigenetic modifications acquired during the life of the animal in order to restore the totipotency of the fertilized egg (i.e., the ability of fetal stem cells to become any cell type) (Allegrucci et al. Reference Allegrucci, Thurston, Lucas and Young2005). This epigenetic reprogramming, however, is not complete. Modifications at variably expressed alleles are not completely erased during gametogenesis and embryogenesis while other epigenetic markings are reestablished as part of the developmental process (Jablonka & Raz Reference Jablonka and Raz2009).
A much studied example of the intergenerational transmission of epigenetic programming and associated phenotypesFootnote 8 concerns endocrine disruptors, synthetic chemicals that can have disruptive effects upon the mammalian endocrine system (National Institute of Environmental Health 2010). Studies have demonstrated that embryonic exposure to the endocrine disruptor vinclozolin (a common fungicide) during gonadal sex determination in rodents induces a transgenerational phenotype characterized by spermatogenic cell defects and subfertility in the F1 (first) through F3 (third) generations (Anway et al. Reference Anway, Rekow and Skinner2008; Clement et al. Reference Clement, Savenkova, Settles, Anway and Skinner2010; Nilsson et al. Reference Nilsson, Anway, Stanfield and Skinner2008; Stouder & Paoloni-Giacobino Reference Stouder and Paoloni-Giacobino2010; Uzumcu et al. Reference Uzumcu, Suzuki and Skinner2008). This exposure has also been associated with a decrease in anxiety-like behavior in third-generation males (Skinner et al. Reference Skinner, Anway, Savenkova, Gore and Crews2008). The transmission of these phenotypes is not associated with any changes in DNA sequence; rather, it is associated with changes in DNA methylation at specific genes known to be involved in spermatogenesis.
Imprinting is an epigenetic process, essential to normal development, in which genes are preferentially expressed in a parent-of-origin manner. For example, the maternal allele may be highly methylated (and effectively silenced), while the paternal allele is largely unmethylated (Beard & Jaenisch Reference Beard and Jaenisch1993; Kaneda et al. Reference Kaneda, Okano, Hata, Sado, Tsujimoto, Li and Sasaki2004; Kato et al. Reference Kato, Kaneda, Hata, Kumaki, Hisano and Kohara2007). Decreases in human spermatogenesis are associated with imprinting defects on a number of the same genes that have shown abnormal methylation patterns in vinclozolin studies (Stouder & Paoloni-Giacobino Reference Stouder and Paoloni-Giacobino2010). This is particularly suggestive given that in the past century a significant decline in sperm count has been documented in young, healthy males in industrialized countries, a finding that may in part explain a parallel decline in birthrates (Andersson et al. Reference Andersson, Jorgensen, Main, Toppari, Rajpert-De Meyts, Leffers and Skakkebek2008; Joffe Reference Joffe2010). The rapidity of these changes strongly suggests that environmental factors play a role. Endocrine disruptors are a plausible contributing factor given their ubiquitousness in the environment in the form of herbicides, insecticides, and fungicides, resulting in daily exposure for many human populations (Sultan et al. Reference Sultan, Balaguer, Terouanne, Georget, Paris, Jeandel and Nicolas2001).
5.1. Epigenetics and monozygotic twins
Monozygotic twins exhibit significant intertwin epigenetic differences, and these differences may play an important role in intertwin phenotypic differences (Fraga et al. Reference Fraga, Ballesta, Paz, Ropero and Setien2005; Kaminsky et al. Reference Kaminsky, Tang, Wang, Ptak, Oh, Wong, Feldcamp, Virtanen, Halfvarson, Tysk, McRae, Visscher, Montgomery, Gottesman, Martin and Petronis2009; Poulsen et al. Reference Poulsen, Esteller, Vaag and Frage2007). MZ intertwin differences in DNA methylation and histone modification profiles have been reported in whole-genome-wide scans, select tissues samples, and specific genomic regions (Boks et al. Reference Boks, Derks, Weisenberger, Strengman, Janson, Sommer and Ophoff2009; Fraga et al. Reference Fraga, Ballesta, Paz, Ropero and Setien2005; Kaminsky et al. Reference Kaminsky, Tang, Wang, Ptak, Oh, Wong, Feldcamp, Virtanen, Halfvarson, Tysk, McRae, Visscher, Montgomery, Gottesman, Martin and Petronis2009; Wong et al. Reference Wong, Caspi, Williams, Craig, Houts, Ambler, Moffit and Mill2010). In a comparison of gene expression of 3-year-old and 50-year-old MZ twins, Fraga et al. (Reference Fraga, Ballesta, Paz, Ropero and Setien2005) identified a fourfold increase in epigenetic discordance in older versus younger twins. And in a recent study, Ollikainen et al. (Reference Ollikainen, Smith, Joo, Kiat Ng, Andronikos, Novakovic and Craig2010) analyzed DNA methylation levels in five different tissues from 56 MZ and 35 DZ newborns. In examining individual CpG dinucleotides, they found up to 82% discordance in DZ twin pairs and up to 54% in MZ twin pairs. They note that their findings “demonstrate that the intrauterine period is a sensitive time for the establishment of epigenetic variability in humans, with implications for the effects of maternal environment in addition to genetics on the development of the newborn epigenome and potentially for programming of later disease risk” (Ollikainen et al. Reference Ollikainen, Smith, Joo, Kiat Ng, Andronikos, Novakovic and Craig2010, p. 4176). (For more on epigenetics and the intrauterine environment, see sect. 7.)
5.2. Behavioral epigenetics
There is growing evidence for the role of epigenetic modifications in all aspects of normal neural development and functioning including perception, memory, cognition and learning, emotion, and neural and behavioral plasticity (Allen 2008; Champagne Reference Champagne2010b; Crews Reference Crews2008; Day & Sweatt Reference Day and Sweatt2011; Gao Reference Gao2008; Keverne & Curley Reference Keverne and Curley2008; Kuss & Chen Reference Kuss and Chen2008; Mehler Reference Mehler2008; Meza-Sosa et al. Reference Meza-Sosa, Valle-García, Pedraza-Alva and Pérez-Martínez2012; Molfese Reference Molfese2011; Nelson et al. Reference Nelson, Kiriakidou, Mourelatos, Tan, Jennings, Xie and Wang2010; Roth et al. Reference Roth, Roth and Sweatt2010). Epigenetic disregulation may contribute to abnormal gene expression in a range of neuropsychiatric disorders and neurodegenerative diseases, including autism, schizophrenia, depression, and Alzheimer's disease (Abdolmaleky et al. Reference Abdolmaleky, Yaqubi, Papageorgis, Lambert, Ozturk, Sivaraman and Thiagalingam2011; Akbarian Reference Akbarian2010; Coppieters & Dragunow Reference Coppieters and Dragunow2011; Gruber Reference Gruber2011; Nelson et al. Reference Nelson, Wang and Rajeev2008; Paslakis et al. Reference Paslakis, Bleich, Frieling and Deuschle2011; Grafodatskaya et al. Reference Grafodatskaya, Chung, Szatmari and Weksberg2010).
5.2.1. Behavioral epigenetics and the perinatal environment
A number of studies have demonstrated how the perinatal environment can program the epigenome with potentially lifelong behavioral consequences (Cameron et al. Reference Cameron, Shahrokh, Del Corpo, Dhir, Szyf, Champagne and Meaney2008; Champagne & Curley Reference Champagne and Curley2008; Reference Champagne, Curley, Maestripieri and Mateo2009; Darnaudery & Maccari Reference Darnaudery and Maccari2008; Goyal et al. Reference Goyal, Goyal, Leitzke, Gheorghe and Longo2010; Ho & Burggren Reference Ho and Burggren2010; McGowan & Szyf Reference McGowan and Szyf2010; McGowan et al. Reference McGowan, Meaney and Szyf2008; Reference McGowan, Sasaki, D'Alessio, Dymov, Labonte, Szyf and Meaney2009; Mueller & Bale Reference Mueller and Bale2008; Murgatroyd & Spengler Reference Murgatroyd and Spengler2011; Oberlander et al. Reference Oberlander, Weinberg, Papsdorf, Grunau, Misri and Devlin2008; Reyes-Castro et al. Reference Reyes-Castro, Rodriguez, Rodriguez-Gonzalez, Wimmer, McDonald, Larrea and Zambrano2011; Sakhai et al. Reference Sakhai, Kriegsfeld and Francis2011; Szyf Reference Szyf2009; Vucetic et al. Reference Vucetic, Kimmel, Totoki, Hollenbeck and Reyes2010; Walker & McCormick Reference Walker, McCormick, Donald, Arthur, Susan, Anne and Robert2009; Weaver Reference Weaver2009; Weaver et al. Reference Weaver, Cervoni, Champagne, D'Alessio, Sharma and Seckl2004; Weinstock Reference Weinstock2008). A notable example from animal studies concerns the relationship between maternal rearing behavior and the stress response. Mother rats exhibit stable interindividual differences in the amount of licking and grooming (LG) behavior they display toward offspring (Liu et al. Reference Liu, Diorio, Tannenbaum, Caldji and Francis1997). Pups raised by high-LG dams consistently exhibit, as adults, lower levels of stress as measured both physiologically and behaviorally, while pups raised by low-LG dams exhibit, as adults, high levels of stress. Furthermore, the female offspring of high-LG mothers become, as adults, high-LG mothers themselves, while the female offspring of low-LG mothers become low-LG mothers. Cross-fostering studies have consistently indicted that adult offspring are more likely to resemble their foster as opposed to biological mothers in stress-related behavioral phenotypes and in rearing behavior (Barha et al. Reference Barha, Pawluski and Galea2007; Caldji et al. Reference Caldji, Diorio and Meaney2003; Champagne & Curley Reference Champagne, Curley, Maestripieri and Mateo2009; Fish et al. Reference Fish, Shahrokh, Bagot, Caldji, Bredy, Szyf and Meaney2004; Francis & Meaney Reference Francis and Meaney1999; Liu et al. Reference Liu, Diorio, Tannenbaum, Caldji and Francis1997; Menard & Hakvoort Reference Menard and Hakvoort2007; Weaver et al. Reference Weaver, Cervoni, Champagne, D'Alessio, Sharma and Seckl2004).
In mammals, the stress response involves a complex series of neurological, cardiovascular, respiratory, gastrointestinal, renal, endocrine, and immunological processes. A central component of this response involves the hypothalamo-pituitary-adrenal (HPA) axis (Tsigos & Chrousos Reference Tsigos and Chrousos2002). The hypothalamus releases corticotrophin-releasing factor (CRF), which stimulates the release of adrenocorticotropic hormone (ACTH) from the pituitary glands into the general bloodstream. ACTH in turn stimulates the release of the glucocorticoid hormones (cortisol in humans, corticosterone in rodents) and the neurotransmitters/hormones epinephrine and norepinephrine (the catecholamines). Epinephrine and norepinephrine increase heart rate, contract blood vessels, and dilate air passages. Increased adrenal glucocorticoids orchestrate, along with the catecholamines, a mobilization of lipid and glucose reserves combined with insulin antagonism to increase the available energy supply (Sapolsky et al. Reference Sapolsky, Michael Romero and Munck2000). Glucocorticoid receptor (GR) is a transcription factor involved in the regulation of the HPA stress response through a negative feedback relationship. It is coded by the GR gene; higher levels of GR transcription are associated with lower levels of stress responsivity, and lower levels of transcription are associated with higher levels of stress (Jacobson & Saplosky Reference Jacobson and Saplosky1991).
In a study by Weaver et al. (Reference Weaver, Cervoni, Champagne, D'Alessio, Sharma and Seckl2004), analysis of a specific region of the GR gene in hippocampal neurons, the exon 17 glucocorticoid receptor promoter (GR17), several weeks after the birth of pups raised by low- and high-LG mothers revealed significant differences in degree of methylation: High maternal LG was associated with decreased GR17 methylation in pups, corresponding to elevated levels of GR transcription in the hippocampus and decreased HPA stress response. Strikingly, just before birth at embryonic day 20 (E20), the hippocampal GR promoter in the fetuses of both high and low-LG mothers was unmethylated. One day after birth – postnatal day 1 (P1) – the exon 17 GR promoter was de novo methylated in both groups of pups to the same extent. By P6, however, the promoter was effectively demethylated in pups reared by high-, but not low-, LG mothers. These differences in methylation remained consistent through to adulthood and were associated with corresponding differences in stress reactivity. These findings suggest that the group difference in DNA methylation occurred as a function of maternal behavior over the first week of life.
In mammals, neuroendocrine regulation of maternal care is dependent on estrogen–oxytocin interactions involving hypothalamic estrogen receptors (Gimpl & Fahrenholz Reference Gimpl and Fahrenholz2001). In the rat, central oxytocin receptor levels are functionally linked to behavioral differences in maternal care. Dams who display high levels of maternal LG behavior exhibit elevated expression of the estrogen receptor α (ERα) in a region of the hypothalamus known as the medial preoptic area, whereas low-LG mothers exhibit decreased ERα expression (Champagne et al. Reference Champagne, Weaver, Sharma and Meaney2003b; Westberry et al. Reference Westberry, Trout and Wilson2010). These differences in turn are associated with differences in DNA methylation: High-LG behavior is associated with lower levels of methylation of the ERα gene, which is associated with higher levels of ERα transcription; low-LG behavior is associated with higher levels of ERα gene methylation and lower levels of gene transcription. Female offspring of high- and low-LG mothers exhibit, on average, the same methylation patterns, levels of gene transcription, and LG behavior as their mothers. Cross-fostering studies have associated these changes with both the rearing mother and potential prenatal environmental effects (Cameron et al. Reference Cameron, Shahrokh, Del Corpo, Dhir, Szyf, Champagne and Meaney2008).
As the authors of these studies emphasize, it is not their claim that behaviors such as high or low stress reactivity and maternal rearing behavior are in effect caused by changes in the methylation status of one or two genes. In studying the epigenetics of the maternal environment, Weaver et al. (Reference Weaver, Meaney and Szyf2006) identified more than 900 genes as being stably regulated by maternal care. Using microarrays to monitor changes in hippocampal expression of 31,099 unique mRNA transcripts, they identified 253 transcripts that were up-regulated (increased transcription) and 50 transcripts that were down-regulated (decreased transcription) in the offspring of high- versus low-LG mothers. Inasmuch as the authors only included genes with known biological function in their analysis, and only studied gene expression in the hippocampus, it is likely that a far greater number of genes are differentially transcribed.
Figure 2 illustrates some of the genetic and epigenetic differences between germ cells of the same individual and between the brains of MZ cotwins. Many of the same processes that lead to the genetic and epigenetic heterogeneity of intra-individual germ cells are depicted as contributing to the heterogeneity of MZ cotwins. This heterogeneity of MZ twins commences with the first division of the zygote and continues throughout the life course.
Overview of several sources of genetic and epigenetic heterogeneity between germ cells of the same two individuals and between monozygotic cotwins. Germ cells: Spermatocytes exhibit interindividual variation in L1-RNA, copy number variations (CNVs), epigenetic profiles, and microRNAs (miRNAs) (as well as smaller differences in aneuploidy). Oocytes exhibit interindividual variation in L1-RNA, CNVs, epigenetic profiles, and miRNAs, as well as significant differences in mitochondrial DNA (mtDNA) and aneuploidy. Environmental inputs influencing germ cell variation may include maternal stress, activity, diet, and environmental toxins. Prenatal environment: Splitting of the zygote into two (monozygotic twins): CNVs, aneuploidy, mtDNA partitioning and heteroplasmy, L1 retrotransposition, and the epigenome develop non-identically in the two twin embryos. Prenatal environmental inputs that may affect any of these phenomena in the prenatal environment may include maternal stress, anxiety, depression, diet, activity, (prenatal) environmental toxins, intrauterine position effects, and chorion effects. Postnatal environment: Intertwin discordance due to different epigenomes and differences in ongoing retrotransposition resulting from neurogenesis in the hippocampus. The epigenomes of the twins are depicted as being substantially different due to differences in life experiences and environments.

6. Implications for twin studies
Two preliminary terminological points: Henceforth, the phenomena that I have considered – retrotransposons, CNVs, mtDNA, aneuploidy, and epigenetics – will be referred to collectively by the term neogenome (neogenomics, neogenetics). The Genome (capital “G”) will be used to refer to both the various different mitochondrial and nuclear genomes that exist (in different forms and quantities) in different cells and tissues of the body. In this sense, it will be used analogously to the term epigenome: Persons do not have a single epigenome, but rather different epigenomes in different cells and tissues.
Let us now reconsider the assumptions identified as central to the twin study methodology:
HS1. 100% of the genes of MZ twins are identical; on average, 50% of the genes of DZ twins and singletons are identical; singletons possess ~50% of their parental DNA.
MZ twins, in addition to not possessing identical mtDNA, do not possess identical nDNA. Their Genomes differ in the polyploidy and heteroplasmy of their mtDNA, number and location of retrotransposition events, number and location of CNVs, replications and deletions of whole or partial chromosomes, and their epigenomes. To the extent that heritability estimates depend upon an assumption of enduring genetic identity, they will be unable to provide reliable estimates. If MZ twins are discordant for a trait that does have a heritable component to a greater extent than DZ twins, it is possible that such discordance is the result of genetic discordance. If MZ twins are concordant for this trait to a greater extent than DZ twins, this greater concordance cannot confidently be attributed to genetic concordance, since they may be genetically discordant. Furthermore, it is important to keep in mind that epigenetic discordance can be every bit as significant as genetic discordance in considering heritability. Suppose that cotwins A and B both possess the same allele of gene Z. If, as a result of different environmental exposures, Z is epigenetically silenced in A but not in B, the functional result can be equivalent to A not possessing allele Z at all.
HS2. The relationships of genetic identity in H1 never change (i.e., they are unvarying). That is, MZ twins, from conception to death, are always 100% genetically identical; DZ twins and singletons are always ~50% genetically identical, and singletons always possess ~50% of their parental DNA.
The presumed percentages of genetic identity between MZ twins, DZ twins, and non-twin siblings are not fixed, but are likely a moving target. One twin exercising and the other being sedentary can lead to differences not only in the number of new neurons formed in the hippocampus, but also in the genetic identity of those neurons due to differences in L1 retrotransposition. Hence, in longitudinal heritability studies, for example, presumed genetic identity will not be constant.
HS3. All causes of phenotypic variation that impact human behavior can be attributed to a latent genetic (G) or environmental (E) parameter, or the interaction of the two (G × E).
The neogenome constitutes a class of heritable agents that does not fall into either category.
All of this places in doubt the validity of heritability estimates in all but a small class of traits (i.e., so-called monogenic disorders; see sect. 8.1). What this does not call into doubt, however, is the following: MZ twins are significantly more genetically concordant than DZ twins (and are likely most concordant in relation to SNPs), and this greater genetic concordance plays an important role in a wide range of intertwin phenotypic concordances. As we shall see, however, this fact may end up being of limited practical application, at least within the framework of the conventional genetic paradigm.
6.1. Three objections
6.1.1. Objection 1: Biometric versus biomolecular genetics
“Defense by distinction” is an expression coined by Tabery (Reference Tabery2007; Tabery & Griffiths Reference Tabery, Griffiths, Hood, Halpern, Greenberg and Lerner2010) to characterize the manner in which defenders of the use of heritability estimates in behavior genetics have responded to objections by assorted developmentalists, including developmental psychologists, biologists, and embryologists. The distinction at issue could be characterized as that between a biometric analysis of the causes of phenotypic variation on the one hand and a biochemical analysis on the other. Let us call the former type of analysis biometric genetics, and the latter, biomolecular genetics. Biometric genetics is concerned with the question, how much do various causal agents (genes and environment) contribute to phenotypic variation? Biomolecular genetics is concerned with the question, how do various causal agents contribute to phenotypic variation (or phenotype in general); for example, what are the particular physical causal mechanisms or pathways – genetic→biochemical→neurological→behavioral – by which a particular genotype contributes to a particular phenotype (Tabery & Griffiths Reference Tabery, Griffiths, Hood, Halpern, Greenberg and Lerner2010)? This distinction forms the basis of the following objection: In considering the ways in which the neogenome affects phenotype, I have been focusing on biomolecular genetics, something appropriately outside the purview of biometric genetics. In effect, I have been confusing different levels of analysis (Bouchard & Segal Reference Bouchard, Segal and Wohlman1985; Plomin et al. Reference Plomin, DeFries and Loehlin1977; Scarr Reference Scarr1995).
Although employing statistical analysis, biometric genetics must make contact with the natural world at some point. If it did not, it would have nothing to tell us about genetics. The assumptions of heritability studies (HS) 1–3 are three points of contact. They are not assumptions about variance or the proper application of statistical methods; rather, they are contingent empirical assumptions that form the basis for the application of those methods. For example, the assumption that MZ twins are genetically identical (HS1) is an empirical claim about the natural world. The demonstration Footnote 9 of why HS1 is invalid involves a consideration of those natural phenomena – neogenomic processes – the existence of which entails the non-genetic identity of MZ twins. This demonstration must also show how the neogenome entails the non-genetic identity of MZ twins. The answer to this how question involves an elaboration of the causal networks of physical entities: MZ twins are not genetically identical because of the stochastic partitioning of mtDNA, retrotransposition in the germline and somatic cells, and so on. In other words, it requires a detailed consideration of biomolecular genetics.
The assumption that the causes of variation in behavior can be partitioned between the latent parameters, genes (G) and environment (E) (HS3) – while itself an assumption about variance, depends upon the following assumption: G and E are exhaustive categories, and from the standpoint of heritability estimates, everything in the natural world that is relevant to phenotypic variance (V P) can be partitioned into G, E, or G × E. Note that the assumption that causes of variance can be partitioned into the categories G, E, and G × E, does not entail that G be (Mendelian) genes and E the environment (everything else), but rather that they behave in the manner in which G and E are assumed to behave when estimating heritability. The problem is that the neogenome behaves like neither category.
Some germline neogenomic phenomena are transmitted according to the principles of Mendelian inheritance, for example, fixed germline CNVs, fixed retrotransposon insertions in the genome; others are not, for example, mtDNA, germline retrotransposition, intergenerationally transmitted epigenetic marks, and miRNAs. Variation in the latter cannot be assimilated to measurements of genetic variation (V G): The extent to which V P is due to variation in germline retrotransposition, or germline epigenetic variation, cannot be estimated according to the principles of Mendelian inheritance, or dominance-recessiveness, or allelic epistasis, or G×E interaction. Why not? How do we know this? Not as a matter of traditional quantitative genetics, which if anything has concealed the extent to which phenomena that behave like neither G nor E influence V P. Instead, we know this because of years of research in molecular genetics, biochemistry, and biology, and experiments with microorganisms, plants, and animals, that is, because of biomolecular genetics.
6.1.2. Objection 2: Underestimated heritability
If anything, genetic discordance between MZ twins entails that phenotype heritability has been underestimated (and therefore, current heritability estimates are conservative). This objection assumes what can be called the principle of causal ascription: Phenotypic concordances of MZ cotwins not ascribed to shared environment are ascribable to shared alleles. And this, in turn, depends on, first, the assumption that alleles that are the same will behave in the same manner, that is, assumption gene association studies (GAS) 2; and second, that all causes of phenotypic variation that impact human behavior can be partitioned between genetic variation (G) and environmental variation (E), or the interaction of the two (G × E), that is, assumption HS2. GAS2 will be considered later when we turn to gene association studies. As we have just seen, HS2 is invalid. It might be argued, however, that inasmuch as neogenetics is a cause of co-twin phenotypic discordance, HS2 is still relevant, that is, there are still two possible causes of phenotypic concordance: genes and environment.
The epigenome, however, can be a non-genomic cause of phenotypic concordance as well as phenotypic discordance, and studies have shown that discordance in methylation patterns is greater among DZ as opposed to MZ twin pairs (Fraga et al. Reference Fraga, Ballesta, Paz, Ropero and Setien2005; Kaminsky et al. Reference Kaminsky, Tang, Wang, Ptak, Oh, Wong, Feldcamp, Virtanen, Halfvarson, Tysk, McRae, Visscher, Montgomery, Gottesman, Martin and Petronis2009). Greater discordances in DZ twin methylation profiles may be due to their having originated from two distinct oocytes and two distinct sperm bearing different epigenetic markings. Studies have shown that in healthy human subjects, the majority of sperm cells of the same individual exhibit different DNA methylation profiles (Flanagan et al. Reference Flanagan, Popendikyte, Pozdniakovaite, Sobolev, Assadzadeh, Schumacher and Petronis2006). Male germ cells undergo unique and extensive epigenetic remodeling soon after their specification in embryonic stem cells and during the differentiation process to become mature spermatozoa (Puri et al. Reference Puri, Dhawan and Mishra2010; Seki et al. Reference Seki, Hayashi, Itoh, Mizugaki, Saitou and Matsui2005). There are several lines of evidence that the epigenetic markings in sperm can influence embryonic development. For example, analysis of DNA methylation in sperm has identified hypomethylated promoters that reveal patterns of methylation similar to those found in embryonic stem cells (Farthing et al. Reference Farthing, Ficz, Ng, Chan, Andrews, Dean and Reik2008; Fouse et al. Reference Fouse, Shen, Pellegrini, Cole, Meissner, Van Neste and Fan2008).
There is also growing evidence for the role of miRNA in sperm as an agent for the intergenerational transfer of phenotype (Brykczynska et al. Reference Brykczynska, Hisano, Erkek, Ramos, Oakeley, Roloff and Peters2010; Cuzin & Rassoulzadegan Reference Cuzin and Rassoulzadegan2010; Dadoune Reference Dadoune2009; Grandjean et al. Reference Grandjean, Gounon, Wagner, Martin, Wagner, Bernex and Rassoulzadegan2009). The development and function of the nervous system is orchestrated by a plethora of gene regulatory mechanisms, and miRNAs are emerging as important posttranscriptional regulators of gene expression in the brain (Gao Reference Gao2008; Krichevsky et al. Reference Krichevsky, King, Donahue, Khrapko and Kosik2003; Meza-Sosa et al. Reference Meza-Sosa, Valle-García, Pedraza-Alva and Pérez-Martínez2012; Nelson et al. Reference Nelson, Kiriakidou, Mourelatos, Tan, Jennings, Xie and Wang2010). Micro RNAs function at all stages of neuronal development, ranging from the initial specification of neuronal cell types to the formation and plasticity of synaptic connections between individual neurons. Moreover, links between miRNA dysfunction and neurological diseases are becoming more apparent (Kuss & Chen Reference Kuss and Chen2008; Meza-Sosa et al. Reference Meza-Sosa, Valle-García, Pedraza-Alva and Pérez-Martínez2012; Nelson et al. Reference Nelson, Wang and Rajeev2008). One of the most abundantly expressed miRNAs in the mammalian brain is the brain-specific miR-124 (Lagos-Quintana et al. Reference Lagos-Quintana, Rauhut, Yalcin, Meyer, Lendeckel and Tuschl2002). In the mouse, miR-124 acts as a switch to induce neuronal differentiation: Its expression increases sharply during brain development and is maintained in differentiated neurons (Cheng et al. Reference Cheng, Pastrana, Tavazoie and Doetsch2009; Krichevsky et al. Reference Krichevsky, King, Donahue, Khrapko and Kosik2003). Interestingly, the experimentally initiated expression of a miR-124 in non-neural cells results in a dramatic change of global gene transcribability toward a pattern usually found in neural cells (Lim et al. Reference Lim, Lau, Garrett-Engele, Grimson, Schelter, Castle and Johnson2005; Makeyev et al. Reference Makeyev, Zhang, Carrasco and Maniatis2007).
In sum, there is growing evidence that heritable epigenetic elements, which are not transmitted in Mendelian fashion, can be an important component of phenotypic variation. Because MZ twins are derived from a single egg and sperm cell, and because epigenetic elements can vary significantly between individual germ cells of the same individual, greater phenotypic concordances of MZ twins could also be caused, in part, by greater epigenetic concordance. This conclusion might appear, if anything, to support an argument for the underestimation of heritability, albeit a different kind of heritability not based exclusively upon traditional principles of Mendelian genetic inheritance. As we shall see, however, neogenetics also likely play an important role in translating commonly overlooked environmental concordances into phenotypic concordances.
6.1.3. Objection 3: Similar average effects
If the neogenome affects the phenotypes of MZ twins, DZ twins, and siblings to the same extent, then the result will be similar average phenotypic differences (or similarities). In other words, the presumed ratio of genetic identity between MZ and DZ twins (1 to 0.5) and between siblings (0.5 to 0.5) will be preserved, on average, over time.
First, given all that we now know about genomic variation in germ cells and throughout the developmental process and the life course, there is no reason to assume that these ratios are preserved because there is no reason to assume that they ever existed. Second, to the extent that neogenetic phenomena appear to occur at a high rate during embryogenesis, differences in the intrauterine environment could differentially impact how the neogenome influences the phenotypes of MZ versus DZ twins. This point will require a more extended defense and will provide the opportunity to consider important aspects of the interplay between genes, the epigenome, and the environment, as well as the validity of the equal environment assumption. Recall that the attribution of MZ phenotypic concordance to genes depends upon an assumption of (trait-specific) equal environments: The environments of MZ and DZ twins are not considered to vary in a manner that would result in greater phenotypic concordance among MZ twins. As we shall see, this assumption clearly does not hold prenatally.
7. The maternal environment (maternal effects I)
It is well established that the prenatal environment can have profound influences on development with long-term metabolic and neurological consequences (Coe et al. Reference Coe, Kramer, Czéh, Gould, Reeves, Kirschbaum and Fuchs2003; Champagne Reference Champagne2010a; Field et al. Reference Field, Diego, Hernandez-Reif, Vera, Gil, Schanberg and Gonzalez-Garcia2004a; Reference Field, Diego, Dieter, Hernandez-Reif, Schanberg, Kuhn and Bendell2004b; Gluckman & Hanson Reference Gluckman, Hanson, Gluckman and Hanson2006; Horton Reference Horton2005; Heijmans et al. Reference Heijmans, Tobi, Stein, Putter, Blauw and Susser2008; Huizink et al. Reference Huizink, de Medina, Mulder, Visser and Buitelaar2002; Kemme et al. Reference Kemme, Kaiser and Sachser2007; Langley-Evans et al. Reference Langley-Evans, Sherman, Welham, Nwagwu, Gardner and Jackson1999; Lui et al. Reference Lui, Wang, Tain, Chen, Chang, Lai and Huang2011; Maccari et al. Reference Maccari, Darnaudery, Morley-Fletcher, Zuena, Cinque and Van Reeth2003; Oberlander et al. Reference Oberlander, Weinberg, Papsdorf, Grunau, Misri and Devlin2008; O'Connor et al. Reference O'Connor, Ben-Shlomo, Heron, Golding, Adams and Glover2005; Painter et al. Reference Painter, Roseboom and Bleker2005; Parnpiansil et al. Reference Parnpiansil, Jutapakdeegul, Chentanez and Kotchabhakdi2003; Ryan & Vandenbergh Reference Ryan and Vandenbergh2002; Sandman et al. Reference Sandman, Davis, Buss and Glynn2011; Schneider et al. Reference Schneider, Roughton, Koehler and Lubach1999; Waterland & Michels Reference Waterland and Michels2007; Welberg & Seckl Reference Welberg and Seckl2001; Weinstock Reference Weinstock2008; Tamashiro & Moran Reference Tamashiro and Moran2010; Thompson Reference Thompson1957). The maternal environment begins prior to conception (during the formation of the oocyte), and the effects of this environment (maternal effects) begin at conception. Early embryonic development is not primarily controlled by the embryo's genome, but by the products of maternal genes deposited into the oocyte during oogenesis (Bettegowda et al. Reference Bettegowda, Lee and Smith2008; Johnson Reference Johnson and Everitt2007). Fundamental early decisions of zygotic cell fate are controlled by factors within the oocytic cytoplasm (and it is hard to imagine an environment of greater developmental importance than that which determines cellular fate). This early phase of development is referred to as maternal cytoplasmic control (Evsikov et al. Reference Evsikov, Graber, Michael Brockman, Hampl, Holbrook, Singh and Knowles2006).
The concept of developmental programming was put forward to explain the association between environmental challenge during pregnancy and later pathophysiology (Seckl Reference Seckl1998). During prenatal programming, environmental adversity is transmitted to the fetus and acts on specific tissues during critical developmental periods, changing their developmental trajectories (Harris & Seckl Reference Harris and Seckl2011). For example, epidemiological studies have shown that even moderately insufficient prenatal protein availability has detrimental effects on offspring brain development and subsequent behavior, cognition, and emotional reactivity (Almeida et al. Reference Almeida, Garcia and de Oliveira1993; Coupé et al. Reference Coupé, Dutriez-Casteloot, Breton, Lefèvre, Mairesse, Dickes-Coopman and Vieau2009; Galler et al. Reference Galler, Ramsey, Solimano, Lowell and Mason1983; Reyes-Castro et al. Reference Reyes-Castro, Rodriguez, Rodriguez-Gonzalez, Wimmer, McDonald, Larrea and Zambrano2011; Trzctńska et al. 1999; Watkins et al. Reference Watkins, Wilkins, Cunningham, Perry, Seet, Osmond and Fleming2008). In studies with baboons, Antonow-Schlorke et al. (Reference Antonow-Schlorke, Schwab, Cox, Li, Stuchlik, Witte and McDonald2011) reported that moderate maternal undernutrition in early pregnancy led to major disturbances in the architecture of the fetal subventricular zone, a brain region critical for the birth of nerve cells, along with delayed maturation of the brain cortical-neuronal network.
Maternal stress during pregnancy – prenatal stress – has been associated in animal studies with abnormally high levels of fetal blood cortisol, which alters the development of neurons in the brain leading to many of the same morphological effects and behaviors that are observed in suboptimal prenatal maternal nutrition (Brown Reference Brown2002; Brunton & Russell Reference Brunton and Russell2011; Lui et al. Reference Lui, Wang, Tain, Chen, Chang, Lai and Huang2011; Mueller & Bale Reference Mueller and Bale2008; Reyes-Castro et al. Reference Reyes-Castro, Rodriguez, Rodriguez-Gonzalez, Wimmer, McDonald, Larrea and Zambrano2011), including lifelong compromised neurodevelopment, enhanced stress reactivity, and increased fearful or anxious behavior. Coe et al. (Reference Coe, Kramer, Czéh, Gould, Reeves, Kirschbaum and Fuchs2003) evaluated the behavior of juvenile monkeys whose mothers were subjected to stress induction during pregnancy as compared to controls. To induce stress, the pregnant female was acutely disturbed 5 days per week by being moved to a darkened test room and intermittently aroused with an acoustical startle protocol. At ages 2–3 years old, juvenile monkeys from undisturbed, normal pregnancies (control) were compared with offspring from mothers who were disturbed for 6 weeks during the 24-week pregnancy, either early (days 50–92 postconception) or late (days 105–147) (these periods correspond to two distinct stages of cell growth and synaptogenesis in the fetal monkey cortex) (Bourgeois et al. Reference Bourgeois, Goldman-Rakic, Rakic and Gazzaniga2000). Offspring of both early and late prenatally disturbed pregnancies engaged in significantly lower levels of focused exploration (Fig. 3A), in line with prior research showing altered offspring emotionality after similar types of gestational manipulations in monkeys (Clarke & Schneider Reference Clarke and Schneider1993; Clarke et al. Reference Clarke, Wittwer, Abbott and Schneider1994; Schneider Reference Schneider1992). Monkeys generated from the early- and late-stress pregnancies had significantly higher cortisol levels than did controls (Fig. 3B), significantly reduced hippocampal neurogenesis (Fig. 3C), and significantly reduced hippocampal volume in both early (−12%) and late (−10%) stress protocols (Fig. 3D). In humans, prenatal stress has been associated with a wide array of adverse developmental outcomes and numerous cognitive and behavioral disorders including autism, depression, ADHD, schizophrenia, learning disabilities, and cognitive impairment (Beversdorf et al. Reference Beversdorf, Manning, Hillier, Anderson, Nordgren, Walters and Bauman2005; Brouwers et al. Reference Brouwers, van Baar and Pop2001; Charil et al. Reference Charil, Laplante, Vaillancourt and King2010; Grizenko et al. Reference Grizenko, Shayan, Polotskaia, Ter-Stepanian and Joober2008; Kinney et al. Reference Kinney, Munir, Crowley and Miller2008; Lazinski et al. Reference Lazinski, Shea and Steiner2008; Li et al. Reference Li, Olsen, Vestergaard and Obel2010; Raikkonen et al. 2011; Sandman et al. Reference Sandman, Davis, Buss and Glynn2011).
Differences in hippocampal volume and production of new neurons, serum cortisol, and exploratory behavior in monkeys from early- and late-stress pregnancies compared with controls. A. Exploratory behavior based on 12 observation sessions of 5 minutes each. Time spent in focused environmental exploration was significantly decreased in both the early- and late-stress monkeys as compared with control monkeys. B. Basal cortisol levels. C. Postnatal hippocampal neurogenesis. Cell proliferation in the dentate gyrus was significantly less in monkeys from both early- and late-stress pregnancie s. D. Hippocampal volume measurements. Postmortem hippocampal volumetry revealed that prenatal stress resulted in a significantly reduced hippocampal volume in both early- (−12%) and late-stress monkeys (−10%). Adapted from Coe et al. (Reference Coe, Kramer, Czéh, Gould, Reeves, Kirschbaum and Fuchs2003, pp. 1028–1029), with permission from Elsevier.

7.1. Neogenetics and prenatal stress
There is growing evidence that epigenetic programming by the prenatal maternal environment is an important mechanism in such phenotypic changes, involving processes similar to those implicated in postnatal epigenetic reprogramming by the maternal environment (Lillycrop & Burdge Reference Lillycrop and Burdge2011; Lillycrop et al. Reference Lillycrop, Phillips, Torrens, Hanson, Jackson and Burdge2008; Mesquita et al. Reference Mesquita, Wegerich, Patchev, Oliveira, Leão, Sousa and Almeida2009; Oberlander et al. Reference Oberlander, Weinberg, Papsdorf, Grunau, Misri and Devlin2008; Weaver et al. Reference Weaver, D'Alessio, Brown, Hellstrom, Dymov, Sharma and Meaney2007). In animal models, exposure to chronic variable stress during the first trimester is associated with hypermethylation of the GR promoter in the hypothalamus, reduced methylation of the CRF promoter in the amygdala, increased HPA reactivity as measured by stress-induced corticosterone levels, and increased stress associated behaviors and anhedonia (Mueller & Bale Reference Mueller and Bale2008). Prenatal stress has also been associated with significant changes in specific miRNAs in the brains of male offspring and reduced anogenital distance and adult testes weight, which is consistent with decreased testosterone exposure in utero (Morgan & Bale Reference Morgan and Bale2011). In a study of 82 pregnant women, Oberlander et al. (Reference Oberlander, Weinberg, Papsdorf, Grunau, Misri and Devlin2008) found increased levels of GR neonatal promoter methylation in infants born to depressed mothers and increased HPA stress reactivity at age 3 months in response to visual novel stimuli.
Offspring of female rats placed on a protein deficient diet throughout gestation exhibit elevated hepatic GR gene transcription associated with decreased DNA methylation, and decreased methylation and increased transcription of the peroxisomal proliferator-activated receptor (PPAR) gene, which codes for proteins that act as transcription factors (Mueller & Bale Reference Mueller and Bale2008; Oberlander et al. Reference Oberlander, Weinberg, Papsdorf, Grunau, Misri and Devlin2008), as well as epigenetic modifications to the renin-angiotensin system, a hormonal system that regulates blood pressure (Bogdarina et al. Reference Bogdarina, Welham, King, Burns and Clark2007; Goyal et al. Reference Goyal, Goyal, Leitzke, Gheorghe and Longo2010). These epigenetic changes have been associated with, among other phenotypes, offspring hypertension, insulin resistance, and obesity (Lillycrop & Burdge Reference Lillycrop and Burdge2011).
A well-known example of epigenetic/phenotypic reprogramming via maternal prenatal diet concerns Agouti mice. Mice carrying the dominant Agouti allele Avy develop a complex set of traits collectively referred to as the yellow obese or yellow mouse syndrome, characterized by yellow fur, obesity, insulin resistance, and hyperglycemia (Miltenberger et al. Reference Miltenberger, Mynatt, Wilkinson and Woychik1997). Inbred Avy rodents raised in identical environments nonetheless exhibit significant variation in the severity of their agouti symptoms due to epigenetic differences. Mice with high levels of CpG methylation of the Avy allele exhibit fewer and milder symptoms (a phenotype referred to as pseudoagouti): The higher methylation levels reduce the levels of transcription of the abnormal Avy allele and consequently, the severity of the symptoms (Jirtle & Skinner Reference Jirtle and Skinner2007). When pregnant agouti mice are fed a diet supplemented with methyl donors (folate, choline, and vitamin B12), the phenotype of the offspring is shifted away from yellow to pseudoagouti (Dolinoy Reference Dolinoy2008; Waterland & Jirtle Reference Waterland and Jirtle2003; Wolff et al. Reference Wolff, Kodell, Moore and Cooney1998). The methyl supplements that the pup receives from the mother in the womb reprogram the pup's epigenome, effectively silencing the abnormal Agouti gene. Agouti offspring whose mothers receive no methyl supplementation exhibit no corresponding phenotypic shift.
Other neogenetic phenomena are likely involved in maternal programming in stressful prenatal environments. For example, in rats, prenatal stress has been shown to be associated with an increase in oxidative damage to mtDNA in fetal neural stem cells, leading to changes in their differentiation into distinct classes of neurons in the hippocampus (Cai et al. Reference Cai, Zhu, Li, Fan, Jia, Bai and Liu2007; Song et al. Reference Song, Zheng, Li, Jia, Suo, Cai and Zhu2009). Physiological cell stressors and viral infection can demethylate Alu elements, enabling them to retrotranspose (Li et al. Reference Li, Spearow, Rubin and Schmid1999). Transposed elements can confer stress-inducibility to genes in their proximity (Naito et al. Reference Naito, Cho, Yang, Campbell, Yano, Okumoto and Wessler2006) or protect those genes against stress via a small-RNA-mediated mechanism (Hilbricht et al. Reference Hilbricht, Varotto, Sgaramella, Bartels, Salamini and Furini2008). L1 mRNA and proteins can accumulate in stress granules, providing a cellular reservoir that could be quickly activated in response to environmental stimuli (Krichevsky & Kosik Reference Krichevsky and Kosik2001). Moreover, androgenic steroids and steroid-like compounds involved in embryonic brain development, stress responses, and behavior can induce L1 activity (Zuloaga et al. Reference Zuloaga, Puts, Jordan and Breedlove2008). A burst of retrotransposon activity may aid in rapidly generating genetic diversity in changing environments and in mammalian brain development, and maternal stress could impact L1 mobility in newly born neurons during embryonic development (Faulkner Reference Faulkner2011; Marchetto et al. Reference Marchetto, Gage, Muotri and Ulrich2010; Singer et al. Reference Singer, McConnell, Marchetto, Coufal and Gage2010). Hence, maternal diet and stress could affect the activation of transposable elements via reprogramming of the embryonic epigenome.
7.2. Twins and the prenatal environment
7.2.1. Twins versus singletons
The prenatal environment of twins is on average more stressful than that of singletons. Twins have a death rate four times higher than singletons, and this figure is six times higher for triplets (Sutcliffe & Derom Reference Sutcliffe and Derom2006). Twins are seven times more likely than singletons to die within a month of birth (Weber & Sebire Reference Weber and Sebire2010). The main reason for this elevated perinatal mortality is preterm and very preterm birth, resulting in low and very low birth weight. In singletons, twins, and triplets the frequency of low birth weight (<2,500 g) is 3.9%, 42.7%, and 64%; and for very low birth weight (<1,500 g), it is 0.7%, 7%, and 27% (Gielen et al. Reference Gielen, van Beijsterveldt, Derom, Vlietinck, Nijhuis, Zeegers and Boomsma2010). In singletons, the risk of childhood and adult disease is inversely related to birth weight across the birth weight spectrum (Larios-Del Toro et al. Reference Larios-Del Toro, Vasquez-Garibay, Gonzalez-Ojeda, Ramirez-Valdivia, Troyo-Sanroman and Carmona-Flores2011; Richmond Reference Richmond1990), and extremely low birth weight is associated with poorer neurobehavioral and cognitive outcomes (Aarnoudse-Moens et al. Reference Aarnoudse-Moens, Weisglas-Kuperus, van Goudoever and Oosterlaan2009; Anderson & Doyle Reference Anderson and Doyle2003; Reference Anderson and Doyle2004; Orchinik et al. Reference Orchinik, Taylor, Espy, Minich, Klein, Sheffield and Hack2011; Taylor et al. Reference Taylor, Espy and Anderson2009). While low birth weight is a consequence of prematurity, twins also exhibit lower gestational birth weight in the womb relative to singletons beginning in the third trimester (Blickstein et al. Reference Blickstein, Goldman and Mazkereth2000). One likely cause of lower gestational weight is adaptive growth restriction, in which the restricted in utero environment results in the down-regulation of the growth of multiple fetuses early in gestation (Maulik Reference Maulik2006; Siddiqui & McEwan Reference Siddiqui and McEwan2007).
Premature birth is associated with maternal stress (Dole et al. Reference Dole, Savitz, Hertz-Picciotto, Siega-Riz, McMahon and Buekens2003; Dunkel Schetter Reference Dunkel Schetter2011; Roy-Matton et al. Reference Roy-Matton, Moutquin, Brown, Carrier and Bell2011), as is gestational age at birth (Wadhwa et al. Reference Wadhwa, Sandman, Porto, Dunkel Schetter and Garite1993). One reason for the higher level of prematurity among twins is the effect that a twin pregnancy has on the mother; in other words, a twin pregnancy is a cause of maternal physiological stress. Women pregnant with twins are 2.5 times more likely to develop preeclampsia (Sibai et al. Reference Sibai, Hauth, Caritis, Lindheimer, MacPherson, Klebanoff and McNellis2000), a condition characterized by high blood pressure and protein excretion in the urine (proteinuria) that can lead to premature separation of the placenta from the uterus (placental abruption). Even in normal twin pregnancies without preeclampsia, the rate of maternal protein excretion is significantly elevated relative to singleton pregnancies, which translates into twins having significantly elevated levels of protein excretion relative to singletons (Smith et al. Reference Smith, Lyons and McElrath2010). Mothers in twin pregnancies are also twice as likely to develop gestational diabetes, which is associated with increased risk of newborn death and stillbirth and an increased risk of offspring developing diabetes later in life. In the broadest sense, a congenital anomaly is an abnormality present at or before birth, usually as a result of faulty development, infection, or heredity. In a study of 2,329 twin pregnancies (4,658 twins) and 147,655 singletons delivered in the Northeast of England during 1998–2002, Glinianaia et al. (Reference Glinianaia, Rankin and Wright2008) reported that rates of congenital anomalies for twins were 405.8 per 10,000 twins versus 238.2 per 10,000 for singletons. The most common types of congenital anomalies were cardiovascular anomalies (28.0%), anomalies of the central nervous system (13.2%), genito-urinary system (13.7%), chromosomal anomalies (11.5%), musculoskeletal (10.4%), and others (17.0%). Twins showed higher rates of all major types of congenital anomalies than singletons except for chromosomal anomalies.
The principal neurological disability seen in twins is cerebral palsy (Ingram Cooke Reference Ingram Cooke2010). Petterson et al. (Reference Petterson, Nelson, Watson and Stanley1993) reported cerebral palsy rates from the 1980s in Western Australia: Triplets had a rate of 28 per 1,000 live births; twins, 7 per 1,000; and singletons, 1.6 per 1,000. The risk for cerebral palsy was similar at low gestational ages but became higher for multiples as gestation approached term when rates were 4 per 1,000 for twins and 1.1 per 1,000 for singletons. When one twin died in utero, the cerebral palsy rate was 96 per 1,000 compared to 12 per 1,000 when both were born alive. Similarly, Scher et al. (Reference Scher, Petterson, Blair, Ellenberg, Grether, Haan and Nelson2002) studied data from the 1980s on more than one million births in the United States and Australia, of whom more than 25,000 were twins. Twins had a fivefold risk of fetal death, sevenfold risk of neonatal death, and fourfold risk of cerebral palsy compared with singletons.
Twins are not only at a greater risk for congenital disorders, but also for language delays. For example, since early last century, numerous studies have documented slower rates of language development in twins compared to singletons (Conway et al. Reference Conway, Lytton and Pysh1980; Day Reference Day1932; Hay et al. Reference Hay, Prior, Collett and Williams1987; McEvoy & Dodd Reference McEvoy and Dodd1992; Rutter et al. Reference Rutter, Thorpe, Greenwood, Northstone and Golding2003; Thorpe Reference Thorpe2006). On average, twins score lower than singletons on a range of tests of verbal competence, and this effect is more evident in male twins. The finding of language delay is significant behaviorally inasmuch as studies of singletons indicate that language delay has long-term consequences for children's academic attainment and emotional well-being (Rutter & Mawhood Reference Rutter, Mawhood, Rutter and Caesar1991).
7.2.2. Monozygotic versus dizygotic twins
Are MZ and DZ twins exposed, on average, to the same levels of prenatal stress? Clearly, they are not, and much of this difference is due to chorionicity. Monozygotic twinning occurs when a single fertilized egg gives rise to two separate embryos (the cause is unknown). If twinning takes place prior to the first 4 days after conception, two separate placentas and chorions, the outermost of two fetal membranes that surround the embryo (the amnion being the innermost), are formed, one for each embryo. Such twins are called dichorionic (DC) MZ twins and account for about one-third of all MZ twins.Footnote 10 If twinning occurs after this, a single placenta will develop. This single monochorionic (MC) placenta serves both embryos, and in 90% of cases, contains a network of blood vessels (placental anastomoses) that connect both twins, enabling ~1% of the total twin blood volume to be exchanged daily (Umur et al. Reference Umur, Van Gemert and Ross2001). About two-thirds of all MZ twins are MC. If twinning occurs after the eighth day of conception, the MC–MZ pair will also share a common amniotic sac in addition to a common placenta and chorion. About 5% of MZ twins are monochorinoic (MC) and monoamniotic (Machin & Keith Reference Machin and Keith1999). Dizygotic twins, by contrast, are usually DC and diamniotic.Footnote 11 The varying patterns of blood vessels that connect MC twins commonly result in their receiving an unequal in utero blood supply resulting in unequal growth rates: 22% of MC twin pairs exhibit birth weight discordances greater than or equal to 20% total body mass (Senoo et al. Reference Senoo, Okamura, Murotsuki, Yaegashi, Uehara and Yajima2000), and 10–15% of MC twins experience twin-twin transfusion syndrome (TTTS), which occurs as the result of a net transfer of blood from a donor twin to a recipient twin.
As Blickstein (Reference Blickstein2006, p. 235) notes of monochorionic twin pregnancies: “It is well accepted that monochorionic twin gestations – a subset of the monozygotic twinning phenomenon – carry a significantly higher perinatal risk compared with dichorionic ones.” Chorionicity is one of the main predictors of perinatal mortality in twins: Monochorionic twins have a sixfold loss rate before 24 weeks gestation and two- to threefold increased risk of stillbirth and early neonatal deaths when compared with DC twins (Gibson & Cameron Reference Gibson and Cameron2008; Glinianaia et al. Reference Glinianaia, Obeysekera, Sturgiss and Bell2011; Sebire et al. Reference Sebire, Snijders, Hughes, Sepulveda and Nicolaides1997). In a study of 2,329 twin births, Glinianaia et al. (Reference Glinianaia, Rankin and Wright2008) reported that the prevalence of congenital anomalies in MC twins (633.6 per 10,000) was nearly twice that in DC twins (343.7 per 10,000). Preterm delivery at less than 32 weeks occurs in 1% of singleton pregnancies, 5% of DC–MZ twins, and 10% of MC–MZ twins (Gibson & Cameron Reference Gibson and Cameron2008). Fetal growth restriction complicates approximately 5% of all singleton pregnancies, 20% of DC–MZ pregnancies, and 30% of MC–MZ pregnancies. Ultrasonographic brain scans have indicated that MC twins have a sevenfold higher risk than DC twins of developing cerebral white matter lesions, which have been associated with increased risk of cerebral palsy, early cognitive impairment, and Alzheimer's disease (Adegbite et al. Reference Adegbite, Castille, Ward and Bajoria2005). In regard to TTTS, a study by Dickinson et al. (Reference Dickinson, Duncombe, Evans, French and Hagan2005), reported that the mean IQ score in TTTS twins born before 33 weeks, both donor and recipient, was 8 points lower compared with a non-TTTS comparison cohort.
Awareness of all of the risks associated with MC pregnancies is an established part of medical practice:
Monochorionic twin pregnancies are at high risk of adverse foetal and neonatal outcomes. The chorionicity of a twin pregnancy can be diagnosed with a high degree of accuracy by ultrasound in the first and early second trimesters of pregnancy. Failure to diagnose monochorionic twin pregnancy is substandard care, as identification is required to plan intensive surveillance for complications throughout pregnancy. (Gibson & Cameron Reference Gibson and Cameron2008, p. 572)
These are unambiguous indications that on average, the prenatal MZ twin environment is significantly more stressful than that of DZ twins, in large part because of differences in chorionicity (Acosta-Rojas et al. Reference Acosta-Rojas, Becker, Munoz-Abellana, Ruiz, Carreras and Gratacos2007; Adegbite et al. Reference Adegbite, Castille, Ward and Bajoria2004; Carroll et al. Reference Carroll, Tyfield, Reeve, Porter, Soothill and Kyle2005; Gibson & Cameron Reference Gibson and Cameron2008; Hack et al. Reference Hack, Derks, Elias, Franx, Roos, Voerman and Visser2008). To the extent that the prenatal environment of MC–MZ twins results in unequal birth weight, it is a clear cause of phenotypic discordance. The effects of the maternal environment, however, cannot simply be classified as discordance producing (i.e., non-shared; Bouchard & McGue Reference Bouchard and McGue2003). This is because the prenatal environment can be a cause of phenotypic concordance for MZ twins inasmuch as they are more likely to be exposed to the forms of prenatal programming – and to exhibit the corresponding phenotypes – that are associated with higher levels of prenatal stress. Furthermore, neogenetics appears to play a significant role in prenatal programming.
Let us recall objection 3 in section 6.1.3 – similar average effects: If the neogenome affects MZ twins, DZ twins, and siblings to the same extent, then the result will be similar average neogenomic differences (or average similarities), which would effectively preserve the presumed ratios of genetic identity. If the prenatal MZ twin environment is on average more stressful than that of DZ twins, and the DZ twin environment more stressful than that of singletons, and if neogenomics plays a role in translating these environmental differences into phenotypic variation, we would not expect neogenome-induced phenotypic differences (or similarities) to be the same among MZ twins, DZ twins, and singletons. In this regard, consider the following studies.
-
1. In a study of 2,329 twin births (mentioned earlier), Glinianaia et al. (Reference Glinianaia, Rankin and Wright2008) reported that the prevalence of congenital anomalies was nearly twice as great for MC (633.6 per 10,000) as DC (343.7 per 10,000) twins, while the rate for singletons was 283.2 per 10,000.
-
2. In a recent study, characterized as “the largest population based study of autism that used contemporary standards for the diagnosis of autism,” Hallmayer et al. (Reference Hallmayer, Cleveland, Torres, Phillips, Cohen, Torigoe and Risch2011) reported that when one MZ twin develops autism, the chance of the other twin developing the disorder is 70%. They also found a sizable 35% overlap among DZ twins, which is notably higher than the 3–14% overlap between singletons.Footnote 12 According to Hallmayer et al. (Reference Hallmayer, Cleveland, Torres, Phillips, Cohen, Torigoe and Risch2011, p. E7).
Our study provides evidence that the rate of concordance in dizygotic twins may have been seriously underestimated in previous studies and the influence of genetic factors on the susceptibility to develop autism, overestimated.… Because the prenatal environment and early postnatal environment are shared between twin individuals, we hypothesize that at least some of the environmental factors impacting susceptibility to autism exert their effect during this critical period of life.
-
3. Knickmeyer et al. (Reference Knickmeyer, Kang, Woolson, Smith, Hamer, Lin and Gilmore2011) compared brain volumes and the relationship of brain volumes to gestational age in 136 singleton and 154 twin pairs neonates (82 DZ, 72 MZ) using high-resolution magnetic resonance imaging (MRI), and examined differences between the three groups, adjusting for gestational age at birth. Singletons had significantly larger estimated gray matter volumes (total, cortical, and parietal) at birth than DZ twins (p < 0.001, 7–9% difference), who had significantly larger gray matter volumes than MZ twins (p < 0.001, 20–25% difference). At the same time, total gray matter and cortical gray matter increased at a greater rate in MZ than DZ twins, and parietal gray matter increased at a greater rate in MZ twins than in DZ twins or singletons. The authors hypothesized that gray matter development is delayed in utero in MZ twins and that they experience a period of antenatal catch-up. This is consistent with postnatal correction for a process of prenatal adaptive growth restriction.
These studies point to the significance of variations in the prenatal environment – and prenatal neogenomics – in influencing twin phenotypes. While it is always possible that greater concordance rates among MZ versus DZ twins and singletons are due to greater genetic concordance, it is also possible that they are due to greater prenatal environmental concordance. This could account, at least in part, for the pattern that appears in several studies: MZ twin concordance>DZ twin concordance>singleton concordance.
There are three further implications of this that are relevant for heritability studies. First, to the extent that both MZ and DZ twins experience prenatal environments that are more stressful than that of singletons, the generalizability of twin studies is called into question. Second, to the extent that the prenatal environment of MZ twins (and MC–MZ twins in particular) can be significantly more stressful than that of DZ twins, and hence a cause of greater stress-related phenotypic concordance, the equal environment assumption will not hold in relation to behavioral phenotypes potentially associated with prenatal stress. Third, studies of twins raised apart are intended to eliminate possible confounding effects due to a shared environment,Footnote 13 but cannot eliminate the potential confounding effects of a shared prenatal environment (Table 2). This applies to singletons as well, inasmuch as adopted singletons have still experienced their biological mothers' prenatal environment.
Comparison between rat and human age

8. Implications for gene association studies
Let us reconsider three assumptions of association studies (AS) 1–3:
AS1. Persons have identical DNA in all of the cells and tissues of their bodies (with the exception of germ cells and certain cells in the immune system).
Persons do not have identical DNA in all the cells and tissues of their bodies due to widespread somatic mosaicism.
AS2. The presence of a particular gene (polymorphism or mutation) entails that it is turned on – that is, it is capable of being transcribed in a manner that is associated with that polymorphism or mutation. Hence, the same two polymorphisms in any given two individuals will have the same capacity to be transcribed in the same manner (i.e., they will both be turned on).
The presence of a particular allele does not entail that it is capable of being transcribed in the manner associated with that allele, because it may be epigenetically silenced. In a characteristic candidate-gene association study, for example, allelic variants of a given gene are associated with variations in phenotype. The hypothesized causal link between the allele and phenotype is often expressed in terms of allelic differences in transcriptional efficiency or expression. For example, certain alleles of the monoamine oxidase A gene (MAOA) are deemed less transcriptionally efficient than others, with the more transcriptionally efficient alleles designated as high and the less transcriptionally efficient as low (Sabol et al. Reference Sabol, Hu and Hamer1998), and have been associated with a host of behavioral (and non-behavioral) phenotypes (Caspi et al. Reference Caspi, McClay, Moffitt, Mill, Martin, Craig and Poulton2002; Filonzi et al. Reference Filonzi, Magnani, Lavezzi, Rindi, Parmigiani, Bevilacqua and Marzano2009; Frydman et al. Reference Frydman, Camerer, Bossaerts and Rangel2011; Fuemmeler et al. Reference Fuemmeler, Agurs-Collins, McClernon, Kollins, Kail, Bergen and Ashley-Koch2008; Tu et al. Reference Tu, Ko, Wang, Lee, Lea, Chiang and Ko2010).Footnote 14 Such studies depend upon the assumption that the high and low alleles of all who possess them are turned on, that is, they are capable of being transcribed in the manner associated with those alleles (or in a manner associated with those alleles interacting with a particular environment [G × E]).
Suppose that persons A and B both possess the same allele of gene Z. However, due to differing early environmental effects (perhaps perinatal maternal effects), Z is hypermethylated (turned off) in person A and hypomethylated (readily transcribed) in person B. This could be functionally equivalent to A not possessing Z. The effects of methylation, however, are not simply binary (i.e., on/off). It is possible to talk about degrees of transcribability, with higher methylation being associated with lower transcribability and lower methylation with higher transcribability. Suppose that gene Z exhibits three allelic variations: long Z, associated with highly efficient transcription; intermediate Z, associated with intermediate transcription; and short Z, associated with inefficient transcription. Persons A and B both possess the intermediate allele of gene Z. However, due to differing environmental effects, intermediate Z is hypomethylated (higher transcribability) in A and hypermethylated (lower transcribability) in B. This could be functionally equivalent to A possessing the allele long Z and B possessing short Z.
AS3. Specific genes (polymorphisms/mutations) are coded for the production of specific proteins.
Specific alleles are not coded for the production of specific proteins or RNA molecules for a reason that has not yet been examined. The discovery that the human genome contains ~25–30,000 genes, as compared to, for example, greater than 32,000 genes in maize, that is, corn (Schnable et al. Reference Schnable, Ware, Fulton, Stein, Wei, Pasternak and Wilson2009), necessitated a rethinking of the assumption that for every protein there is a specific gene and each gene contains the instructions for making just one protein, inasmuch as there are likely over one million proteins in the human organism (Bernot Reference Bernot2004).
As noted earlier (sect. 4.1), human genes typically contain several DNA sequences that code for amino acids, known as exons, interspersed with several introns, non-coding regions. In gene transcription, the intron and exons are first copied to create what is known as pre-messenger RNA (pre-mRNA). Alternative splicing occurs when pre-mRNA exons are combined in various ways to form different proteins, called isoforms (Chen & Manley Reference Chen and Manley2009; Nilsen & Graveley Reference Nilsen and Graveley2010). For example, the human fibronectin gene is translated into pre-mRNA that can be alternatively spliced into mRNAs that specify more than 20 different fibronectin proteins, each having different phenotypic characteristics, functions, and locations (Kornblihtt et al. Reference Kornblihtt, Pesce, Alonso, Cramer, Srebrow, Werbajh and Muro1996). Hence, a single gene can code for multiple proteins, something that is estimated to occur in 90% of all human genes (Yeo et al. Reference Yeo, Holste, Kreiman and Burge2004). The spatial and temporal control of alternative splicing is a major mechanism used to generate protein diversity in the brain and is regulated, in part, by miRNAs during neuronal development (Grabowski Reference Grabowski2011; Makeyev et al. Reference Makeyev, Zhang, Carrasco and Maniatis2007), as well as by histone modification (Luco et al. Reference Luco, Pan, Tominaga, Blencowe, Pereira-Smith and Misteli2010). Activity-dependent changes in alternative splicing have been noted in the rat brain, “indicating that the coordinated change of alternative splicing might contribute to the molecular plasticity in the brain” (Daoud et al. Reference Daoud, Da Penha Berzaghi, Siedler, Hubener and Stamm1999, p. 788).
8.1. Multifactorialism
Most human traits with a genetic component are multifactorial (or complex), that is, they are polygenic, involving the biochemical products of hundreds and even thousands of genes (see below) interacting with each other and the environment in complex ways. Widespread epistasis, pleiotropy, the epigenome, retrotransposons, CNVs, aneuploidy, mtDNA, and alternative splicing render such traits even more complex. Consider the following:
-
1. Height is a highly heritable trait: 80% of the variation in height in a given population is attributable to genetic factors. A new, exceptionally large study involving full genome scans (genome-wide association studies, or GWAS) of more than 180,000 individuals identified 180 genomic regions that influence adult height (Lango et al. Reference Lango, Hana Estrada, Lettre, Berndt, Weedon, Rivadeneira and Hirschhorn2010). The variants on these 180 genes, however, explain only 10% of the heritable phenotypic variation in height in a given population. Current estimates are that anywhere from 1,485 to more than 7,244 polymorphisms are necessary to explain 45% of the variance of height.Footnote 15
-
2. The largest genetic effects that have been identified for common psychological disorders via GWAS account, all together, for less than 1% of genetic variance (Franke et al. Reference Franke, Neale and Faraone2009; Plomin & Davis Reference Plomin and Davis2009). As Plomin and Davis (Reference Plomin and Davis2009, p. 63) note:
GWA studies suggest that for most complex traits and common disorders genetic effects are much smaller than previously considered.… This finding [of small genetic effects] implies that hundreds of genes are responsible for the heritability of behavioural problems in childhood, and that it will be difficult to identify these genes of small effect.
-
3. Researchers performed complete genome-wide gene expression and GWA scans of 40 lines of inbred Drosophila melanogaster (fruit flies), and their analysis implicated at least 266 unique candidate genes associated with natural variation in aggressive behavior (Edwards et al. Reference Edwards, Rollmann, Morgan and Mackay2006; Reference Edwards, Ayroles, Stone, Carbone, Lyman and Mackay2009a; Reference Edwards, Zwarts, Yamamoto, Callaerts and Mackay2009b). The candidate genes were involved in a broad spectrum of biological processes, including vision, olfaction, learning and memory, and the development and function of the nervous system, as well as basic cellular processes including transcription, protein modification, and mitosis, indicating that the single alleles involved in aggression have pleiotropic effects on multiple traits. Furthermore, the findings are consistent with extensive epistasis. At the same time, the heritability of aggressive behavior in Drosophila is relatively low (~0.1). Expressing the genetic and environmental variances of aggressive behavior as genetic and environmental coefficients of variation (CV G and CV E , respectively), they found that CV G = 23.2 and CV E = 71.9. Thus, the low heritability is not due to a lack of segregating genetic variation, which is abundant, but to a high level of environmental variance.
Given this, we would not expect to find among common gene variants single gene effects that confer a sufficiently high odds ratio to be predictive of a phenotype: If a common polymorphism conferred a high odds ratio, it would have to be the principal contributor to the overall prevalence of the phenotype (Galvan et al. Reference Galvan, Ioannidis and Dragani2010; Hirschhorn et al. Reference Hirschhorn, Lohmueller, Byrne and Hirschhorn2002; Ioannidis et al. Reference Ioannidis, Trikalinos and Khoury2006; Zondervan & Cardon Reference Zondervan and Cardon2004). The discovery that many genes of small effect size contribute to traits known to be highly heritable (such as height) helps toward explaining the so-called missing heritability problem (Manolio et al. Reference Manolio, Collins, Cox, Goldstein, Hindorff, Hunter, McCarthy, Ramos, Cardon, Chakravarti, Cho, Guttmacher, Kong, Kruglyak, Mardis, Rotimi, Slatkin, Valle, Whittemore, Boehnke, Clark, Eichler, Gibson, Haines, Mackay, McCarroll and Visscher2009). This refers to the fact that despite thousands of genome-wide and candidate-gene association studies, very few genes have been identified that are reliably (i.e., consistently) associated with complex phenotypes (Need & Goldstein Reference Need and Goldstein2010). In the words of Conrad et al. (Reference Conrad, Pinto, Redon, Feuk, Gokcumen, Zhang and Hurles2010), to date, GWAS have left a “heritability void.” Retrotransposition, CNVs, aneuploidy, mtDNA, and the epigenome, doubtless all contribute to missing heritability (Slatkin Reference Slatkin2009). It is unlikely however, that methylation on a single gene, or a single CNV, or a single retrotransposon insertion will be the principal genetic contributor to a complex trait any more than an SNP.
These phenomena are also likely part of the answer to another absence of correlation, namely, that between human phenotypic complexity and genome size (e.g., humans possess fewer genes than corn). This lack of correlation is referred to as the C-paradox (the C-value refers to the amount of DNA contained in a gamete, or one-half the amount of DNA contained in the nucleus of a somatic cell) (Biemont & Vieira Reference Biemont and Vieira2006). Most of the differences in genome size between species reside in the non-coding parts (such as the 45% of the human genome that is composed of transposable elements). For example, the human genome is composed of 98% non-coding regions of DNA (International Human Genome Sequencing Consortium 2004), whereas the fruit fly, Drosophila melanogaster, has a very compact genome with fewer sequences of this kind (Clark et al. Reference Clark, Eisen, Smith, Bergman, Oliver, Markow and MacCallum2007; Dowsett & Young Reference Dowsett and Young1982; Hoskins et al. Reference Hoskins, Smith, Carlson, Bernardo Carvalho, Halpern, Kaminker and Karpen2002; Rebollo et al. Reference Rebollo, Horard, Hubert and Vieira2010). This is highly suggestive, especially if we consider that two major classes of retrotransposons are primate specific (see sect. 4.1).
8.1.1. Monogenics
There are, of course, exceptions to what might be called the non-predictiveness of SNPs. The most obvious example concerns not SNPs, but mutations associated with so-called monogenic disorders. However, even in completely penetrant monogenic disorders, the poster child for Mendelian inheritance, things are turning out to be a lot more complicated than once thought. One reason concerns the possibility of many different allelic mutations on the same gene locus being associated with the disorder, for example, more than 1,400 different mutations on the cystic fibrosis transmembrane conductance regulator (CFTR) gene have been identified thus far that can cause cystic fibrosis, a recessive disorder, and different mutations have been associated with differences in disease phenotype (Bobadilla et al. Reference Bobadilla, Macek, Fine and Farrell2002). More important, even when two individuals have the same mutation for the same completely penetrant monogenic disorder, it is often extremely difficult to predict phenotype on the basis of genotype alone. Consider the following two quotes from researchers in this field:
An African American male infant with sickle cell disease has a devastating stroke; an African American soldier is surprised when he is informed that he has sickle cell disease. They are both homozygous for the same mutation. An Ashkenazi Jewish woman with Gaucher disease has a huge spleen and severe thrombocytopenia; her older brother, homozygous for the same … mutation, is found on routine examination to have a barely palpable spleen tip.… Such siblings must surely be carrying the same 2 disease-producing alleles. With the advent of sequence analysis of genes, the great extent of phenotype variation in patients with the same genotype has come to be more fully appreciated, but understanding of why it occurs continues to be meager. (Beutler Reference Beutler2001, p. 2597)
The dogma in molecular genetics until the 1990s was that genotype would predict phenotype. We thought that once we cloned and characterized the gene, then the nature of the mutation in the gene would specify the individual's phenotype.… This concept celebrated reductionism. However, nature had not informed the patients and their biology of this belief system. Not only could we not predict phenotype for genotype for GK [glycerolkinease deficiency] and AHC [congenital adrenal hypoplasia], similar observations were being made by others for many rare [monogenic] genetic disorders. (McCabe & McCabe Reference McCabe and McCabe2006, p. 160)
What this indicates is that the phenotypes of single gene disorders are in fact complex traits (Nagel Reference Nagel2005; Weatherall Reference Weatherall2000), influenced by multiple genetic, epigenetic, and environmental factors:
One promise of molecular genetics for many of us was that a detailed knowledge of mutant alleles would permit accurate prediction of prognosis and better selection of therapeutic strategies for Mendelian disorders. This presumed predictive promise was naive and was based on a reductionist view of genotype-phenotype correlations, i.e., that a refined and specific knowledge of a mutation's impact on protein structure and function would permit extrapolation to the phenotype of the intact organism. The reality of molecular genetics, however, is that for many diseases only a subset of mutations reliably predicts phenotype. This lack of genotype-phenotype correlation for many Mendelian disorders shows us that the clinical phenotypes of “simple” Mendelian disorders are complex traits. (Dipple et al. Reference Dipple, Phelan and McCabe2001, p. 45)
Nonetheless, for the most part, completely penetrant monogenic disorders entail that two individuals with the same mutation will have the disease, even if they exhibit significant phenotypic differences.
There are exceptions to the non-predictiveness of SNPs in relation to polygenic traits, in the sense that the association between a polymorphism and a complex trait appears to be reliably reproduced, and the association is of such a magnitude that the polymorphism can be deemed a risk factor. The most reliably reproduced are: The E4 variant of the apolipoprotein E gene, ApoE, which greatly increases the risk of Alzheimer's disease; the association of an amino acid substitution in the complement factor H gene, CFH, with age-related macular degeneration; and a variant in the LOXL1 gene with exfoliation glaucoma, a common form of age-related blindness (in the case of the latter two, however, the SNPs are so prevalent in the population that they lack predictive value) (Need & Goldstein Reference Need and Goldstein2010). Why these are exceptions is not entirely clear, although it may be an indication that they are oligogenic disorders involving polymorphisms on a small number of genes and hence are more akin to monogenic disorders than to most human traits. As such, they are exceptions that prove the rule.
9. Phenotypic plasticity
The inability to predict complex phenotypes on the basis of genotype alone is precisely what we would expect in an organism possessed of any degree of phenotypic plasticity. Phenotypic plasticity can be defined broadly as the ability of an organism to change phenotype in response to its environment (Pigliucci et al. Reference Pigliucci, Murren and Schlichting2006). This includes the possibility of modifying developmental trajectories in response to specific environmental cues, and the ability of an individual organism to change its phenotypic state or activity in response to variations in environmental conditions (Garland & Kelly Reference Garland and Kelly2006). Modern evolutionary biology reflects the idea that adaptation is not limited to the process of natural selection (i.e., adaptation at the level of the species), but includes adaptation of the individual organism to its ecological niche. Offspring do not inherit simply genes from their parents, but also an environment (Gluckman et al. Reference Gluckman, Hanson, Bateson, Beedle, Law, Bhutta and West-Eberhard2009; West-Eberhard Reference West-Eberhard2003; West & King Reference West and King1987). Developmental plasticity evolved because it is adaptive, promoting Darwinian fitness by enhancement of survival and reproductive success by using environmental cues to optimize the life-course strategy. As Pigliucci (Reference Pigliucci, Pigliucci and Muller2010, p. 357) notes, “Phenotypic plasticity is now the paradigmatic way of thinking about gene-environment interactions (the so-called nature–nurture problem) and one of the best studied biological phenomena in the evolutionary literature, with knowledge steadily advancing about its genetic molecular underpinnings (Schlichting & Smith Reference Schlichting and Smith2002; Suzuki & Nijhout Reference Suzuki and Nijhout2008), ecological role (Callahan & Pigliucci Reference Callahan and Pigliucci2002; Nussey et al. Reference Nussey, Wilson and Brommer2007), and evolution (Paenke et al. Reference Paenke, Sendhoff and Kawecki2007; Pigliucci & Murren Reference Pigliucci and Murren2003).”
9.1. Maternal effects II
Adaptive phenotypic plasticity is apparent in plants, invertebrates, amphibians, reptiles, fishes, birds, and mammals. What unites almost all species is the centrality of maternal effects – or maternal programming – as a mechanism of phenotypic plasticity (Bernardo Reference Bernardo1996; Maestripieri & Mateo Reference Maestripieri and Mateo2009; Mousseau & Fox Reference Mousseau and Fox1998; Wade Reference Wade, Mousseau and Fox1998; Zhang et al. Reference Zhang, Bagot, Parent, Nesbitt, Bredy, Caldji and Meaney2006). Maternal effects are the effects of a mother's phenotype upon the phenotype of offspring and are distinguished from direct genetic effects, that is, the phenotypic effect upon offspring of inheriting maternal genes (Mousseau & Fox Reference Mousseau and Fox1998). Offspring behavioral plasticity enables the mother to adjust the phenotype of offspring in response to the environment she inhabits and, in doing so, in effect transmit to them information about the environment they will inhabit. If the mother's adjustments to the environment are adaptive, and if the environment is stable across generations, that is, if the cues from the mother's environment are a good predictor of the environment in which offspring will find themselves, then the offspring's phenotypic adjustments are adaptive (Badyaev & Oh Reference Badyaev and Oh2008; Qvarnstrom & Price Reference Qvarnstrom and Price2001). A high degree of phenotypic plasticity may also imply that sometimes maternal effects can be maladaptive. For example, if the environment changes in relevant respects, maternal modifications of offspring phenotype may be maladaptive. Therefore, maternal effects may also provide a mechanism by which maladaptive phenotypic traits are transmitted across generations (Gluckman et al. Reference Gluckman, Hanson, Bateson, Beedle, Law, Bhutta and West-Eberhard2009; Mastripieri & Mateo Reference Mastripieri, Mateo, Mastripieri and Mateo2009).
Consider a few examples across species:
-
1. Storm and Lima (Reference Storm and Lima2010) studied differences in the behavior of offspring of gravid crickets from two different environments. In one environment, the gravid mothers were regularly exposed to a predator, the wolf spider Hogna helluo, while the other environment was predator free. The offspring of Hogna-exposed gravid mothers displayed increased antipredator immobility in response to Hogna chemical cues and significantly higher survival rates in the presence of Hogna relative to the offspring of non-exposed mothers. According to Storm and Lima (Reference Storm and Lima2010, p. 383), this was an example of “a transgenerational maternal effect in antipredator behavior that takes the form of a ‘warning’ about predators that female fall field crickets Gryllus pennsylvanicus transmit to their offspring.”
-
2. Female birds are able to alter many aspects of egg composition, including nutrients, hormones, antioxidants, immunoglobulins, and even embryo sex, in response to food availability, levels of sibling competition, and the quality of their mates (Adkinsregan et al. Reference Adkinsregan, Ottinger and Park1995; Groothuis & Schwabl Reference Groothuis and Schwabl2008; Horváthová et al. Reference Horváthová, Nakagawa and Uller2012; von Engelhardt et al. Reference von Engelhardt, Carere, Dijkstra and Groothuis2006). Such maternal effects can result in the influence of a particular environmental factor on phenotypic development persisting across a number of generations, even if the factor itself has altered.
-
3. In mammals, including humans, any imbalance of nutrient intake, such that one or more nutrients is limiting, will produce adaptive responses in the developing fetus (Bellinger et al. Reference Bellinger, Lilley and Langley-Evans2004; Reference Bellinger, Sculley and Langley-Evans2006; Godfrey et al. Reference Godfrey, Sheppard, Gluckman, Lillycrop, Burdge, McLean and Hanson2011; Wiedmeier et al. Reference Wiedmeier, Joss-Moore, Lane and Neu2011). These metabolic adaptations ensure the immediate survival of the fetus in a less than optimal fetal environment, while long-term modifications to organ structure, hormone responsiveness, or gene expression may predispose to metabolic disorders in later life (Godfrey et al. Reference Godfrey, Sheppard, Gluckman, Lillycrop, Burdge, McLean and Hanson2011; Lillycrop & Burdge Reference Lillycrop and Burdge2011; Tamashiro & Moran Reference Tamashiro and Moran2010). This is precisely what we saw in examining the prenatal environment of twins (sect. 7.2) in which an adaptive response – growth restriction – ensures the survival of twins in a suboptimal prenatal environment.
-
4. Numerous studies have shown that offspring olfactory cues and food preferences in both humans and other mammals can be shaped by the maternal prenatal diet in utero and the postnatal environment during lactation (Becques et al. Reference Becques, Larose, Gouat and Serra2010; Bilkó et al. Reference Bilkó, Altbäcker and Hudson1994; Cooke & Fildes Reference Cooke and Fildes2011; Hausner et al. Reference Hausner, Nicklaus, Issanchou, Molgaard and Moller2010; Hepper Reference Hepper1995; Reference Hepper1988; March et al. Reference March, Abate, Spear and Molina2009; Pedersen & Blass Reference Pedersen and Blass1982; Schaal et al. Reference Schaal, Orgeur and Arnould1995; Reference Schaal, Marlier and Soussignan2000; Semke et al. Reference Semke, Distel and Hudson1995; Simitzis et al. Reference Simitzis, Deligeorgis, Bizelis and Fegeros2008; Smotherman Reference Smotherman1982). For example, a recent study with mice examined whether maternal exposure to the artificial sweetener acesulfame-K (AK) during pregnancy or lactation affected the sweet preference of adult offspring (Zhang et al. Reference Zhang, Chen, Liu, Zhan, Quan, Qin and Deng2011). At 8 weeks after birth, preference scores for AK and sucrose were significantly elevated among exposed – both in utero and via nursing – as opposed to non-exposed offspring. The researchers were also able to correlate maternal ingestion of AK with AK in both amniotic fluid and breast milk. Human infants whose mothers consumed, for example, carrots, anise, garlic, and fruits during breastfeeding (Mennella & Beauchamp Reference Mennella and Beauchamp1999; Mennella et al. Reference Mennella, Jagnow and Beauchamp2001; Schaal et al. Reference Schaal, Marlier and Soussignan2000) (Cooke & Fildes Reference Cooke and Fildes2011), or who were fed vanilla-flavored (Gerrish & Mennella Reference Gerrish and Mennella2001) or vegetable-flavored (Mennella et al. Reference Mennella, Kennedy and Beauchamp2006) formula showed marked preferences for these foods and flavors. Furthermore, studies have shown that breast-fed, as opposed to formula-fed, infants are more receptive to diverse food flavors (Forestell & Mennella Reference Forestell and Mennella2007; Maier et al. Reference Maier, Chabanet, Schaal, Leathwood and Issanchou2007; Reference Maier, Chabanet, Schaal, Leathwood and Issanchou2008). This may be due to the greater variety of flavors to which an infant is exposed via mother's milk (which can transmit a variety of flavors from the mother's diet).
Adversity during perinatal development can forecast an increased level of demand in the environment the offspring will occupy. Under such conditions, the animal's best interest is to enhance its behavioral (e.g., vigilance, fearfulness) and endocrine (HPA and metabolic) responsiveness to stress (Champagne et al. Reference Champagne, Francis, Mar and Meaney2003a). These responses promote detection of potential threat, avoidance learning, and metabolic/cardiovascular responses that are essential under the increased demands of the stressor. In regard to maternal rearing behavior, under high-risk conditions, when the probability of extended periods of growth and survival are low, the optimal strategy is to maximize the number of offspring through accelerated mating, increasing the chances that at least some offspring will survive to reproductive maturity (Cameron et al. Reference Cameron, Shahrokh, Del Corpo, Dhir, Szyf, Champagne and Meaney2008). Moreover, since adverse environments are characterized by high, unavoidable risks and thus increased mortality, parental investment in offspring quality may be futile (Gangestad & Simpson Reference Gangestad and Simpson2000). Such conditions favor a shift in reproductive investment toward quantity. In contrast, more favorable environmental conditions favor greater investment in individual offspring at the cost of mating, since offspring quality predicts successful competition for available resources and reproductive fitness.
We saw (sect. 5.2.1) how maternal rearing behavior can shape the rearing behavior of offspring through epigenetic reprogramming. Further studies with rodents have shown that the female offspring of low-LG mothers exhibit, in addition to changes in levels of estrogen receptor α (ERα) expression, increased sexual receptivity; increased levels of plasma luteinizing hormone, which regulates a number of aspects of the female menstrual cycle; increased levels of fetal testosterone at embryonic day 20; and accelerated puberty compared to offspring of high-LG mothers (Cameron et al. Reference Cameron, Shahrokh, Del Corpo, Dhir, Szyf, Champagne and Meaney2008; Reference Cameron, Soehngen and Meaney2011; Jia et al. Reference Jia, Tai, An and Zhang2011; Sakhai et al. Reference Sakhai, Kriegsfeld and Francis2011). These changes were associated with earlier puberty and earlier and increased sexual activity in the female offspring of low-LG versus high-LG mothers. There is evidence that human reproductive strategies in adverse environments exhibit a similar dynamic. Studies have shown that stressful early life conditions, including family relations, are associated with earlier age at menarche (Chisholm et al. Reference Chisholm, Quinlivan, Petersen and Coall2005; Ellis Reference Ellis2004; Ellis & Garber Reference Ellis and Garber2000; Graber et al. Reference Graber, Brooks-Gunn and Warren1995; Moffitt et al. Reference Moffitt, Caspi, Belsky and Silva1992; Saxbe & Repetti Reference Saxbe and Repetti2009), and earlier age at menarche is associated with earlier onset of sexual behavior and reproduction (Andersson-Ellström et al. Reference Andersson-Ellström, Forssman and Milsom1996; De Genna et al. Reference De Genna, Larkby and Cornelius2011). In other words, being raised in a stressful environment is associated with accelerated mating.
9.2. Human exceptionalism?
On the basis of several highly influential studies of twins raised apart conducted in the 1980s, researchers concluded that when it comes to behavioral concordances, the shared rearing environment has an effect statistically indistinguishable from 0 (Plomin & Daniels Reference Plomin and Daniels1987). Genetic factors were almost wholly responsible for behavioral concordances. Rearing environmental influences were instead largely a cause of discordance (i.e., were non-shared):
[W]hen the genetic basis of parent-offspring resemblance is controlled by studying adoptive families, the association between child-rearing strategies and offspring behavior (McGue et al. Reference McGue, Sharma and Benson1996) and the relationship between home characteristics and intellectual achievement (Scarr Reference Scarr and Sternberg1997) are nearly eliminated. Behavioral genetic research on the minimal effect of shared environmental factors … challenges the validity of a vast amount of psychological research aimed at identifying environmental risk. (McGue & Bouchard Reference McGue and Bouchard1998, pp. 14–15)
This absence of shared environmental influence led some behavioral geneticists to conclude that to the extent that parents impact child outcomes, they do so at a child-specific, rather than a family-wide, level:
Quantitative genetic methods, such as twin and adoption methods, were designed to tease apart nature and nurture in order to explain family resemblance. For nearly all complex phenotypes, it has emerged that the answer to the question of the origins of family resemblance is nature – things run in families primarily for genetic reasons.… If genetics explains why siblings growing up in the same family are similar, but the environment is important, then it must be the case that the salient environmental effects do not make siblings similar. That is, they are not shared by children growing up in the same family – they must be “non-shared”.… “Nurture” in the nature–nurture debate was implicitly taken to mean shared environment because from Freud onwards, theories of socialization had assumed that children's environments are doled out on a family-by-family basis. In contrast, the point of non-shared environment is that environments are doled out on a child-by-child basis. (Plomin Reference Plomin2011, p. 582)
Plomin's point, however, is not that all environmental influences are non-shared, but that “most environmental influence for most traits is non-shared” (Plomin Reference Plomin2011, p. 583). Although, as behavior geneticists have themselves noted, such a finding challenges the validity of a vast amount of psychological research (McGue & Bouchard Reference McGue and Bouchard1998; Bouchard Reference Bouchard2004), nonetheless, it has been widely accepted (Burt Reference Burt2009). Maternal effects, prenatal and postnatal, are phenotypic concordance-producing effects; or in the language of behavior genetics, they are shared environmental effects. As Mateo (Reference Mateo, Maestripieri and Mateo2009, p. 134) notes: “Parental effects lead to parent-offspring resemblance, which can be adaptive if offspring encounter similar social and environmental features as adults.” For example, all of the studies cited earlier concerning postnatal epigenetic reprogramming of offspring via maternal rearing behavior demonstrated the transmission of maternal behavior on both the molecular and phenotypic level; that is, offspring came to resemble their (rearing) mothers. In doing so, they also came to resemble each other. Of course, offspring may differ in the degree or manner in which specific behavioral phenotypes are shaped by the perinatal environment due to any number of genetic, epigenetic, and micro-environmental differences (such as fetal position), or on the basis of sex. These same differences, and countless others, entail that the maternal environment can simultaneously be a cause of phenotypic discordance. Nonetheless, particularly in animal studies where the typical litter may contain up to 10 pups, the concordance-producing effects of the maternal environment on offspring behavior are obvious (Champagne Reference Champagne2010a; Champagne et al. Reference Champagne, Francis, Mar and Meaney2003a).
Were it true that there were no (or minimal) maternal effects upon the behavior of human offspring, then humans would indeed be exceptional among all animal taxa. What this would entail is that humans possessed less behavioral phenotypic plasticity, were less capable of being behaviorally shaped by maternal effects, than rodents. Any assumption of the absence of maternal effects, both prenatally and postnatally, seems doubly counterintuitive given that maternal effects appear to play a larger role in the evolutionary dynamics and adaptation of mammals than in any other animal taxa (Fusco & Minelli Reference Fusco and Minelli2010; Mastripieri & Mateo Reference Mastripieri, Mateo, Mastripieri and Mateo2009; Uller Reference Uller2008). As Chevrud and Wolf (Reference Chevrud, Wolf, Maestripieri and Mateo2009, pp. 13–14) note:
Maternal effects are particularly important for mammals where the maternal-offspring relationship is prolonged and intimate. Indeed, the very name of the class Mammalia refers to the specialized organ by which the mother feeds her offspring at birth.… From the time of implantation to birth, the fetus will draw nutrients, oxygen, and hormones and dispel wastes through the placenta rather than processing them through its own immature organs.… The period prior to weaning provides some of the greatest opportunity for survival selection (Crow & Kimura Reference Crow and Kimura1970) on the offspring during life.… Thus, the joint evolution of maternal effects and offspring phenotypes plays a critical role in mammalian evolution.
As mammals, humans have extended and intimate maternal associations, both pre- and postnatal, lasting many years. Yet, in the absence of maternal effects, what is this commitment for, involving as it does an enormous expenditure of maternal time and energy? Just as pressing is the question as to what possible adaptive advantage could accrue to the human species by lacking the plasticity to be behaviorally shaped by maternal effects to better meet the demands of its environment, when such a lack is clearly maladaptive. To see just how maladaptive, consider the following three examples:
-
1. A gravid mother rabbit consumes throughout the perinatal period a berry that is nutritious and grows in abundance in an environment that has an otherwise limited food supply (Bilkó et al. Reference Bilkó, Altbäcker and Hudson1994; Semke et al. Reference Semke, Distel and Hudson1995). Given minimal maternal effects, her offspring have no predilection for the berries. Postweaning, they die of starvation.
-
2. A dam inhabits a very dangerous environment beset by numerous predators. She has high levels of circulating corticosterone and behaviorally displays heightened reactions to stress. She devotes less time to maternal care and more time to being vigilant against predators. Given minimal maternal effects, her offspring, postweaning, exhibit modest stress responses and moderate levels of fearfulness. They are eaten in short order.
-
3. The major histocompatibility complex (MHC) is a set of molecules on the surface of cells that play a central role in the immune system and self- or non-self-recognition. The genes coded for MHC molecules are among the most polymorphic coding loci known among vertebrates (Klein Reference Klein1986). Differences in the MHC are associated with different odors, and studies in both animals and humans have indicated a mating preference for individuals whose odor is associated with dissimilar histocompatibility genes (Havlicek & Roberts Reference Havlicek and Craig Roberts2009; Wedekind & Furi Reference Wedekind and Furi1997). It is hypothesized that MHC dissociative mating preferences function to produce disease-resistant, MHC-heterozygous offspring, or to reduce inbreeding, or both (Apanius et al. Reference Apanius, Penn, Slev, Ruff and Potts1997; Brown & Eklund Reference Brown and Eklund1994; Potts & Wakeland Reference Potts and Wakeland1993). Cross-fostering studies with animals have shown that histocompatibility scent preferences are determined by the scent of the rearing, not the biological mother (Ihara & Feldman Reference Ihara and Feldman2003; Penn & Potts Reference Penn and Potts1998). Given minimal maternal effects, offspring are not affected by their mother's scent one way or another. They inbreed and produce a line of disease-ridden offspring that will die out in several generations.
10. Postgenomics
One of the major theoretical conclusions to emerge from the growing field of systems biology – a self-professed postgenomic discipline that attempts to mathematically model biological networks – is that causation in biological systems runs in both directions: upward from the molecular level (which includes the genome), and downward from all other levels – cellular, tissue, organ, organism, external environment (Noble Reference Noble2010; Shapiro Reference Shapiro2009). There are feedback and feed-forward loops between different levels, and developing the mathematical and computational tools to deal with these multiple levels of causation is a major challenge (Srividhya et al. Reference Srividhya, Li and Pomerening2011). No one level is privileged or controlling. DNA is no longer privileged as the sole carrier of information (Jablonka & Lamb Reference Jablonka and Lamb2005).Footnote 16 Identical DNA sequences exist in phenotypically different cell types: These phenotypic differences are due to epigenetic programming of DNA, which carries the information as to which genes can be transcribed and proteins synthesized in a given cell. Which protein is produced from a given genomic sequence is not determined by the sequence itself, but by the cell, which through alternative splicing determines which isoforms will be produced in response to external and internal signals. Neither the genome nor the epigenome determine the nature of the prenatal environment that will induce changes in both.
For phenotypes of any degree of complexity, DNA does not contain a determinate genetic program (analogous to the digital code of a computer) from which we can predict phenotype. If DNA were the sole carrier of information relevant to phenotype formation, and contained a genetic program sufficiently determinate that solely by reading it we could predict phenotype, then humans (and all other organisms) would be largely lacking in phenotypic plasticity. Phenotypic plasticity is one of the keys to adaptation and species survival. However, to state that the Genome is not the sole biological agent of heritability or the sole carrier of information and hence not privileged among other heritable biological agents, the environment (at all levels), and the developmental process is of course not to claim that it is less critical than any of these. It is, rather, to claim that it is an integral component of an exceedingly complex, integrated, interactive, multilevel process.
What, then, are the implications of all of this for the future of the two methodologies in behavior genetics that I have considered? The challenges for traditional heritability estimates are formidable (Richards Reference Richards2009; Wells & Stock Reference Wells and Stock2011). How might we go about incorporating neogenomic phenomena into heritability estimates? Here is a description of just such an endeavor in relation to epigenetic inheritance:
Interindividual differences in chromatin states at a locus (epialleles) can result in gene expression changes that are sometimes transmitted across generations. In this way, they can contribute to heritable phenotypic variation in natural and experimental populations independent of DNA sequence. Recent molecular evidence shows that epialleles often display high levels of transgenerational instability. This property gives rise to a dynamic dimension in phenotypic inheritance. To be able to incorporate these non-Mendelian features into quantitative genetic models, it is necessary to study the induction and the transgenerational behavior of epialleles in controlled settings. Here we outline a general experimental approach for achieving this using crosses of epigenomically perturbed isogenic lines in mammalian and plant species. We develop a theoretical description of such crosses and model the relationship between epiallelic instability, recombination, parent-of-origin effects, as well as transgressive segregation and their joint impact on phenotypic variation across generations. In the limiting case of fully stable epialleles our approach reduces to the classical theory of experimental line crosses and thus illustrates a fundamental continuity between genetic and epigenetic inheritance. We consider data from a panel of Arabidopsis [a plant frequently used as a model organism in research] epigenetic recombinant inbred lines [epiRILs] and explore estimates of the number of quantitative trait loci for plant height that resulted from a manipulation of DNA methylation levels in one of the two isogenic founder strains. (Johannes & Colome-Tatche Reference Johannes and Colome-Tatche2011, p. 215)
It should be noted that the path ahead travels through biomolecular genetics. Nonetheless, if the objective is to incorporate neogenomics into heritability estimates, this passage also indicates some of the obstacles. To begin with, even inbred Arabidopsis are not genetically identical and their genetic identity is not fixed, as researchers employing Arabidopsis for the same purpose of analyzing epigenetic heritability have noted. Johannes et al. (Reference Johannes, Porcher, Teixeira, Saliba-Colombani, Simon, Agier and Colot2009) and Reinders et al. (Reference Reinders, Wulff, Mirouze, Mari-Ordonez, Dapp, Rozhon and Paszkowski2009) created two inbred lines of Arabidopsis, each containing different mutations that would disrupt methylation at specific epialleles (epiRILs):
Standard … approaches to identify important epialleles affecting complex traits using these epiRILs will be frustrated by the fact that the new epigenetic variation is often unstable and not sequestered in tidy blocks that can be traced unambiguously to one or the other parent. Confounding matters further, there is another type of variation generated in the epiRIL lines that undermines the premise of the lines' construction. In both the met1- and ddm1-derived epiRILs, two lines with defective genes … transposons are mobilized.… These DNA elements lose epigenetic silencing and are activated in the ddm1 mutant parents (Miura et al. Reference Miura, Yonebayashi, Watanabe, Toyama, Shimada and Kakutani2001). Once these elements shed their epigenetic silencing, they continue to jump in the different ddm1-derived epiRIL lineages. (Richards Reference Richards2009, p. 1604)
The mobilization of transposons is not, however, a phenomenon that results only from defective genes. In humans, their mobilization is a normal part of embryogenesis, leading to their jumping around in the brains of MZ twins, altering their neural genomes. Furthermore, active transposons are present in the germline and L1 RNA is heritable, but in a non-Mendelian manner. Nor are methylation and histone remodeling the only heritable forms of epigenetic regulation. The vast system of miRNA posttranscriptional regulation of DNA is also heritable via the germline, and although it appears to affect every aspect of human development and functioning, we still have very little knowledge as to its manner of inheritance, how it operates, and how it affects phenotypes. This passage also shows, in a very clear way, that although epialleles, their methylation patterns, and transposons may all be inherited, albeit according to different processes and principles, they do not act as separate lines of causal influence. Rather, they continually interact because their interaction is essential to normal organismic development and functioning (i.e., if methylation did not repress transposition, it would run amuck with fatal consequences; if the waves of demethylation that occur during human embryogenesis did not allow the activation of retrotransposons, the consequences would also be fatal).
Attempting to compose a formula that could be used to estimate the extent to which variation in anything inherited via the germline could affect phenotype shows the nature of the problem. We would need to begin by identifying each of those heritable agents, for example, V TE (transposable elements), V miRNA (miRNA), V METH (methylation profile), V HM (histone modification), V L1-RNA (L-1 RNA), V mtDNA (mtDNA), and V ANEU (aneuploidy). It is likely that not all transposable elements, and not all miRNAs, are heritable to the same extent or in the same way, so we might need to break them into subcategories. Alongside the question of measurement is the question as to how these terms should be related. We know that there are innumerable interactions, for example, V TE × V METH, V TE × V HM, V TE × V L1-RNA, V A × V miRNA, V A × V METH, V A × V L1-RNA, V A × V ANEU, V mtDNA × V METH, V mtDNA ×V miRNA, V mtDNA × V TE, and so on (this is of course a highly simplified schematic, since the effects of interaction between two sources of variance can interact with a third source of variance, and so on). Every one of these agents interacts with the environment, prior to conception (in the germ cells) and during embryogenesis. I suggest that in a situation such as this, this question does not make a lot of sense: “Which contributes more to variation in a complex behavior, genes or environment?” (And if the reader is inclined to doubt the relevance of all of these non-genomic heritable agents for human behavior, recall that humans possess fewer genes than corn, and although possessing only ~25,000 genes, the human organism produces well over a million proteins.)
Gene association studies, particularly with advances that will allow parallel sequencing of multiple tissues simultaneously and the simultaneous search for multiple genetic markers – SNPs, CNVs, and transposon insertions – hold out promise for future research. However, from a postgenomic perspective, the operating assumption should be that in most cases, genotype alone will not predict phenotype. Even when what seem to be statistically significant correlations have been found, they must always be considered within a wider context of research, and ideally combined with other levels of analysis. These include global and tissue-specific methylation profile and miRNA analysis, as well as the analysis of mRNA and protein levels. The analysis of mRNA and proteins has the advantage of showing DNA transcription in action, reflecting the combined inputs and decisions of multiple physiological and environmental players whose behavior is not entirely determined or regulated by DNA itself. This has sparked the development of new research methodologies in which, for example, the transcriptome and the proteome are viewed as modes (or levels) of analysis more productive than an exclusive focus on the genome (Crameri et al. Reference Crameri, Schulz-Knappe and Zucht2005; Martin & Wang Reference Martin and Wang2011; Nagaraj et al. Reference Nagaraj, Wisniewski, Geiger, Cox, Kircher, Kelso and Mann2011; Yu et al. Reference Yu, Conrads, Uo, Kinoshita, Morrison, Lucas and Veenstra2004).
The incorporation of newly discovered heritable agents and assorted -omics is still likely to yield insufficient predictive capacity, however, without a thorough consideration of possible environmental factors as contributing agents. From the postgenomics perspective, the environment is as much a carrier of information as the DNA sequence, both for shaping phenotype and as a source of information in trying to predict phenotype. An awareness of developmental biology and the concept of phenotypic plasticity needs to inform any search for predictors of behavior, and known domains and mechanisms of plasticity should be a part of every investigation. This begins, naturally, with the fetal environment. Hence, researchers need to examine not just the parents' genomes, but the mother's behavior during pregnancy and birth – her nutrition, stress levels, lifestyle, mode of interaction with offspring, levels of maternal care, breast-feeding behavior, and so on. There are many studies of this sort; but more are needed, and they need to be integrated with, for example, genomics, epigenomics, and proteomics.
Finally, one of the key insights to emerge from the resurrection of developmental biology as a central focus in evolutionary theory is that development occurs not simply in the mother's womb, but in an ecological niche (West & King Reference West and King1987). For better or worse, the ecological environment of the mother impacts the perinatal environment. Hence, we also need to incorporate into an expanded synthesis an understanding of the broader ecological factors: socioeconomic status, environmental toxins, health care provision, and even weather and light and day cycles (Brook et al. Reference Brook, Brook, Kats, Arencibia-Mireles and Finch2009; Skinner et al. Reference Skinner, Manikkam and Guerrero-Bosagna2010), all of which can also shape phenotype. In contemporary evolutionary theory, an ambitious synthesis of all of these forces has been fashioned into an area of research dubbed ecological developmental biology (Gilbert & Epel Reference Gilbert and Epel2009). I suggest that a parallel approach in the behavioral sciences will yield many valuable insights.
Nonetheless, understanding and prediction are not the same thing, and if the goal is the latter, it may prove elusive, at least for the immediate future, especially when we add the omnipresence of stochasticity to the mix. Considered for a long time to be insignificant variations around a significant mean, stochasticity in gene expression clearly plays an important role in biological processes, and the molecular bases of such stochasticity are now a major area of investigation (Coulon et al. Reference Coulon, Gandrillon and Beslon2010; Feinberg & Irizarry Reference Feinberg and Irizarry2010; Kaufmann & van Oudenaarden Reference Kaufmann and van Oudenaarden2007; Lipniacki et al. Reference Lipniacki, Paszek, Marciniak-Czochra, Brasier and Kimmel2006; Paulsson Reference Paulsson2005; Raj & van Oudenaarden Reference Raj and van Oudenaarden2008; Shahrezaei & Swain Reference Shahrezaei and Swain2008; van Oudenaarden Reference van Oudenaarden2009). Biology creates order from stochastic processes, but biological systems can never overcome stochasticity, which persists at every level of biological organization. In fact, constrained randomness, intermediate between rigid determinism and complete disorder, is probably the best way to characterize the relationship between biological systems and stochasticity (Theise & Harris Reference Theise and Harris2006). While stochasticity continually threatens to undermine the order imposed by biological systems, those same systems can exploit stochasticity for their own advantage. Consider, for example, the manner in which the cells of the immune system anticipate a highly variable environment, a process to which some researchers have compared the activity of retrotransposons in the human brain and neuronal somatic and chromosomal mosaicism (Sciamanna et al. Reference Sciamanna, Vitullo, Curatolo and Spadafora2009).
Cells of the immune system protect the body against disease by identifying and destroying pathogens such as viruses and bacteria. They do this by identifying antigens, sites on pathogens that antibodies can recognize as the biochemical mark of an intruder and to which they can bind. Finding and destroying pathogens is made vastly more difficult by the fact that pathogens can rapidly evolve, producing adaptations that allow them to change the structure of their antigens to avoid detection. Since only immune cells with the right configuration can bind to antigens with a complementary configuration via a “lock-and-key” process, this creates a significant problem for the immune system. To combat this problem, immune cells exhibit somatic hypermutation. For example, it has been estimated that lymphocytes are capable of producing about 1015 different antibody variable regions (B cells) and a similar number of T-cell receptor variable regions. This allows for the creation of as many antibody “keys” as there are antigen “locks.” Remarkably, this vast diversity of the immune repertoire originates from fewer than 400 genes (Abbas et al. Reference Abbas, Lichtman and Pillai2010). For the immune system, stochastic genomic recombination creates genetic hyperdiversity, which leads to phenotypic hyperdiversity (antibody configurations), and this phenotypic hyperdiversity enables immune cells to better respond to hypervariable threats in the environment.
In an analogous fashion, genetic hyperdiversity in neurons in the brain may lead to phenotypic hyperdiversity, that is, hyperdiversity of neuronal morphology and function between individual neurons, and this diversity may better enable the brain to respond adaptively to the demands of a diverse and variable environment. Similarly, the manner in which the epigenome functions is also highly stochastic: “Gene promoters can be in various epigenetic states and undergo interactions with many molecules in a highly transient, probabilistic and combinatorial way, resulting in a complex global dynamics as observed experimentally” (Coulon et al. Reference Coulon, Gandrillon and Beslon2010, p. 1). That highly stochastic processes such as epigenetic reprogramming, retrotransposition, chromosomal somatic mosaicism, and CNV appear to be particularly prevalent in the human brain is likely no evolutionary accident. CNVs, which exhibit mutation rates anywhere from 100–10,000 times greater than SNPs, are believed to have been a driving force in the rapid evolution from the great apes to humans; Alu elements, which use the products of retrotransposons to transpose, are unique to apes and humans; and the ability of transposable elements to move within genomes gives them an intrinsic propensity to affect genome evolution (Cordaux & Batzer Reference Cordaux and Batzer2009; Rebollo et al. Reference Rebollo, Horard, Hubert and Vieira2010). The same stochastic processes that enable rapid mutation can also enable rapid evolution (Feinberg & Irizarry Reference Feinberg and Irizarry2010).
Niels Bohr argued for the intrinsic stochasticity of nature, and the shift from the genetic to the postgenomic paradigm has been compared to the shift from the Newtonian paradigm to that of relativity theory and quantum mechanics (Noble Reference Noble2010). Beyond analogies, systems modeled on quantum mechanics are now being employed in the study of probability landscapes of heritable epigenetic states:
Computational studies of biological networks can help to identify components and wirings responsible for observed phenotypes. However, studying stochastic networks controlling many biological processes is challenging. Similar to Schrödinger's equation in quantum mechanics, the chemical master equation (CME) provides a basic framework for understanding stochastic networks. (Cao et al. Reference Cao, Lu and Liang2010)
Hence, it is well to keep in mind what Bohr himself said with a refreshing spirit of scientific humility: “Prediction is very difficult, especially if it's about the future.”
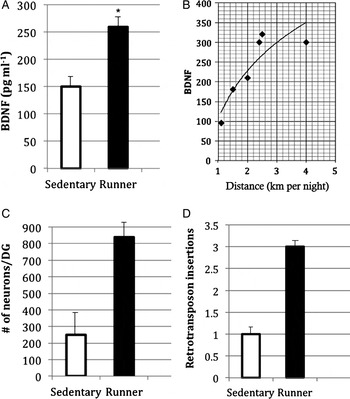
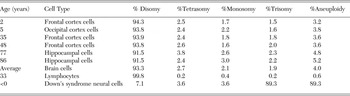
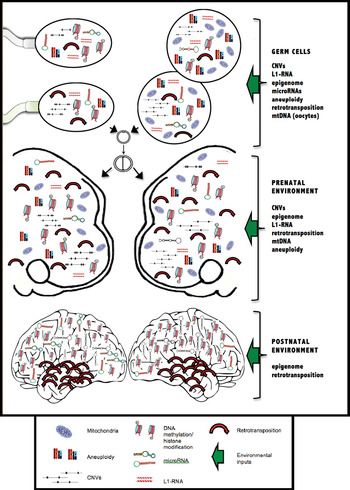
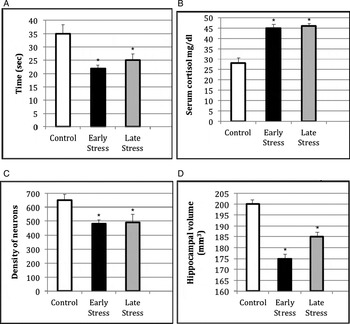
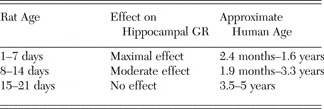



Target article
Behavior genetics and postgenomics
Related commentaries (24)
A call for an expanded synthesis of developmental and evolutionary paradigms
A developmental science commentary on Charney's “Behavior genetics and postgenomics”
A straw man's neogenome
Affirmation of a developmental systems approach to genetics
Assumptions in studies of heritability and genotype–phenotype association
Biology trumps statistics in the postgenomic era
Clinicians learn less and less about more and more until they know nothing about everything; researchers learn more and more about less and less until they know everything about nothing: Discuss
Epigenetic regulation of brain-derived neurotrophic factor: Implications in neurodevelopment and behavior
Estimating the actual subject-specific genetic correlations in behavior genetics
From gene activity to behavior (and back again)
Gene-independent heritability of behavioural traits: Don't we also need to rethink the “environment”?
Genetic sensitivity to the environment, across lifetime
Heritability estimates in behavior genetics: Wasn't that station passed long ago?
Is behavioral genetics ‘too-big-to-know’ science?
Is genomics bad for you?
Neogenomic events challenge current models of heritability, neuronal plasticity dynamics, and machine learning
Non-Mendelian etiologic factors in neuropsychiatric illness: Pleiotropy, epigenetics, and convergence
Parental brain and socioeconomic epigenetic effects in human development
Postgenomics and genetic essentialism
Preventing a paradigm shift: A plea for the computational genome
Relational developmental systems: A paradigm for developmental science in the postgenomic era
The fate of heritability in the postgenomic era
The history of the nature/nurture issue
Twin and family studies are actually more important than ever
Author response
Humans, fruit flies, and automatons