1. Introduction
Many countries have substantially increased their output of industrial and municipal waste in recent decades, and further increases are projected. Mazzanti and Zoboli (Reference Mazzanti and Zoboli2009) have documented the rising trend in EU countries. Hotta et al. (Reference Hotta, Mori and Tanaka2008) have estimated that industrial waste will triple over year 2000 levels for countries in the Association of South East Asian Nations (ASEAN) by 2050. The Organization for Economic Cooperation and Development (OECD) estimates that, in 2050, the world will generate approximately 27 billion tons of waste, more than double the 12.7 billion tons generated in 2000 (OECD, 2008). In addition to the current and projected increases in waste generation, transboundary movements of recyclable waste have increased as the world globalizes through trade liberalization.Footnote 1
In general, trade in recyclable waste creates economic gains. For example, if demand for materials increases as developing countries grow economically, liberalized trade in recyclable waste enables industries in these countries to procure materials more easily. This allows industries other than recycling to expand, and per capita income and GDP will increase as a result.
On the other hand, trade in recyclable waste can generate negative externality costs for waste-importing countries. In particular, in contrast to developed countries, recycling processes in developing countries often make intensive use of unskilled labor. Additionally, populations in developing countries may not be aware of the toxicity of waste materials. In these cases, recycling/dismantling activities can cause serious environmental damage and/or health problems. In addition, trade in recyclable waste sometimes leads to more dumping into landfills of waste-importing countries, including illegal dumping.Footnote 2
Consequently, increased trade of recyclable waste, particularly the transboundary movements from developed to developing countries, has stimulated controversy about trade regulations. The Basel Convention aims to restrict transboundary movements of hazardous waste, particularly waste destined for developing countries, and arguments for more restrictive bans on trade in hazardous waste have become heated.Footnote 3
Some developing countries, such as China, have experienced rapid economic growth, and the proportion of skilled labor in the total labor force has been increasing. Moreover, the industrial sector has expanded in these countries, accompanied by a demand for materials, including recycled material. Therefore, great gains from trade in waste are likely among these countries. However, other developing countries have stagnant economies and abundant unskilled labor. Since only the unskilled labor intensive recycling process is located in these countries because of the vertical disintegration of production processes, the negative externalities are likely to be great. Moreover, wastes can migrate into these early-stage developing countries just to be disposed of in landfills. Thus, whether gains from importing recyclable waste dominate externality losses depends on the economic conditions in each developing country.Footnote 4
When trade in recyclable waste is disaggregated and categorized, four patterns emerge: (a) a large quantity of waste is exported from developed countries to other developed countries, (b) from developed to developing countries, (c) from developing to developing countries, and (d) from developing to developed countries. See table 1a–e for details about five categories of waste and scrap. It is clear that the fourth pattern involves relatively small quantities of recyclable waste and, accordingly, the trade between developed and developing countries is unbalanced. In this paper, bearing in mind the importance of trade from developed to developing countries, we examine the factors affecting the trade volume of recyclable waste for both exporting and importing countries.
Values of trade in waste, parings and scrap of polymers of ethylene, 391510 (in US$1,000)

Note: The sum of amounts from 2000 through 2004.
Source: UN Comtrade.
Waste, parings and scrap of polymers of vinyl chloride, 391530 (in US$1,000)

Note: The sum of amounts from 2000 through 2004.
Source: UN Comtrade.
Waste, parings and scrap of polymers of other plastics, 391590 (in US$1,000)

Note: The sum of amounts from 2000 through 2004.
Source: UN Comtrade.
Ferrous Waste and scrap, remelting scrap ingots of iron or steel, 720449 (in US$1,000)

Note: The sum of amounts from 2000 through 2004.
Source: UN Comtrade.
Copper waste and scrap, 740400 (in US$1,000)

Note: The sum of amounts from 2000 through 2004.
Source: UN Comtrade.
To achieve that goal, this study employs three important elements. First, we adopt a gravity model in our empirical methodology. As has been widely acknowledged, gravity models have succeeded empirically in explaining trade flows. Several empirical studies have addressed the recycling problem in open economies (Van Beukering et al., Reference Van Beukering and Bouman2001; Van Beukering, Reference Van Beukering2002; Berglund and Söderholm, Reference Berglund and Söderholm2003a, Reference Berglund and Söderholm2003b). However, these studies seek primarily to explain recovery and utilization rates; they do not examine the relationship between wages and commodity-level trade flows of scrap using gravity models.
Second, we select five waste and scrap commodities and undertake estimations using commodity-level trade data. Baggs (Reference Baggs2009) employs a gravity model to analyze trade in hazardous waste and concludes that imports of hazardous waste rise with per capita gross domestic product (GDP). However, she considers only data reported under the Basel Convention on the Control of Transboundary Movements of Hazardous Wastes and their Disposal. Reported trade in hazardous waste could be understated because wastes such as printed circuit boards are often traded as ‘metal scrap’ (Kellenberg, Reference Kellenberg2010; Shinkuma and Managi, Reference Shinkuma and Managi2011). Therefore, it is essential to identify trade classified as waste and scrap. In this respect, our study is closely related to Kellenberg (Reference Kellenberg2012), which investigated the effect of environmental regulations on transboundary movement of waste and scrap. He uses bilateral trade data in 2004, and aggregates the amounts of wastes traded internationally across 62 six-digit Harmonized System (HS) categories. By contrast, we focus on economic variables, such as wages and GDP. Moreover, the sample period of our data is 17 years (1995–2011), and we conduct estimations for five waste and scrap commodities separately.
Third, we distinguish recyclable waste from recycled materials. Waste collectors (hereafter collectors) collect discarded goods, produce recyclable waste from discarded goods and sell the goods to recyclers. Recyclers buy recyclable waste from collectors, and produce recycled materials from recyclable waste.Footnote 5 Collectors can supply recyclable waste to the markets of other countries, and recyclers can buy recyclable waste produced in other countries. This paper focuses on recyclable waste which corresponds to waste and scrap in the classification of the HS code.
Our empirical results show that the greater the market scale of an importing country, the more recyclable waste it imports. In this paper, the market scale is measured in terms of GDP or population size. Moreover, countries with higher wages import more recyclable waste. These results suggest that the demand for final goods and/or the size of the industrial sector in importing countries strongly affect trade flows of recyclable waste, because higher demand for final goods and greater industrial scale will likely boost the demand for recyclable waste. These results also have implications for the extents of the gains and environmental costs generated by exporting waste from developed to developing countries. For example, when trade in recyclable waste is restricted, it is likely that declines in imports by more advanced developing countries exceed those by less advanced developing countries. Thus, trade restrictions impair production efficiency by making it harder for more advanced developing countries to procure materials at low prices.
The rest of this paper is structured as follows: section 2 describes the theoretical background. Section 3 investigates trade volumes. Section 4 presents the empirical analysis. Section 5 concludes the study.
2. Theoretical specification
This section describes our model's theoretical specifications. There are N countries (1, ·, i, · N) that export recyclable waste, and M countries (1, ·, j, · M) that import recyclable waste. As noted in the introduction, because of our focus on trade in recyclable waste, we distinguish recyclable waste from recycled materials.
2.1. Supply of recyclable waste
First, we describe the supply of recyclable waste in exporting countries. Consumers discard good X after consuming it. Once collected, some of the discarded good X enters landfills, and the rest is recycled.
The market for recyclable waste is assumed to be perfectly competitive. The marginal cost of collecting discarded goods and producing recyclable waste is determined by the recovery rate and the quantity of the final good consumed. We describe the supply of recyclable waste produced by collectors in country i asFootnote 6
 $$Bs_i =q_{b\comma i}^{\beta} \cdot \hbox{Re}_i \cdot x_i\comma \; \quad 0 \lt \beta \lt 1\comma \;$$
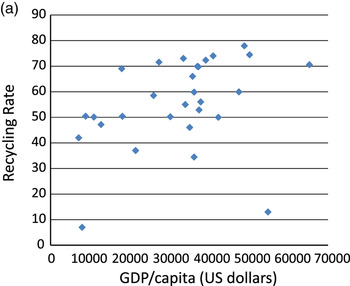
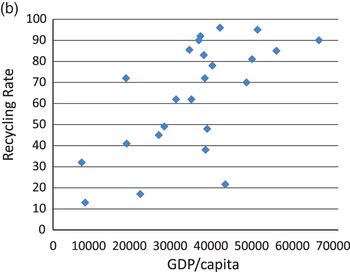
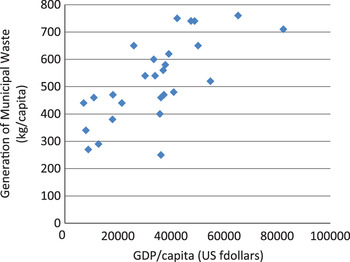
where q b, i , Re i and x i denote the producer's price of recyclable waste collected in country i, the recovery rate of country i, and the consumption of X in country i, respectively.Footnote 7 The producer's price is the per-unit revenue received by waste collectors. We assume that the quantity of recovered material is less than that of material discarded by consumers.Footnote 8 When the marginal cost of collecting an additional unit of waste rises, β > 0.Footnote 9 Moreover, in general, a higher per capita GDP implies a higher recovery rate because consumers’ environmental consciousness increases with per capita GDP. Figures 1a and 1b provide the evidence for this relationship. They show that, for a given population, higher per capita GDP implies greater total consumption. Thus, higher per capita GDP leads to greater supply of recyclable waste. Although an increase in consumers’ environmental consciousness may decrease the generation of waste through changes in consumption behavior, we do not observe such a clear relationship at this point (see figure 2).
(a) GDP/capita and recycling rate: paper and cardboard (2005)

GDP/capita and recycling rate: glass (2005)

Generation of municipal waste per capita and GDP (2005)

Collectors of recyclable waste need not differentiate the quality of waste shipped to one country or another. Thus, the producer's price of recyclable waste produced in country i and exported to country j is the same as that exported to country k.
2.2. Demand for recyclable waste
Recyclers in importing countries produce recycled materials from recyclable waste. We consider the following two-step determination for the supply of recycled materials.Footnote 10 First, one unit of input (Z B, j ) for the production of recycled material is made by mixing imported and domestic recyclable wastes. In terms of recyclers, the quality of recyclable waste generated in any pair of countries generally differs because of variation in the quality of consumed goods, the manner of consumption and the means of discarding. Thus, different countries’ recyclable wastes are imperfect substitutes for each other.
The technology of mixing wastes to produce the input is described by
 $$Z_{B\comma j} =\prod_i b_{i\, j}^\gamma \cdot b_{jj}^\gamma\comma \; \qquad i\in N\comma \; \quad \lpar N+1\rpar \gamma =1\comma \;$$
where b ij denotes recyclable waste exported from country i to country j·b jj for any j indicates the domestic recyclable waste.Footnote 11 Inputs are determined such that the unit cost is minimized as follows:
 $$Min\ \sum_i p_{b\comma ij} b_{ij} +p_{b\comma jj} \cdot b_{jj}\comma \; \ s.t.\ Z_{B\comma j} =1\comma \;$$
where p b, ij denotes the price of imported recyclable waste from country i to country j.Footnote 12 Solving the cost-minimization problem, the demand function is
 $$b_{ij} =p_{b\comma ij}^{-1} \cdot \bar{P}_{B\comma j}\comma \;$$
where
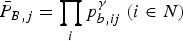 $\bar {P}_{B\comma j} =\prod_{i} {p_{b\comma ij}^{\gamma} \ \lpar i\in N\rpar }$
, which is the price index of recyclable waste. The unit cost is given by
 $p_{ZB\comma j} =\lpar N+1\rpar \cdot \bar{P}_{B.j}$
.
The market for recycled material is perfectly competitive. Given the unit cost of input (p ZB.j ), the producer's price of recycled material (q r, j ) and the wage (w j ), the profit of this sector is defined as
 $$\pi_{r\comma j} = q_{r\comma j} Rs_j - \lpar w_j l_{r\comma j} \lpar \bar{K}_{r\comma j}\rpar + p_{ZB\comma j}\rpar \cdot Rs_j^{\rho}\comma \; \qquad \rho \gt 1\comma \; \quad {l}_{r\comma j}^{\prime} \lt 0\comma \;$$
where Rs
j
denotes the quantity of recycled material produced in country j. Moreover, l
r, j
and
 $\bar{K}_{r\comma j}$
denote the labor input used for the production of recycled material and the amount of the specific factor, which is capital stock, in the production of the recycled material, respectively.Footnote
13
The condition ρ > 1 implies that marginal cost is increasing, and the profit (producer's surplus) is paid to the specific factor owners. As with suppliers of recyclable waste, recyclers need not differentiate between the quality of product shipped to one country versus another. Solving the profit maximization problem, the supply function is obtained as
 $$Rs_j =\left({q_{r\comma j} \over \omega_{r\comma j} \rho}\right)^{{1 \over \rho - 1}}\comma \;$$
where
 $\omega_{r\comma j} =w_{j} l_{r\comma j} \lpar \bar{K}_{r\comma j}\rpar + p_{ZB\comma j}$
.
From (2) and (4), the demand for recyclable waste collected in country i that is shipped for recycling to country j can be obtained as follows:
 $$Bd_{ij} = p_{b\comma ij}^{-1} \cdot \bar{P}_{B\comma j} \cdot Rs_j^{\rho}.$$
Moreover, we consider that some waste enters the landfills of the importing country. It is likely that higher per capita GDP is accompanied by greater environmental consciousness and a lower ratio of imported waste entering landfills. Thus, the demand for recyclable waste can be rewritten as
 $$Bd_{ij} = p_{b\comma ij}^{-1} \cdot \bar {P}_{B\comma j} \cdot Rs_j^{\rho} \cdot a_j \bar{E}_j^{\tau}\comma \; \quad a_j \gt 0\comma \; \ \tau \lt 0\comma \; \ a_j \bar{E}_j^{\tau} \gt 1\comma \;$$
where
 $\bar{E}_{j}$
denotes the per capita GDP of country j and
 $1/\lpar a_{j} \bar{E}_{j}^{\tau}\rpar $
is the ratio of recycled imported waste to total imported waste for the importer (country j). Finally, τ represents the income elasticity of this ratio.
3. Trade volume
From (1) and (6), the equality condition between import demand and export supply of recyclable waste produced in country i is
 $$q_{b\comma i}^{\beta} \cdot Re_i \cdot X_i =\sum_j {Bd_{ij}} = q_{b\comma i}^{-1} \sum_k {C_{b\comma ik}^{-1} \cdot \bar {P}_{B\comma k}} \cdot Rs_k^{\rho} \cdot a_k \bar {E}_k^{\tau}\comma \; \quad k\in M\comma \;$$
where p b,ik = q b,i ·C b,ik , and C b, ik denotes the cost of transporting recyclable waste from country i to country k. Thus, the trade volume between exporting country i and importing country j is given by
 $$B_{ij} = C_{b\comma ij}^{-1} \cdot \bar{P}_{B\comma j} \cdot Rs_j^{\rho} \cdot a_j \bar {E}_j^{\tau} \cdot \left({\sum\limits_k C_{b\comma ik}^{-1} \cdot \bar{P}_{B\comma k} \cdot Rs_k \over \hbox{Re}_i \cdot x_i} \right)^{-{1 \over \beta + 1}}\comma \; \quad k\in M.$$
Now, let us consider factors that determine the trade volumes of recyclable waste between exporting country i and importing country j.Footnote
14
In the following, it is assumed that the price index
 $\lpar \bar {P}_{B\comma i}\rpar $
is given in determining the trade volume of each pair of countries.
Bracketed values in (7) are the same for all importing countries because the numerator includes variables of all importing countries. Thus, three factors clearly affect trade volume: the transportation cost (C b, ij ), the scale of the recycling sector (Rs j ), and the ratio of imported waste entering landfills to total waste imports (country j).
The scale of the recycling sector warrants more detailed examination. Obviously, the candidates that affect the price of recycled material, and accordingly, Rs j , are the production cost of the recycled material in country j and the demand for recycled materials produced in country j.
3.1. Wages of importing countries
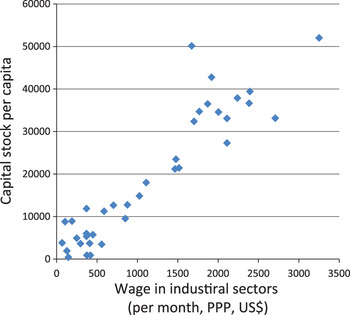
Based on (4) and (7) and given the price of recycled materials, we can see that there is an inverse relationship between per-unit variable cost (ω r,j ) and the scale of the recycling sector. In general, a higher wage rate suggests a greater per capita quantity of capital stock (figure 3). Thus, the relationship between wage and per-unit variable cost depends on whether the recycling process is labor or capital intensive. If the recycling sector is labor intensive, then the higher the wage is in an importing country, the lower the capital rent is in that country, which in turn implies lower recyclable waste imports for any given price of recycled material. On the other hand, if the recycling sector is capital intensive, the higher the wage is in an importing country, the more recyclable waste it imports for any given price of recycled material. The same producer price prevails when recycled material can be traded freely between any two countries and when transportation costs are the same for any two countries.Footnote 15 In such a case, this cost factor determines the scale of the recycling sector.
Correlation between the wage and capital stock (1990)

However, when recycled material cannot be traded freely, wages can affect the scale of the recycling sector via another channel.Footnote 16 Because recycled material is an intermediate good, producers of final goods tend to procure recycled materials from domestic recyclers. Thus, a larger final goods industry in country j suggests greater demand for material from recyclers in country j. Accordingly, the market scale of recycled material produced in country j is larger. It usually holds that the scale of a country's industrial sector parallels its quantity of capital stock. Ceteris paribus, the higher a country's wages, the more material it demands, including recycled materials.
Consequently, wages can affect the trade volume of recyclable waste positively or negatively. If a lower wage country imports more recyclable waste, it implies that early-stage developing countries import a large quantity of recyclable waste. Recycling in these countries might be labor intensive, and negative externalities of importing waste from developed countries will likely overshadow gains from trade. If a higher wage country imports more recyclable waste, it implies that import volumes will increase along with industry expansion. In this case, significant gains from trade are likely because trade in recyclable waste supplies industries in these countries with input materials.
3.2. The market scale: population and GDP of importing countries
For a given per capita GDP, larger populations have greater demand for final goods. In this sense, population measures the market scale of final goods. GDP itself can also be a measure of market scale because a greater GDP implies a higher per capita GDP or/and a greater population size.
When final goods can be traded freely, consumers might be indifferent between domestic and foreign final goods. In that case, final demand in country j does not affect the scale of that country's final goods industry. In other words, consumers and final goods producers face the same integrated world market. However, if final goods cannot be traded freely, the GDP or population will positively affect the scale of the recycling sector and the demand for recyclable waste because consumers will tend to purchase domestically produced final goods. In the latter case, a larger market scale leads to a higher price of recycled materials and, accordingly, larger demand for recyclable waste (see equation (4)).
3.3. Per capita GDP of importing countries
As per capita GDP increases, people usually become more environmentally conscious, which is likely to increase the waste recovery rate. If so, imports of recyclable waste decrease because domestic and foreign recyclable wastes become substitutes. Moreover, recyclable waste imported into developing countries is sometimes dumped in landfills. Environmentally conscious populations disapprove of landfill dumping, which again suggests that imports of recyclable waste will decrease.Footnote 17 On the other hand, for a given population, per capita GDP can be a measure of the market scale. Similar to the case of GDP and population, a higher per capita GDP may lead to larger demand for recyclable waste.
In summary, the two effects are at odds with each other. However, when focusing on developing countries, their waste recovery rates are usually low. Therefore, the domestic supply of recyclable waste cannot meet increased demand. Thus, in the case of developing countries, assuming all other variables are fixed, the demand for imported recyclable waste is likely to become greater as per capita GDP increases.
3.4. Variables of exporting countries
The variables of exporting countries also affect trade volume. It follows from (7) and the assumption of β (0 < β< 1) that the quantity of final goods consumed and the recovery rate of exporting country j positively affect the export supply of recyclable waste. Given that other variables are fixed, an increase in per capita GDP increases demand for materials and, accordingly, for recyclable waste. However, for developed countries, waste recovery rates are generally high. Therefore, increases in the supply of recyclable waste are likely to exceed increases in demand. In such cases, the exporting country's per capita GDP positively affects its trade volume in recyclable waste.
A similar result is obtained for the exporting countries’ populations and GDP. A greater market scale leads to a greater demand for final goods and a greater supply of recyclable waste. If the latter effect dominates the former effect, the greater is the population or GDP of an exporting country, the more recyclable waste it exports.
4. Empirical evidence of trade patterns in recyclable waste
We have examined the relationship between trade flows of recyclable waste and variables determining its transboundary movement. This section empirically examines the effects of those variables on trade volumes. In the real world, other economic and non-economic factors influence trade flows, so we include those factors in our estimation.
4.1. Empirical specification: a commodity-specific gravity model
Gravity models have empirically succeeded in explaining trade flows. Numerous studies employ them, and several studies have theoretically justified the use of gravity equations (see Anderson, Reference Anderson1979; Bergstrand, Reference Bergstrand1985, Reference Bergstrand1989, Reference Bergstrand1990, Anderson and Wincoop, Reference Anderson and van Wincoop2003; Baldwin and Taglioni, Reference Baldwin and Taglioni2006; Chaney, Reference Chaney2008; Helpman et al., Reference Helpman, Melitz and Rubinstein2008). According to (7), it is appropriate to base our estimation on a gravity model methodology. The predicted signs of the independent variables are those explained in the previous section. This study applies the Poisson pseudo-maximum likelihood (PPML) model following Tenreyro (Reference Tenreyro2007). Silva and Tenreyro (Reference Silva and Tenreyro2006) identify several problems associated with log-linearization in the gravity model. They argue that the expected value of error also depends on the regressors if the variance of error depends on the regressors (heteroscedasticity). Silva and Tenreyro (Reference Silva and Tenreyro2006) also argue that pairs of countries with zero bilateral exports need to be omitted from the sample as a result of the logarithmic transformation. This requirement can create additional bias. In our estimation, we use the Poisson model.
Our empirical commodity-specific gravity model of waste and scrap is as follows:
 $$\eqalign{B_{IJ} &=A\cdot GDP_I^{\alpha 1} GDP_J^{\alpha 2} N_I^{\alpha 3} N_J^{\alpha 4} RAW_I^{\alpha 5} RAW_J^{\alpha 6} W_I^{\alpha 7} W_J^{\alpha 8} C_{IJ}^{\alpha 9}\cr &\quad\times \exp \lsqb \alpha_{10} BORDER_{IJ} +\alpha_{11} APEC+\alpha _{12} EU+\alpha_{13} V_{IJ}\rsqb \varepsilon_{IJ}\comma \; }$$
where
-
B IJ = value (dollars) of country i’s commodity (waste and scrap) imported by country j Footnote 18
-
GDP I = per capita GDP of exporting country i
-
GDP J = per capita GDP of importing country j
-
N I = population of exporting country i
-
N J = population of importing country j
-
RAW I = total imports of raw materials in exporting country i
-
RAW J = total imports of raw materials in importing country j
-
W I = manufacturing wages in exporting country i
-
W J = manufacturing wages in importing country j
-
C IJ = shortest distance between country i’s commercial centers and country j’s import point
-
BORDER IJ = a border dummy (=1) if countries i and j share a border (=0 otherwise) APEC = a dummy variable (=1) for intra-Asia–Pacific Economic Cooperation (APEC) flows and (=0 otherwise) EU = a dummy variable (=1) for intra-EU flows (=0 otherwise)
-
V IJ = real exchange-rate volatility
-
ɛ IJ = the error term We also conduct another estimation equation: we take GDP
We also conduct another estimation equation: we take GDP as an independent variable instead of per capita GDP and population. For our purpose, it is important to distinguish per capita GDP and population because the former also represents environmental consciousness. However, GDP is also able to measure the market scale simply and directly. Thus, we adopt both types of estimations.
We note that an alternative method considering multilateral resistance of each country to the world (see Anderson and Wincoop, Reference Anderson and van Wincoop2003) is not applicable in our case because the use of exporter-time dummy and importer-time dummy makes country specific variables in each year such as per capita GDP excluded from the specification and testing our main hypothesis non-testable in this study.
4.2. Data
We obtained bilateral export data (constant US$) from the Global Trade Atlas of GTI, Inc. with alternative Harmonized System codes (HS codes). Population and real per capita GDP (constant US$) are, wherever possible, from the Penn World Table. Where these data are unavailable, we use World Development Indicators and the International Monetary Fund's International Financial Statistics. Finally, we specify dummies for landlocked, borders and distance using the US Central Intelligence Agency's World Factbook. Wage data are from LABORSTA, a database of labor statistics compiled by the International Labour Office Bureau of Statistics. This particular gravity data set is the most comprehensive that we know of. The sample period is 17 years, 1995–2011, for all commodity products in our panel data set.
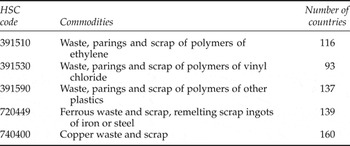
We chose five waste and scrap commodities: (1) waste, parings and scrap of polymers of ethylene; (2) waste, parings and scrap of polymers of vinyl chloride; (3) waste, parings and scrap of polymers of other plastics; (4) ferrous waste and scrap, remelting scrap ingots of iron or steel; (5) copper waste and scrap. The HS codes appear in table 2. We chose these wastes because they fit the objective of this paper: they have large markets in many countries, and international markets for them exist.Footnote 19 The number of countries in our panel sample varies by the waste recycled because of data availability, ranging from 93 to 160 countries. Table 2 indicates the sample size for each waste.
Harmonized system codes of waste and scrap

As discussed in section 3, an increase in the market for final goods may influence the demand and supply of recyclable waste and its corresponding trade flows. Based on our theoretical analysis, we expect that the signs of these independent variables should be positive for waste exporters and importers.
The manufacturing wages of waste-importing countries are important in this study. The coefficient for this variable should be negative if less advanced countries with lower wages import more recyclable waste, and it should be positive if they import less. We could have used variables such as capital stock and the scale of the industrial sector to represent the scales of the recycling and final goods sectors (or the degree of development). We chose wages over those alternatives because of data availability.
Raw materials may be substitutes for recycled materials for any given output of final goods. Thus, we take it as an independent variable to control the estimation. The remaining variables include distance, dummies for APEC and EU membership, and real exchange rate volatility. As in conventional gravity estimation, the expected signs of the estimated coefficients for these variables are negative, positive, positive and negative, respectively.
4.3. Empirical results
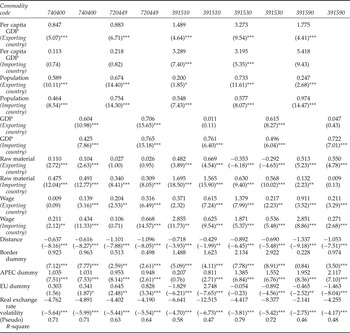
Table 3 provides the estimated results. We adopt the PPML model following Tenreyro (Reference Tenreyro2007) to control sample selection and heteroscedasticity. The PPML estimator allows for the inclusion of zero trade observations. Exporter fixed effect and importer fixed effect are included in our analysis.
Empirical estimates of gravity models

Notes: z-statistics in parentheses.*, ** and*** denote significance at the 0.10, 0.05 and 0.01% level, respectively.
Most estimated parameters have the expected signs and are statistically significant. The results are similar to those of the previous studies that analyzed trade flows using gravity models. Coefficients of population and GDP for exporting and importing countries are positive. Almost all coefficients are statistically significant at 1 per cent confidence.
Coefficients of per capita GDP for exporting and importing countries are also positive. As discussed in section 3, whether the demand effect dominates the environmental consciousness effect is important in determining trade flows. The positive coefficient for waste-importing countries suggests that their demand for final goods strongly influences trade in recyclable waste. However, some of the coefficients for importing countries are insignificant, which also suggests that the environmental consciousness effect can be effective. In particular, some developed countries import few recyclable wastes.
Coefficients for manufacturing wages in the importing country are positive. Almost all of the coefficients are significant at 1 per cent confidence. In general, economic growth and industry expansion lead to higher wages. Because this result can be applied to the group of developing countries, we have shown that the more developed a developing country, the more recyclable waste it imports.
We note that the implications of these positive signs are different from the implications of ordinary gravity estimations for trade in final goods. In the case of trade in recyclable waste, the most serious problem is that the recycling process is separate from other production processes and located in the least developed countries, if it exists. This is a type of pollution haven problem. However, we find no evidence for a pollution haven for wastes and recycling. Our results suggest that recycling sectors are likely to be located along with the production process of final goods.
Our model also analyzes the effect of regional trade agreements by including variables representing trade flows for APEC and EU. We use the distance variable to approximate transportation costs, and we retain the adjacency dummy variable in the empirical model, as there is more trade between countries sharing common borders.
We estimate the effect of exchange rate volatility following Cho et al. (Reference Cho, Sheldon and McCorriston2002) and find that it has a negative and significant effect on the flows of most of the commodities examined. This finding is consistent with the findings of Cho et al. (Reference Cho, Sheldon and McCorriston2002), who suggested that exchange rate volatility impairs trade flows in sectoral trade. However, they also found that the negative effect is commodity specific.
5. Conclusion
This study investigated the factors of both exporting and importing countries that affect the trade volume of recyclable waste. The determinants of this trade are important in terms of both economic benefits and transboundary negative externalities.
In this study, we first provided the theoretical background concerning trade flows of recyclable waste. Next, we provided empirical results using a commodity-specific gravity model of waste and scrap. We found that higher manufacturing wages, larger population size and/or higher per capita GDP in an importing country correspond to greater imports of recyclable waste. In conjunction with our theoretical background, this finding suggests that there is no evidence that recycling sectors expand more rapidly in less advanced developing countries than in more advanced developing countries. Rather, imports of recyclable waste increase with industry expansion/economic growth. This result has implications regarding the gains from trade and the environmental costs generated by wastes exported from developed countries directly to developing countries. When trade in recyclable waste is restricted, it is likely that the decrease in imports by more advanced developing countries is greater than the decrease in imports by less advanced developing countries. Thus, trade restrictions entail significant losses in production efficiency because they make it difficult for more advanced developing countries to procure materials at low prices.
Our empirical results also indicated the possibility that recycling sectors tend to be located in countries where the production processes of final goods are located. We comprehensively included cases of trade when both an exporter and an importer are developing countries. Recyclable waste imported into a developing country from a developed country is often re-exported to less advanced developing countries (Shinkuma and Managi, Reference Shinkuma and Managi2011). Those wastes may cause more serious negative externalities than those traded between developed and developing countries if pollution havens exist. However, in conjunction with the fact that more advanced developing countries import more recyclable waste, we find no evidence for a pollution haven for wastes and recycling.
Unfortunately, we did not consider the microbehavior of waste collectors. It is possible that recycling activity in more advanced countries exhibits increasing returns-to-scale technology. It may also be important to estimate the recycling technology (the supply function of recycled materials). Future research needs to consider these factors. With this extended analysis, policy discussions can progress to determining what types of transboundary movements of waste and scrap should be banned.