Introduction
The authors of Voting (Berelson, Lazarsfeld and McPhee Reference Berelson, Lazarsfeld and McPhee1954) sought to study the dynamic process of how people arrive at their political decisions, emphasizing the need to analyze behavior and opinion over the course of an election season, and ultimately over the course of years and even decades. Panel studies revolutionized the field of political behavior, allowing scholars to ask and answer a much richer set of questions about the development and change of political engagement, and subsequent studies have contributed greatly to our understanding of the dynamics of public opinion, vote choice, and the decision to vote. Yet, we still do not have a full understanding of the microfoundations of change in how people think, feel, and act politically on a daily basis. Advances in survey techniques have significantly reduced measurement error, but ultimately survey questions rely on hindsight self-reports by participants. Furthermore, panel data collection is expensive and difficult, and there is almost always a tradeoff between the number of panel waves and the number of respondents or questions included in a study.
New computational social science techniques, paired with a variety of new data sources, offer the possibility of moving beyond snapshots to a minute-by-minute motion picture of the dynamic political engagement of the American public (Lazer et al. Reference Lazer, Pentland, Adamic, Aral, Barabasi, Brewer, Christakis, Contractor, Fowler, Gutmann, Jebara, King, Macy, Roy and Van Alstyne2009). Scholars interested in studying how people behave politically can come closer to realizing the long-desired goal of characterizing that behavior as it happens—while it happens—in the real world. For the first time, we can capture what people are thinking and talking about with regard to politics as those opinions and conversations are formed. We can examine in fine-grain detail how people respond to the broader political environment, to campaigns and the media, and to their personal social networks. Data generated from sources such as Facebook, Twitter, web searches, and blog postings allow us to directly study how people engage with politics, which mitigates the complications of social desirability bias, the Hawthorne effect, and false recall. Furthermore, the scale of this new data and the ability to study whole populations instead of representative samples frees us from many of the assumptions we are forced to make in parametric data modeling. As a consequence of these benefits, data from social media allow us to study phenomena of interest in the “real world” in a way not possible with more traditional measurement strategies. A fuller understanding of these phenomena requires novel theorizing and substantial empirical analysis; this paper represents a step forward in exploring the possibilities of these data.
We apply these new techniques to a persistent question in the study of political behavior: how does living in a battleground state during a presidential election affect an individual’s engagement with politics? This question has implications for our broader understanding of how the level of political competition in the electoral environment affects individuals’ political behavior. A unique collection of Facebook status updates allows us to study the dynamics of political engagement as it unfolds during the course of an election season. We employ an exact matching procedure, using “battleground” status as the treatment variable, to create a balanced sample of users from politically competitive, or “battleground” states, to users in politically uncompetitive, or “blackout” states. This allows us to better isolate the effect of living in a state where the 2008 presidential election was fiercely contested compared with a state that was essentially ignored by the McCain and Obama campaigns. Users who live in battleground states are more likely to engage with politics on a day-to-day basis during the campaign season than are those users who live in blackout states. This day-to-day engagement—measured in the form of posting political status updates—affects a person’s likelihood of reporting that he or she voted on Election Day. This finding is consistent with the results of prior work (Huckfeldt et al. Reference Huckfeldt, Carmines, Mondak and Zeemering2007; Lipsitz Reference Lipsitz2009), but is the first to use data that does not rely on self-reported survey measures of political interest or engagement.
Literature Review
We first review the literature on the relationship between competition and voting, before articulating the contribution we make related to the theoretical elaboration and empirical measurement of an intervening mechanism that may account for some of the relationship.
The Effect of Competition on Voter Turnout
Early work studying the effects of political competition was primarily concerned with understanding whether certain competitive geographic contexts—usually a state (Patterson and Caldeira Reference Patterson and Caldeira1983), county (Hoffstetter Reference Hoffstetter1973), or congressional district (Silberman and Durden Reference Silberman and Durden1975)—affect voter turnout. Many studies show small but significantly positive effects of competition on turnout, whether competition is operationalized using presidential election results from preceding elections (Ashenfelter and Kelley Reference Ashenfelter and Kelley1975), using the closeness between parties in contemporaneous elections (Patterson and Caldeira Reference Patterson and Caldeira1984), incorporating information about voter registration (Grofman, Collet and Griffin Reference Grofman, Collet and Griffin1998), or from candidate expenditures during the race (Cox and Munger Reference Cox and Munger1989). Scholars have provided three main explanations for the effect: (1) voters are more likely to think their vote matters when an election is perceived as being close; (2) political elites and political parties concentrate their mobilization efforts on competitive races; and (3) more money is spent on campaigns in competitive races, which may indirectly increase voters’ interest or knowledge levels.
Later work shifted focus to the mechanisms driving the relationship between competition and turnout, often focusing on various “campaign effects.” One major approach focuses on campaign effects measured by expenditures on television ads (Freedman and Goldstein Reference Freedman and Goldstein1999; Goldstein and Ridout Reference Goldstein and Ridout2002; Freedman, Franz and Goldstein Reference Freedman, Franz and Goldstein2004; Hillygus Reference Hillygus2005), as more advertising is typically bought in areas that are expected to be more competitive. These studies find that increased exposure to political advertisement is predictive of higher levels of voter turnout. Other studies have focused on the campaigns’ interaction with voters, using survey data to capture the effect of mobilization on voter interest, knowledge, and self-reported turnout (Rosenstone and Hansen Reference Rosenstone and Hansen1993; Verba, Schlozman and Brady Reference Verba, Schlozman and Brady1995; Huckfeldt et al. Reference Huckfeldt, Carmines, Mondak and Zeemering2007). Field experiments demonstrate that direct canvassing can increase voter turnout (Gerber and Green Reference Gerber and Green1999; Gerber and Green 2000Reference Gerber and Greena; Gerber and Green Reference Gerber and Green2000b; Green, Gerber and Nickerson Reference Green, Gerber and Nickerson2003), but much of this work has been done in low salience elections that do not simulate competitive campaign environments (though see Arceneaux and Nickerson Reference Arceneaux and Nickerson2009). Other approaches to measuring the effect of competitive or intensive campaigns include counting the number of field offices in a state (Masket Reference Masket2009) or the frequency of candidate visits (Shaw Reference Shaw1999; Franz and Ridout Reference Franz and Ridout2010); this work, however, focuses on the effects of visits on candidate vote share as opposed to overall turnout.
At the core of these measurement strategies is the idea that residents in competitive areas have qualitatively different exposure to the campaign than residents of non-competitive areas. In presidential elections, the winner-take-all method of allocating Electoral College votes means that certain states become critical in every election and voters living in these “battleground states” receive disproportionate attention from the campaigns (Shaw Reference Shaw2006; Gerber et al. Reference Gerber, Huber, Dowling, Doherty and Schwartzberg2009). It has become common practice to measure competitiveness at the state level with a dummy variable for a state’s battleground status in a particular election year for two reasons. First, there is a theoretical distinction between experiencing a campaign in a state that is highly competitive and a state where the outcome is essentially pre-determined. Second, many other measures of political competitiveness are highly collinear with the battleground measure. For example, previous work has shown that campaign effects are stronger in battleground states, and that battleground states are subject to more television and radio campaign advertising and more candidate visits (Shaw Reference Shaw1999; Hill and McKee Reference Hill and McKee2005; Shaw Reference Shaw2006). The campaigns make more contact with voters in battleground states, and more attention is paid to battleground voters in the form of polling and news stories (Shaw Reference Shaw2006). Finally, using a dichotomous distinction allows us to employ a matching procedure, described in more detail later in the paper, which reduces the possibility that because of our extremely large sample size, we find statistically significant but substantively insignificant results using parametric modeling techniques. This allows us to move closer to the ideal of estimating an average treatment effect for an intervention that we have not randomly assigned, in other words, estimating the effect of battleground state residence on political engagement by ensuring that the samples of individuals in the battleground and blackout conditions are balanced or equivalent along several variables known to be associated with political participation.
The Effects of Competition on Intermediary Political Engagement
To date, the literature on campaign effects has focused primarily on the direct relationship between exposure to competition and voter turnout. Yet, competition may affect a variety of behaviors before Election Day as well, and these behaviors themselves might foster voter turnout. Lipsitz (Reference Lipsitz2009) shows that participation gaps—in voting, meeting attendance, donations, and discussion—between states in the battleground and blackout states are largest in presidential elections that are nationally competitive, and these gaps open up because residents in competitive states become more participatory, not because residents in safe states withdraw from political participation. However, she does not explore possible changes in attitudes that may precede the decision to participate.
Although most scholars agree that people in the battleground states are more engaged with politics by the time of the election, very little attention has been devoted to the process of how and when that increased engagement develops, in part because of a lack of suitable data. A notable exception is the literature on cognitive orientation toward politics. We know that political interest is generally stable over the short and long term (Prior Reference Prior2010). However, it appears that people become more interested and attentive to the political campaign in the battleground states (Hill and McKee Reference Hill and McKee2005; Gimpel, Kaufmann and Pearson-Merkowitz Reference Gimpel, Kaufmann and Pearson-Merkowitz2007; Panagopoulos Reference Panagopoulos2009), and may become more knowledgeable as well (Benoit, Hansen and Holbert Reference Benoit, Hansen and Holbert2004), though not all studies find effects (Wolak Reference Wolak2006). This prior survey-based work cannot account for the fact that one of the effects of living in a battleground state might be to change people’s perceptions that they should care about politics and become more interested in it. Consequently, the higher levels of reported interest may reflect a social desirability bias as much as an actual change in behavior.
Increased Voter Turnout Among the Politically Engaged: Using Facebook Status Updates to Explore the Mediating Role of Day-to-Day Engagement on Self-Reported Turnout
Fundamentally, we are interested in exploring the way that day-to-day engagement with politics mediates the relationship between exposure to political competition and turning out to vote. If living in a battleground state affects turnout via increased cognitive engagement with politics, then we would expect to see a strong relationship between engagement in the campaign season and voter turnout. There is strong support in the literature for this relationship. Decades of work have shown that people who report voting are also more likely to report that they were interested in the campaign, were more likely to seek out information about the election, and were more likely to talk about politics with other people (Campbell et al. Reference Campbell, Converse, Miller and Stokes1960; Leighley Reference Leighley1990; Verba, Schlozman and Brady Reference Verba, Schlozman and Brady1995; Lake and Huckfeldt Reference Lake and Huckfeldt1998; McLeod, Scheufele and Moy Reference McLeod, Scheufele and Moy1999; Plutzer Reference Plutzer2002; Scheufele et al. Reference Scheufele, Nisbet, Brossard and Nisbet2004; Huckfeldt et al. Reference Huckfeldt, Carmines, Mondak and Zeemering2007).
Political scientists have captured facets of this campaign interest in a variety of ways using survey measures—talking to friends and coworkers about politics, watching presidential debates and listening to campaign commercials, or reading a newspaper. Increasingly, however, political engagement has moved online. The Internet has revolutionized the way people engage with the social and political world and, in particular, the growth of social networking websites, such as Facebook, has provided an entirely new forum in which people can be political.Footnote 1
Our reasoning about the mechanism linking contextual competition and turnout does not apply solely to online political engagement, but the social media data available to analyze these questions allow us to study intermediary engagement in a unique way. A collaboration with the Facebook Data Team allows us to analyze user characteristics and engagement in accordance with Facebook’s privacy policies. Facebook is especially suited to the study of people’s daily engagement with politics because of the way it has become integrated into the lives of Internet users of all ages. Unlike other sources of large-scale data, owing to its standardized profile template, which includes information about a user’s age, gender, and education level, Facebook contains enough data about users themselves to incorporate well-established theories—such as the fact that political engagement is correlated with sociodemographic factors and the behavior of people in our social network—into our analysis.
The Pew Internet and American Life project has a thorough repository of information about social media usage over time on representative samples of American adults, although their studies assessing online social networking behavior ask only broad questions during the time period covered in this study. Most of the data in the early reports grouped all online social network sites together. For example, a December 2008 tracking survey found that 35 percent of American adult Internet users reported that they had a profile on an online social network, although there was considerable variation in usage based on age, ranging from 75 percent of 18–24-year olds to 10 percent of 55–64-year olds (Lenhart Reference Lenhart2009).
Social media usage grew immensely in these early years. The only specific data point about Facebook during the study period comes from a May 2008 survey showing that overall 22 percent of adult social network users had a profile on Facebook (Lenhart Reference Lenhart2009), but by October 2010, 90 percent of adults reported having a Facebook profile (Hampton et al. Reference Hampton, Sessions, Rainie and Purcell2011). A study conducted in May 2010 found that 86 percent of 18–29-year olds, 61 percent of 30–49-year olds, and 47 percent of 50–64-year olds were using a social networking site. By 2010, 52 percent of Facebook users engaged with the site on a daily basis, and another 32 percent used the site at least once a week (Hampton et al. Reference Hampton, Sessions, Rainie and Purcell2011). This growth was strongest among the older adults: by 2010, 20 percent of 50–64-year olds were using a social networking site on a typical day, and of those who used them, 44 percent used them on the day before the day they were surveyed (Madden Reference Madden2010).
To best capture the day-to-day engagement in which we are interested, we devise a measurement strategy that captures one facet of the way that people can be engaged with politics on the site: status update posting. Typically, a “status update” is a short note about an activity that the user is engaged in, or how the user is feeling. Many of these updates are explicitly political. Data on this precise behavior during the study period are scant, however. Pew asked people about their “status update” behavior broadly, without referring to Facebook specifically. The December 2008 study found that 11 percent of online American adults shared or viewed statuses, but the wording of the question emphasized Twitter, and made no specific reference to Facebook. By late 2010, Pew reported that on an average day, 15 percent of Facebook users updated their own status and 22 percent commented on their friends’ statuses. Approximately 73 percent of users reported updating their status at least once a week (Hampton et al. Reference Hampton, Sessions, Rainie and Purcell2011). The unobtrusive design of our study grants us access to behaviors that can be difficult to measure with survey questions designed to recall past behaviors or opinions. If Facebook users are affected by politics, it is reasonable to think that they might express that by posting status updates that are political in nature.
Our approach differs from past work that focuses solely on examining campaign interest or political knowledge. First, we are able to measure a political behavior that may not necessarily entail high levels of interest in or knowledge about the campaign or politics. Our threshold here is lower—simply that politics was salient enough to a person to merit comment. Although we imagine that people who post political status updates are more interested in politics (on average), status update posting is conceptually distinct from an online manifestation of campaign interest. A person who posts, “I am so tired of all of these campaign commercials and wish that they would stop” would be coded in our data as having made a political status update (see details below), but this person may not be likely to report on a survey that he is interested in the campaign or may not be able to report anything substantive about the candidates. Second, as opposed to measuring self-reported attitudes or behaviors, we are unobtrusively measuring a behavior itself. Status update posting is a low-cost expressive behavior that can be easily accomplished by both the politically sophisticated and unsophisticated, by partisans and non-partisans, by those with resources and those without. Over-report of behaviors perceived to be socially desirable is a persistent problem in the literature; our unobtrusive measure avoids this problem.
In this article, we use Facebook data to test the extent to which day-to-day engagement with politics, as measured by status update posting, mediates the relationship between exposure to competition and self-reported voter turnout. For a diagram of our theory and operationalization, see Figure 1 in SI. To test the Baron and Kenny (Reference Baron and Kenny1986) mediation model, we must first establish relationships between our key variables. Engagement mediates the relationship between living in a battleground state and self-report turnout if (a) residency in a battleground state significantly predicts engagement and (b) engagement significantly predicts self-reported turnout, controlling for exposure to living in a battleground state. We formalize these relationships in the following hypotheses:
HYPOTHESIS 1: Users in the battleground states are more likely to report voting than those in the blackout states.
HYPOTHESIS 2: In the campaign season, a greater proportion of people living in battleground states will make at least one political status update compared with people not living in the battleground.
HYPOTHESIS 3: Users who have posted political status updates in the campaign season will be more likely to report voting.
HYPOTHESIS 4: Status update posting in the campaign season mediates the relationship between exposure to competition and self-reported voter turnout.
Data and Methods
Sample
A collaboration with the Facebook Data Science Team allowed us to examine status updates posted by users in the 2008 election season to test the hypotheses outlined above.Footnote 2 We restrict the sample to users who had active accounts on January 1, 2008, and who were at least 18 years of age by that date, and we randomly sample 200,000 people from each of ten states. We determine a user’s state of residence based on his or her IP address for the earliest date for which this measure is available, February 15, 2010.Footnote 3 We selected five battleground states and five blackout states for study.Footnote 4
Other scholars studying battleground effects have been able to quantify respondents’ exposure to specific facets of the battleground experience, such as television advertising, candidate visits, or the presence of campaign field offices. Ideally, we would incorporate this more detailed data into our study. However, because we are not able to accurately identify Facebook users’ locations with any more precision than at the state level, we are unable to match users to their media markets, congressional districts, or cities, precluding testing of many of the effects other scholars have identified with more traditional data. We thus choose to use a state’s battleground status as an aggregated indicator of campaign intensity. The battleground states (Florida, Indiana, Missouri, Ohio, and Virginia) were selected because each state received many visits from the candidates, had a large number of field offices, and saw a close final vote total between the two major presidential candidates. The blackout states (California, Kentucky, Louisiana, Massachusetts, and Oregon) were chosen for the opposite reason: they saw very little campaign activity during the 2008 season. However, there is great variation in population size (and thus Electoral College votes), turnout rates, and historical competitiveness within each group of states.Footnote 5 It should be noted that categorization as a blackout state in our data does not imply the total absence of political competition in a state in 2008; important and competitive state-level races and ballot initiatives could certainly have inspired status update posting for users in the sample. However, this should only serve to make it more difficult for us to detect an effect between users living in battleground versus blackout states. We define the pre-campaign season as the period from January 1 to August 24, 2008, the day before the beginning of the Democratic National Convention. We define the campaign season as August 25 to November 3, 2008, which encompasses the conventions through the day before the election. The post-campaign season is defined as the day after the election through January 31, 2009. We divide the study period into these blocks of time because of the qualitatively different nature of the campaign in these time periods and the traditional uptick in campaign activity that occurs starting with the national conventions.
To determine the effect of battleground status on engagement and on voter turnout, we employed an exact matching procedure, using battleground status as the treatment variable. Owing to the large number of respondents in our original data set (two million users), exact matching allows us to maintain precision, whereas avoiding the parametric model assumptions that come with typical regression methods. The sample was matched on age, gender, education level, the total number of status updates posted in the pre-campaign season (coarsened to 20 categories), and the total number of friends on January 1, 2008 (coarsened to 20 categories). These covariates were selected because they could influence the proportion of a user’s posts that are political and could be significantly different between users in the battleground and blackout states. For example, younger people post more status updates and people with a college education are more likely to be engaged with politics. If battleground status is correlated with the age or education level of the population, we would not be able to isolate the effect of political competition from the effects of the demographics of users in the state. Including these variables also controls for a user’s underlying level of engagement with the site.Footnote 6
We utilized MatchIt (Ho et al. Reference Ho, Imai, King and Stuart2007; Ho et al. Reference Ho, Imai, King and Stuart2011), which matches each user in the battleground to all possible users in the blackout that have the same values on the covariates, creating subclasses where each unit in the subclass has the exact same values on the covariates. This procedure reduced the number of users in the sample by ∼5 percent—we were left with 952,923 users in the battleground and 949,124 users in the blackout states for a total of 1,902,047 users.
We then collected all status updates that the users in the matched sample posted between January 1, 2008 and January 31, 2009, encompassing the primary season, the campaign season, and the inauguration of President Barack Obama, a total of 113,660,429 updates. Settle et al. (Reference Settle, Fariss, Bond, Jones, Fowler, Coviello, Kramer and Marlow2011) shows the growth of status update posting over time, both in the number of users who post at least one status update in a given month and in the number of status updates made in the sample. In total, 58,851,519 updates were made by users in the battleground and 54,808,910 updates were made by users in the blackout. Of the original matched sample of 1,902,047 users, 1,439,780 (75.69 percent) posted at least one status update during the study period; 726,590 of 952,923 users (76.25 percent) in the battleground posted an update, whereas 713,190 of 949,124 users (75.14 percent) posted an update in the blackout.
The top panel in Table 6 in SI shows the overall balance between treatment and control groups after the matching procedure. The lower panel of the table shows the balance for those users who posted at least one status update during the study period. These users are slightly younger, slightly more educated, and slightly more engaged with Facebook (i.e., have more friends and post more updates) than are users in the overall matched sample. However, the balance tests reveal that there are only small differences in means between users in the blackout and battleground on the factors that could contribute to political posting—age, gender, education, and general engagement with Facebook.
Quantifying Political Discussion
Automated text analysis is a tool originally developed by computer scientists for the purpose of classifying large numbers of individual documents (Hopkins and King Reference Hopkins and King2010). Content analysis procedures have rapidly advanced in recent years as the scope and scale of data available for analysis has exceeded the limits for which it is feasible to employ human coders (King and Lowe Reference King and Lowe2003; Lyman and Varian Reference Lyman and Varian2003). Here, we employ a machine-learning algorithm in order to determine the predicted probability that a status update is political in nature. More specific details about the process and comparisons to alternative approaches can be found in Settle et al. (n.Reference Settle, Fariss, Bond, Jones, Fowler, Coviello, Kramer and Marlowd.). In brief, we used a collection of 467 million English-language Twitter posts from 20 million users covering a seven-month period between June 1, 2009 and December 31, 2009 (Yang and Leskovec Reference Yang and Leskovec2011). This represents ∼20–30 percent of all public tweets posted on Twitter during this time frame. Of these tweets, 31,000 had been “hashtagged” as “politics,” meaning that the user who posted the tweet believed the topic to be political in nature (#politics). We then trained a machine-learning algorithm on these 31,000 tweets and 31,000 randomly selected tweets that were not hashtagged “politics” in order to identify which words meaningfully distinguished the two types of tweets. Using this dictionary of terms in a logistic regression to predict the hashtag “politics” returned coefficients for ∼1,000 words that were informative in predicting whether a tweet is political. We then coded the predicted probability of “politicalness” for each of the 113,660,429 status updates in the sample, resulting in a politicalness score between 0 and 1. A status update was considered political if it had a score of 0.75 or higher. As shown in Settle et al. (Reference Settle, Fariss, Bond, Jones, Fowler, Coviello, Kramer and Marlow2011), the results conform closely to our expectation: a growing percentage of status updates are political between August and November, with a sharp decline in political speech after the election. The measure is responsive to changes in the political environment, such as important political milestones like the “Super Tuesday” primary Election Day, the day Barack Obama secured the Democratic nomination, and the day of the inauguration.
Importantly, in this paper we focus only on political status updates that do not include emotional language. In other work (Settle et al. Reference Settle, Fariss, Bond, Jones, Fowler, Coviello, Kramer and Marlow2011), we demonstrate that residents of battleground states are more emotional when they post status updates about politics. However, the literature on the role of emotion in political engagement suggests a complex relationship between the experience of emotion and the decision to vote. Research in the Affective Intelligence paradigm has differentiated the effects of negative emotions, and it appears that anxiety and fear as compared with anger have distinct effects on political behaviors (Lerner and Keltner Reference Lerner and Keltner2001; Lerner et al. Reference Lerner, Gonzalez, Small and Fischhoff2003; Huddy, Feldman and Cassese Reference Huddy, Feldman and Cassese2006; Brader, Valentino and Suhay Reference Brader, Valentino and Suhay2008; Druckman and McDermott Reference Druckman and McDermott2008; Valentino et al. Reference Valentino, Brader, Groenendyk, Gregorowicz and Hutchings2011). There is some theoretical consensus that enthusiasm and anger generally increases political participation, whereas anxiety generally deflates political participation but increases interest (Huddy and Mason Reference Huddy and Mason2008), though this pattern has not been replicated in the literature and is not entirely consistent with the original theory. Therefore, we choose to remove all emotional political status updates from the analysis so as not to obscure our theoretical expectations.
Measuring Self-Reported Voter Turnout
On November 4, 2008, Facebook posted a statement at the top of users’ “News Feeds” (the home page that greets users upon entering the site). This update encouraged users to vote and showed a clickable button reading “I Voted.” Of all the users in our sample, 17.28 percent clicked the “I Voted” button. Approximately 49.4 percent of users in our sample logged in on Election Day; of those users who logged in, 35.02 percent clicked the button.
Clicking the “I Voted” button is a measure of self-reported voting. However, unlike more traditional self-report measures where the respondent reports her voting behavior to a survey administrator, in this study, users reported their vote to their social community. Therefore, clicking the “I Voted” button might best be seen as an act of political self-expression, as it is likely to be affected in part by the extent to which a user desires to be seen as a voter by others. Note also that the measure was not based on forced response, meaning that not clicking on the button could either mean that the user did not vote or that they ignored the update.
Although clicking the “I Voted” button as an act of political self-expression is important in its own right, it does not necessarily guarantee that a particular user actually voted. In a separate study utilizing an analogous measure from the 2010 congressional election, we validate the self-report measure with official election records from 13 states (Bond et al. 2012). A comparison between self-reported voting and validated vote in that data showed that the correlation between the two measures is strong and significant (Pearson’s r=0.46, SE 0.03, p<0.01). There was significantly more under-reporting of voting than there was over-reporting of voting.
Measurement Considerations
Tables 7 and 8 in SI report the key proportions of our mediating and dependent variables. All results in the paper focus on user behavior as a proportion of all users in the full matched sample, but the incidence of the behaviors increases when focusing only on users who are generally engaged with the site.
We note an important point that suggest the measurements we employ are valid: our political coding algorithm is well suited to characterize online political communication, and the political algorithm was trained on tweets that are very similar in length and tone to Facebook status updates. We elaborate more on this in Settle et al. (Reference Settle, Fariss, Bond, Jones, Fowler, Coviello, Kramer and Marlow2011).
Results
The exact matching procedure yielded a sample that has perfect balance on selected covariates when population-based weights are incorporated into mean or proportion calculations. This allows us to use weighted means or proportions tests to detect representative differences between users in the battleground and blackout states without relying on parametric regression techniques to control for potential confounding variables. Although “battleground status” was not randomly assigned to users, there should be few remaining differences between our treatment groups on characteristics that could potentially confound the relationship between the treatment and the dependent variables. The study period is divided into five meaningful time periods: from the beginning of the year to the day after Barack Obama secured the Democratic Party nomination; the summer months before the party conventions; between the party conventions and the day before the election; the day of the election; and the period after the election through January 31, 2009.
First, note that about 1 percent more users in the battleground logged in on Election Day compared with users in the blackout. It is possible that exposure to campaign influence in the battleground made people more likely to get online and log in to Facebook.
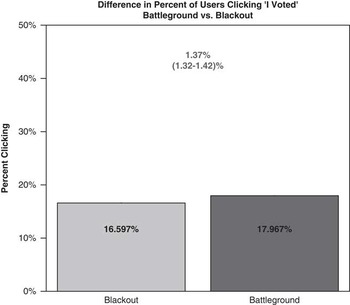
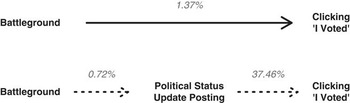
Figure 1 shows that users living in battleground states are about 1.4 percent more likely to have clicked the “I Voted” button. In the language of Baron and Kenny (Reference Baron and Kenny1986), this is the “total” effect. Given a significant main effect of competition, we can proceed to examine the potential mediating role of engagement with politics before Election Day.
The effect of battleground status on the percentage of people clicking the “I Voted” button, out of all users in the matched sample (including those who did not log in on Election Day)

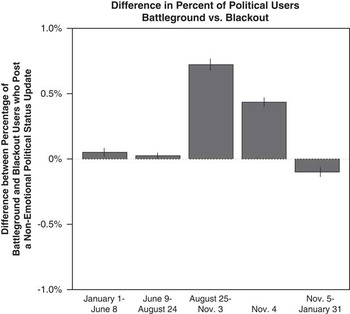
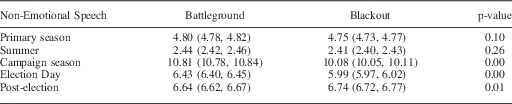
We next examine whether, during the campaign season, users in the battleground states are more likely to talk about politics. Approximately 0.72 percent more users in the battleground states make a non-emotional political status update during the campaign season. These results are plotted graphically in Figure 2 and shown numerically in Table 1. Although the magnitude of the increase in the percent of users who make political posts in the battleground may seem small, this represents ∼7 percent increase over baseline levels of non-emotional political posters in the blackout states.
The effect of battleground status on users’ political status update posting, showing the differences between the percent of users making a political post in the battleground states as compared with the blackout states. Standard errors are plotted.

Percents are measured as the number of unique users who posted one or more political status updates divided by the number of unique users in either the battleground or the blackout
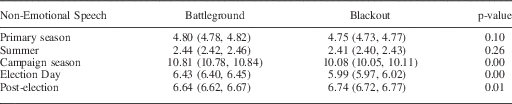
Note: The study period is divided into five meaningful time periods: from the beginning of the year to the day after Barack Obama secured the Democratic Party nomination; the summer months before the party conventions; the campaign season between the party conventions and Election Day; Election Day; and the period after the election through January 31, 2009.
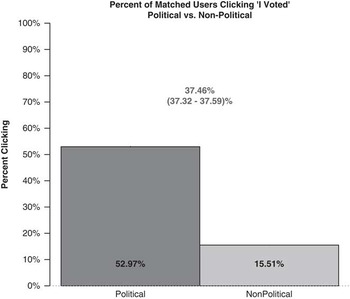
Survey and experimental research suggests quite strong correlations between reported engagement with politics and the decision to vote. We find a similarly strong relationship. People who post political status updates are more likely to click the “I Voted” button—in fact, over half of users who post a single political status update click the “I Voted” button, whereas only about 30 percent of users who do not post any political updates (but do post non-political status updates) report voting. Although there is a slight effect from each additional posted political update, this effect appears to taper off quite quickly (results not shown); however, users who post political status updates are very likely different in several important ways from users who are not likely to post political status updates, including the fact that they are generally more active on the Facebook site. It could be that these other attributes are driving their increased propensity to click the “I Voted” button, instead of a propensity toward political engagement itself.
Therefore, we conducted an additional matching process to isolate the effect of political status update posting on voting. In each process, we match users who post a political status update between August 25 and November 3 to people who do not post a political status update, but who look just like them in age, gender, education, battleground status, the number of status updates they post before August 25, the number of friends they have, and whether they post a non-political status update in the summer. This helps to isolate the effect of engagement on voting, controlling for the treatment status of the respondent.Footnote 7 Posting a non-emotional political status update increases the probability of clicking the “I Voted” button by 37.46 percent. This effect is of large magnitude, especially when considered against the baseline level of voting among those who do not post updates (Figure 3).
The effect of political status update posting on voting, showing the differences between the percent of users posting a political status update compared with those who do not. Standard errors are plotted.

Figure 4 summarizes the main effects needed to calculate the mediation model. The total effect of competition on self-reported voting was found to be 1.37 percent, and to calculate the proportion of the total effect that is mediated through status update posting, we calculate a×b/c. Implementing this calculation, we find a mediating effect of status update posting of ∼19.74 percent (95 percent CI, 18.44, 21.28 percent).
Summary of results in the mediation framework

Discussion
Exposure to increased political competition during the campaign season alters the way that people engage with politics. Residents of battleground states talk about politics more frequently than do residents of states where the presidential campaigns are relatively inactive. This pre-Election Day political engagement mediates a large portion of the relationship between exposure to competition and self-reported voting: users who become more political in their day-to-day lives are more likely to indicate that they turned out to vote. For many users, political discussion on Facebook is likely an “early” event in the chain of decisions to ultimately participate in politics. Increased engagement with politics on a daily basis precedes the effects of competition that have been studied before, such as increased political interest, political knowledge, and voter turnout. Thus, although previous research has focused primarily on the effects of competition on voter turnout or vote choice because of the data that have been available to analyze, our study shows that competition works not only on what happens in the voting booth, but also on the intermediary steps that heighten engagement with the political sphere more broadly. Although our study focuses solely on behaviors that occur within the context of the Facebook site, at least two studies have shown meaningful behavioral change stemming from political activity on Facebook (Ryan Reference Ryan2011; Bond et al. Reference Bond, Fariss, Jones, Kramer, Marlow, Settle and Fowler2012).
The effect sizes reported in this paper are of smaller magnitude than the effects reported in other papers quantifying differences in political activity between battleground and blackout residents. However, the behavior we are measuring here—status update posting—is subject to differences in measurement than other forms of political behavior. The fact that people are exposed to political influences other than what occurs in their state may suppress some of the differences between the two groups of users, making it more difficult to detect effects. Status update posting simply indicates that politics was sufficiently salient to induce a comment, not necessarily that the person is more knowledgeable or interested in politics, and we may not expect this lower threshold behavior to exactly conform to the effect sizes shown by other behaviors. Our measurement technique employing unsolicited responses may also contribute to the smaller effect size, as does the noise introduced by the limitations in our ability to geographically locate individuals. It is also possible that the effects measured in previous studies are subject to social desirability bias, where people who live in battleground states feel more pressure to report political interest or activity, because of the increased salience and importance of politics in areas with competitive elections.
Although the raw differences in the percent of users in the battleground and blackout who post political status updates are of small magnitude, the relative effect sizes are substantive and meaningful, and comparable with other effect sizes found when social media data are used to measure behavior (Bond et al. Reference Bond, Fariss, Jones, Kramer, Marlow, Settle and Fowler2012; Coviello et al. Reference Coviello, Sohn, Kramer, Marlow, Franceschetti, Christakis and Fowler2014). Compared with baseline levels of political discussion in the blackout states, the percent of users in battleground states who make non-emotional political posts is 7 percent higher. These effects, however, diminish outside of the campaign season, suggesting that concern may be overstated that the Electoral College system perpetuates unequal access to political information that has long-lasting implications for political behavior in blackout states.
The effects reported in this paper represent the aggregation of many small influences from living in a battleground state. This analysis raises many further questions about the specific dynamics of the campaign that matter most for political engagement. We can enrich our analysis by modeling which parts of the “battleground” experience are most influential in increasing political discussion, and by adding data about political advertising expenditures, candidate visits, or noteworthy events during the campaign such as debates and scandals. We can also move beyond campaign effects to study how social networks influence political behavior. As our political behavior increasingly shifts online, the potential for information about that behavior to spread through our social networks also increases. There are many more ways now that people can attempt to influence or educate their friends and family about politics. Political discussion is likely to spread through the social network. If an increase in a user’s rate of political status update posting increases the likelihood that his or her friends also post a political status update, the impact of the small difference in posting between battleground and blackout states could resonate to have much larger effects. Political competition encourages users to post political status updates; users’ friends in turn are exposed to the political discussion of their friends, and may be more likely to post political status updates themselves, even if they are not directly exposed to political competition.
Conclusion
Fundamentally, this paper is about the way that variation in the political environment can effect day-to-day changes in how people experience politics, and how those changes may lead to increased political participation. Scholars have quietly assumed that the effects of political competition on distal outcomes like voter turnout must be mediated through smaller and more proximate changes in attitudes and behavior, but this assumption has rarely been explicitly tested. Previous work has demonstrated that competition may induce more knowledge about and interest in politics, but has relied on self-reported measures that may reflect a change in attitude about the social desirability of reporting interest in the campaign. Our study uses a measure that is not subject to a survey participant’s desire to appease a researcher. Furthermore, we show that the mechanism linking exposure to intense campaigning in a battleground state and the decision to turnout may run in part through simple acknowledgment of politics in one’s day-to-day life, a bar far less costly to cross than increased knowledge or interest.
It is important not to lose sight of the potential drawbacks of the approach and weaknesses in this particular study. First and foremost, we encourage the reader to consider generalizability. The population under study here is not representative of the voting age population from the states that were selected for study. Users on Facebook are younger than the population as a whole, which suggests that their turnout and political engagement might be lower than a representative sample, though this may be tempered by the higher education level of Facebook users. In this era, Facebook users and non-Facebook users likely differ in other important ways, as well. However, by 2013, over 100 million Americans use Facebook, out of ∼230 million Americans over the age of 18. Of all adult internet users, 71 percent report using Facebook, including 45 percent of adults aged 65 or older, and 63 percent of Facebook users report using it on a daily basis (Duggan and Smith Reference Duggan and Smith2013). Facebook, while not used universally, is certainly ubiquitous, and a wider swath of the population is engaging with the site every month.
A key variable under study—status update posting—is a behavior that has only existed since approximately 2007. Users have little reason to systematically misrepresent their opinions and statements about politics, and misclassification owing to sarcasm or other challenges probably only add to the noise of our measure without biasing it. It is a form of political engagement, but there has been no systematic research conducted to refine its definition beyond that. As with all measurement strategies, the incidence of the behavior we report (political status update posting) depends on the threshold used to classify it. We suggest that status update posting is a low-cost behavior that may indicate campaign interest or political knowledge, but that can only be interpreted to mean that politics was salient enough to a person to merit comment. In addition to better understanding the meaning of status update posting, future studies should explore the relationship between posting a status update and more traditional measures of political attitudes and behaviors. The growing prevalence of social media in our daily lives suggests that researchers should pay attention to these novel forms of political expression—including status updates, but also forms of expression that rely on non-verbal communication, such as imagery or memes.
This paper is one of the first efforts testing foundational theories about political behavior using large scale, unobtrusively collected data about people’s daily engagement with politics. Incorporating the use of social media into our understanding of the dynamics of political behavior is a new approach, and this paper represents only the beginning of the possible lines of inquiry using this, and other, data sets. The unique aspects of this data—the unsolicited statements of users, the high temporal resolution of update posting, and the sheer number of observations—give us a detailed picture of when and how people are engaged with politics. This approach, as part of the computational social science revolution, offers a new perspective in demonstrating the patterns of political behavior we have studied for decades. These new sources of data can be used to test both established theories and also to generate hypotheses about changes in the way we interact with politics owing to technological advancements in our daily lives.
Acknowledgement
The authors wish to thank Babak Rezaee for his time and help complying with PSRM’s data replication policy.