

For a number of months during her presidential campaign, Hillary Rodham Clinton alleged that her media coverage was harsher and more negative than that of her Senate colleague, Barack Obama. These allegations were notably reflected in a Saturday Night Live skit of a mock presidential debate in which the media were lampooned for their fawning attention to Obama. The skit was widely viewed on the Web after its original airing, and still more after Clinton referenced it during a televised debate with Obama on the eve of the Texas and Ohio primaries. She had already participated in numerous debates, fielding scores of questions from print, television, and radio journalists. Expressing frustration, Clinton asserted that she was repeatedly posed with the first question; she wondered aloud from the debate dais whether the journalists present would “ask Barack if he's comfortable and needs another pillow.”
Clinton's allegation was the culmination of decades, indeed centuries, of the differential treatment of women running for president of the United States. Women presidential candidates tend to receive less press coverage than men, and the coverage they do receive tends to focus disproportionately on their appearance, personality, and perceived underdog status at the expense of their substantive issue positions (Falk Reference Falk2008; Heldman, Carroll, and Olson Reference Heldman, Carroll and Olson2005; Smooth Reference Smooth, Carroll and Fox2006).
Yet Clinton's allegation was not about the relative amount of coverage she was receiving. Nor did it charge any undue focus on her clothing, appearance, or marital status. Instead, Clinton alleged that journalists were being easier on Obama while treating her more harshly in the form of more numerous and tougher questions. Could it be that she was treated fairly on indicators traditionally marked by gender bias in coverage of women presidential candidates—such as coverage amount —while at the same time suffering from coverage that disproportionately portrayed her in a negative light? If so, the dimensions on which to evaluate coverage afforded women and men running for president may be shifting.
We systematically examine 6,600 news articles and editorials from 25 leading U.S. newspapers published during the 2008 presidential primaries and caucuses. A number of breakthroughs are revealed in how the press covered Clinton. On many traditional indicators, Clinton's coverage does not appear biased. Yet these signs of equanimity mask a number of differences related to the words, phrases, and tone of press characterizations of Clinton. Relative to Obama and the other men in the race, Clinton was characterized in a disproportionately negative manner. Implications of these findings—marking both substantial progress on traditional indicators and what appears to be substantial bias on tonal indicators—are discussed.
THE CONTEXT FOR CLINTON
Women candidates for public office have historically suffered in the press on a range of dimensions. Early studies of women's campaigns for the U.S. House of Representatives, U.S. Senate, and governor, for instance, reported that women receive less coverage than men (Kahn Reference Kahn1992, Reference Kahn1994, Reference Kahn1996; Kahn and Goldenberg Reference Kahn and Goldenberg1991). This has been especially true of women running for president (Falk Reference Falk2008). In 2000, for instance, Elizabeth Dole received less press attention than men who were behind her in the polls (Heldman, Carroll, and Olson Reference Heldman, Carroll and Olson2005; although see Aday and Devitt Reference Aday and Devitt2001). In 2004, Carole Moseley Braun, despite having experience in local, state, national, and international politics, “received mostly minor mentions in the press and was an afterthought in most media coverage” (Smooth Reference Smooth, Carroll and Fox2006, 117).
Such disparities may be coming into alignment for subpresidential offices. For instance, Kevin Smith (Reference Smith1997) found much smaller differences in the coverage amounts for women's and men's campaigns in 1994 than did prior studies utilizing data from the 1980s and early 1990s. Dianne Bystrom and her colleagues (Reference Bystrom, Banwart, Kaid and Robertson2004) found that women gubernatorial and senatorial candidates received significantly less press coverage than men in 1998, but significantly more press coverage than men in 2000 (see also Bystrom et al. Reference Bystrom, Robertson and Banwart2001; Jalalzai Reference Jalalzai2006). Unfortunately, these findings stand in stark contrast to those pertaining to women's presidential campaigns.
Attracting press coverage is only a first step for any viable campaign for public office. The substance of that coverage matters a great deal. Unfortunately, coverage of women candidates and elected officials tends to disproportionately mention their appearance, personality, family, and perceived underdog status (Braden Reference Braden1996; Carroll and Schreiber Reference Carroll, Schreiber and Norris1997; Kahn Reference Kahn1996; Norris Reference Norris and Norris1997). At the presidential level, such disparities are especially dramatic. Dole's press coverage emphasized her appearance and personal story (Aday and Devitt Reference Aday and Devitt2001; Heldman, Carroll, and Olson Reference Heldman, Carroll and Olson2005). Moseley Braun was portrayed as an underdog and frequently equated with the other African American in the race, Al Sharpton—despite the fact that he had never held elective office (Smooth Reference Smooth, Carroll and Fox2006; see also Duerst-Lahti Reference Duerst-Lahti, Carroll and Fox2006).
Such coverage is typical for women presidential candidates. Erika Falk's (2008) comprehensive study of eight women who have run for president across three centuries—from Victoria Woodhull and Belva Lockwood to Shirley Chisholm and Patricia Schroeder—reveals persistent patterns of press bias across generations. Consistently, these well-qualified women were portrayed as unviable, press accounts overemphasized their appearance and gender while underemphasizing their issue positions, and they enjoyed less coverage than men who were similarly situated in terms of the polls and other measures of public support.
Might coverage of Clinton's 2008 presidential campaign be different? After all, there is some evidence that gendered patterns of press coverage, at least in terms of coverage amount, may be coming into balance for subpresidential offices. Moreover, Clinton entered the race with a number of advantages not enjoyed by her presidency-seeking predecessors. Her front-runner status, near-universal name recognition, fund-raising prowess, and personal experience as both first lady and U.S. senator were historic. At the same time, these very advantages suggested possible pitfalls. As first lady, Clinton had been “either reviled or lauded for the challenges she posed to traditional femininity” (Anderson Reference Anderson2002, 109). While some applauded her policymaking efforts, others criticized her for being too pushy (Anderson Reference Anderson1999).
The view that “the ex-first lady provokes intense emotions on all sides” (Sullivan Reference Sullivan2005, 34) was widely shared by pundits and journalists; polling data seemed to corroborate it. A Gallup poll conducted in May 2005 estimated Clinton's favorability rating to be 55%, with 39% unfavorable. Closer still was the split in adult Americans likely to cast their presidential vote for Clinton in 2008: 53% told Gallup that they were very or somewhat likely, versus 47% who were not very or not at all likely (Gallup and Newport Reference Gallup and Newport2006, 206).
This image of Americans facing off against each other was reflected in the popular press. Clinton's best-selling autobiography, Living History (Reference Clinton2003), squared off against Rewriting History (2004) by former (Bill) Clinton advisor Dick Morris and other books highly antagonistic toward her.Footnote 1 The blogosphere, a relatively new force in campaign politics (Graf Reference Graf and Semiatin2008), also conveyed the sense of a battle between “pro-” and “anti-Hillary” forces. Like her critics in the popular press, the latter tended to emphasize Clinton's allegedly polarizing nature and “baggage.” By the time she entered the race, she was associated in the public mind with a host of traits—some helpful, some harmful—that might well have shaped her coverage and public perceptions of her candidacy.
Much of the context in which Clinton launched her presidential bid resulted from factors unique to her career trajectory and life story; others had bedeviled women presidential candidates since the nineteenth century (Falk Reference Falk2008). In seeking an “office predicated on masculinity” (Duerst-Lahti Reference Duerst-Lahti2008, 733), Clinton would have to demonstrate her fitness to serve as commander in chief to an electorate that considers men more competent at handling military matters and crises (Alexander and Andersen Reference Alexander and Andersen1993; Huddy and Terkildsen Reference Huddy and Terkildsen1993a, Reference Huddy and Terkildsen1993b; Leeper Reference Leeper1991; Sapiro Reference Sapiro1981/82). Such perceptions are even more pronounced in the aftermath of 9/11 (Lawless Reference Lawless2004). At the same time, Clinton risked being perceived as too strong and aggressive. While these traits are typically sought in U.S. presidents (Duerst-Lahti Reference Duerst-Lahti, Carroll and Fox2006; Lawless Reference Lawless2004), they can pose problems for women seeking the Oval Office. After all, women are often “punished for seeming too dominating” (Duerst-Lahti Reference Duerst-Lahti, Carroll and Fox2006, 29). This had been true for Clinton since she emerged on the national political scene during the 1992 presidential campaign (see Jamieson Reference Jamieson1995, Chap. 2).
Lastly, Clinton faced the daunting challenge of simply “being first.” While the proportion of Americans willing to vote for a qualified woman for president had risen to over 80% by the mid-1990s, these numbers were doubtless inflated by social desirability bias. An experiment by Matthew Streb and his colleagues (Reference Streb, Burrell, Frederick and Genovese2008) revealed that 26% of adult Americans were “angry or upset” about the prospect of a woman president as late as March 2006.
Clinton's portrayal in the press in the months leading up to Super Tuesday would be crucial in her effort to secure the Democratic Party's nomination—an historic effort that ultimately failed. She came closer to the Oval Office than any other woman before her, but failed to seal up the nomination on Super Tuesday and went on to lose narrowly to Obama.
This study examines Clinton's portrayal in the press from Labor Day 2007 through Super Tuesday 2008. Two dimensions of coverage are examined: traditional and tonal. Traditional indicators are those that had vexed all of the women who preceded Clinton on the presidential campaign trail. They include coverage amount as well as mentions of appearance, marital status, gender, personality, and issue positions. Given the coverage historically afforded women presidential candidates, we expected Clinton's coverage to focus disproportionately on her appearance, marital status, gender, and personality at the expense of her issue positions. However, given her status as the front-runner for the Democratic nomination for the bulk of the study period, we did not expect her to suffer from a lack of coverage in the manner of her predecessors.
Tonal indicators include headline tone as well as the mix of positive and negative traits associated with each candidate. In light of Clinton's assertion of a negative press bias, as well as the history of high-profile criticism she had faced from critics over the years, we expected the tone of Clinton's coverage to be disproportionately negative relative to her rivals.
STUDY DESIGN
Articles and editorials covering the 2008 presidential campaign were content-coded from the top-circulating newspaper in all states holding their Democratic nominating contest on or before Super Tuesday.Footnote 2 The Washington Post and the Wall Street Journal were also included to represent leading newspapers of record, bringing the total number of newspapers to 25.Footnote 3 We focus exclusively on newspaper coverage, rather than media coverage in general.Footnote 4
A total of 6,600 individual articles and editorials pertaining to the campaign were content-coded and analyzed.Footnote 5 The data-collection period spanned from September 3, 2007 (Labor Day), through February 5, 2008 (Super Tuesday), in order to study the early characterizations of Clinton and her rivals by leading U.S. newspapers. Prior literature suggests that the press tends to develop consensus frames for individual candidates early in the campaign. These frames endure and shape coverage over the course of the campaign, with important effects on voter perceptions of candidate traits, personality, and fitness for office (Jamieson and Waldman Reference Jamieson and Waldman2003; see also Kiousis Reference Kiousis2005; Kiousis, Bantimaroudis, and Ban Reference Kiousis, Bantimaroudis and Ban1999). These effects are especially pronounced during the primary stage, when “party loyalty is no help in sorting out choices” (Polsby and Wildavsky Reference Polsby and Wildavsky1988). Given that Clinton was the front-runner during the balance of the study period, yet failed to lock up the nomination by Super Tuesday, the print media's characterization of her prior to Super Tuesday warrants comprehensive analysis.Footnote 6
A standardized form was employed to code each article selected for the sample.Footnote 7 A cover sheet documented general information about each article (e.g., total number of sentences, policy issues mentioned etc.). An additional, standardized “candidate sheet” was completed for every candidate mentioned in each article. Candidate sheets recorded whether or not the candidate was mentioned in the headline, whether that mention reflected positively or negatively on her/him, how many sentences were devoted to her/him, and whether her/his appearance, qualifications, policy issues, positive and negative traits, and so on were mentioned.Footnote 8 Among all of the variables coded, headline tone was the most subjective. The Krippendorff's alpha for headline tone was .76, indicating moderate reliability (Hayes and Krippendorff Reference Hayes and Krippendorff2007).
BREAKING THE COVERAGE BARRIER
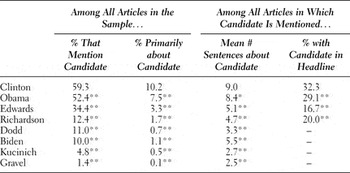
The literature reports that women presidential candidates consistently garner less press coverage than men. Given Clinton's front-runner status during the bulk of the study period, however, we did not expect her to suffer from a lack of coverage. Indeed, she did not. Clinton garnered significantly more coverage than her rivals on every measure of coverage amount (Table 1). She was mentioned in 59.3% of all articles, versus 52.4% for Obama, 34.4% for John Edwards, and so forth. She was also significantly more likely to be the primary subject of each article. Clinton was the primary subject of 10.2% of the articles, compared with 7.5% for Obama and less for the other Democrats.
Amount of coverage

Notes: Col. 1: Data for Clinton, Obama, and Gravel reflect coverage in all 6,600 articles and editorials in the data set (including articles about the Republican nominating contest). Data for the remaining candidates reflects coverage up to and including the last full week in which each was a declared candidate for president. Statistical significance based on difference in proportions tests (two-tailed).
Col. 2: Data for each candidate reflect entire data collection period and the full sample of 6,600 articles and editorials (including articles about the Republican nominating contest). Statistical significance based on difference in proportions tests (two-tailed).
Cols. 3–4: Data for each candidate reflect only articles in which s/he was mentioned during weeks in which s/he was an official candidate for president as follows: Clinton N = 3,905; Obama N = 3,446; Edwards N = 2,011; Richardson N = 544; Dodd N = 510; Biden N = 490; Kucinich N = 281; Gravel N = 89. Statistical significance based on difference in means tests (two-tailed) in col. 3 and difference in proportions tests (two-tailed) for col. 4.
– indicates that data not available for this candidate.
* Difference between candidate and Clinton is statistically significant at p < .05.
** Difference between candidate and Clinton is statistically significant at p < .01.
When Clinton was mentioned in an article, she garnered significantly more “column-inches” than the other candidates. Table 1 indicates that nine sentences were devoted to Clinton on average (in articles mentioning her), versus 8.4 sentences about Obama (in articles mentioning him), 5.1 sentences about Edwards (in articles mentioning him), and so forth. Finally, the last column of Table 1 indicates that Clinton posted the highest rate of headline mentions; she was featured in the headline of nearly one-third of the articles that mentioned her.
Collectively, these data suggest a sharp break from the past in how women presidential candidates are covered. On every indicator, Clinton received the most coverage of all of the Democrats. The commanding amount of coverage she received certainly suggests that reporters treated her as a serious and viable candidate. Notably, there was no significant difference in the rate at which Clinton's electability was questioned in the press versus Obama, Edwards, and Bill Richardson. Electability was questioned less than 3% of the time for each.
HAIR, HUSBANDS, AND HEMLINES
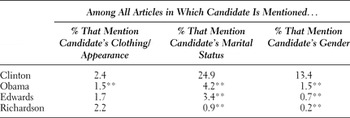
Georgia Duerst-Lahti writes that the press's excessive focus on women candidates' physical appearance and family status has given rise to the “hair, husband, and hemline” problem (2006, 37). The bevy of studies showing that women's press coverage tends to overemphasize their clothing, appearance, and family status led us to expect more of the same in Clinton's coverage. Yet Table 2 indicates that only 2.4% of the articles mentioning Clinton made reference to her clothing and appearance—a rate significantly higher than Obama's but statistically indistinguishable from those of Edwards and Richardson. This suggests very limited support for a gendering of Clinton's press coverage on the “hair and hemline dimension.”
Coverage of appearance, marital status and gender

Notes: Data for each candidate reflect coverage only in those full weeks in which s/he was an official candidate for president (Clinton N = 3,905; Obama N = 3,446; Edwards N = 2,011; Richardson N = 544).
Statistical significance based on difference in proportions tests (two-tailed).
** Difference between candidate and Clinton is statistically significant at p < .01.
The second column of Table 2 suggests possible gendering. Clinton's marital status was mentioned at a rate nearly six times that of Obama. Clinton's husband, however, is a newsworthy former president who was actively campaigning for her. Mentions of the former president were, however, highly correlated with the questioning of Clinton's electability. When Bill Clinton was not mentioned in her articles, Clinton's electability was questioned just 1.7% of the time; when he was mentioned in her articles, Clinton's electability was questioned 5.9% of the time—nearly 3.5 times as often (p < .001). This finding offers support for the popular view that Bill Clinton encumbered Hillary Clinton's presidential aspirations.
Clear evidence of gendered coverage of Clinton is provided in the last column of Table 2. The press was nearly nine times as likely to note Clinton's gender as Obama's. On its face, this finding suggests explicit gendering. Clinton was distinguished as a woman in newspaper accounts of her campaign, while her male competitors were hardly ever distinguished as being male. More troubling is the fact that, like references to her marital status, references to Clinton's gender were significantly correlated with the questioning of her electability. When her gender was not mentioned, Clinton's electability was questioned just 1.8% of the time; when her gender was mentioned, Clinton's electability was questioned 8.8% of the time—nearly five times as often (p < .001). Such articles implicitly cued readers to think that a woman may not be electable to the highest office in the United States because of the fact of her gender.
Notably, Obama's race was mentioned at a slightly higher rate than Clinton's gender (15.3% of the time in articles mentioning him). It was similarly associated with the questioning of Obama's electability. When Obama's race was not mentioned, his electability was questioned just 1.5% of the time. When Obama's race was mentioned, his electability was questioned 10.6% of the time—seven times as often (p < .001). It thus appears that race framed coverage of Obama in a manner problematic for his candidacy. Both race (for Obama) and gender (for Clinton) were associated with questions about each candidate's electability. Detailed analysis of the racial dimension, however, is beyond the scope of this study.
MATTERS OF SUBSTANCE
Given that women presidential candidates have historically struggled to garner press attention for their qualifications and substantive issue positions, we expected Clinton's coverage to similarly lack a substantive emphasis relative to her male competitors. This was decidedly not the case. Clinton's qualifications and issue positions were mentioned at rates commensurate with—and sometimes higher than—those of her rivals. Articles mentioning Clinton made reference to her qualifications for president 12.8% of the time. This rate is statistically equivalent to Richardson's (14.9%) and significantly higher than Obama's (9.0%) and Edwards's (7.7%). Clinton's coverage also included a large dose of issue content. She was linked to issues and policies in 34.5% of the articles mentioning her. This rate was commensurate with those of Edwards and Richardson, and significantly higher than that posted by Obama (30.2%).
The content of this substantive coverage was not altogether helpful to Clinton, however. Health care and the Iraq war were the top two issues associated with Clinton; each also figured as a “top three” issue for her competitors. Yet these issues were portrayed by the press as representing Clinton's biggest failures.
While only 5.7% of the articles mentioning Clinton made reference to a job-related failure, this rate was significantly higher than those of her rivals. Clinton's failed effort at health care reform in the 1990s accounted for 43% of the specific failures associated with her, while her Iraq war vote accounted for a further 28%. Issue-oriented coverage was thus problematic for Clinton. While her frequent association with policy issues underscored the serious treatment of her candidacy, its emphasis on health care and Iraq highlighted what newspapers characterized as her biggest failures.
A CASE OF SPLIT PERSONALITIES
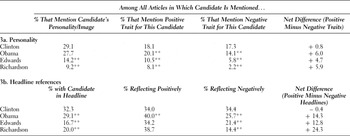
Coverage of women presidential candidates tends to disproportionately emphasize their personalities, as noted previously. We anticipated that the same would be true for Hillary Clinton. We additionally expected Clinton's coverage to be disproportionately negative relative to her rivals. The first panel of Table 3 reveals that Clinton's personality and image were mentioned at an elevated rate vis-à-vis Edwards and Richardson, but not Obama. Aspects of Clinton's and Obama's personality and image were mentioned in nearly three of 10 articles covering them. As the front-runners, Clinton and Obama were likely subject to greater scrutiny. But while their treatment was quantitatively equal, it was qualitatively different.
Personality/image and headline coverage

Notes: Data for each candidate reflect coverage only in those full weeks in which s/he was an official candidate for president (Clinton N = 3,905; Obama N = 3,446; Edwards N = 2,011; Richardson N = 544).
Statistical significance based on difference in proportions tests (two-tailed).
** Difference between candidate and Clinton is statistically significant at p < .01.
Coverage of Clinton's personality and image traits was positive on balance—with 18.1% of her articles referencing positive traits and 17.3% mentioning negative traits, for a net difference of +0.8. Obama, Edwards, and Richardson, however, enjoyed much more favorable trait skews, ranging from +4.7 (Edwards) to +6.0 (Obama). Moreover, Clinton's positive trait references were significantly lower than Obama's, while her negative trait references were significantly higher than all of her rivals.
The same pattern is evident in the headline analysis displayed in the lower panel of Table 3. Headline references to Clinton were balanced, with a net difference of –0.4. However, Obama enjoyed a skew of +14.3, Edwards's skew was +12.8, and Richardson's was +24.3. As with her trait mentions, Clinton's headlines were significantly more negative (34.4%) than those of her competitors. Included were headlines reflecting negatively on her personal traits (e.g. “Obama Says Clinton is Divisive, Calculating”),Footnote 9 her policy positions (e.g. “Rivals Pounce on Clinton's Iran Vote”),Footnote 10 and her standings in the race (e.g. “Poll Suggests Clinton is Vulnerable”)Footnote 11.
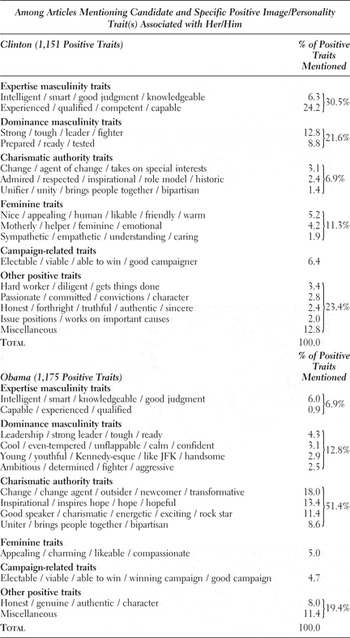
These findings offer support for our tonal hypothesis. Clinton's rivals enjoyed coverage that was decidedly positive while she did not. Tables 4 and 5 provide further support through an in-depth comparison of newspaper treatment of Clinton and Obama. They compare specific negative and positive traits mentioned in relation to each.Footnote 12 Traits were coded by two authors working in isolation. Levels of intercoder agreement at the subcategory level ranged from 84.1% (for Clinton's negative traits) to 90.4% (for Obama's negative traits). In cases of disagreement, the third author was consulted for a final decision. After final codes were assigned, subcategories were collapsed into the broad categories that appear in boldface type.
Content of negative trait mentions

Content of positive trait mentions

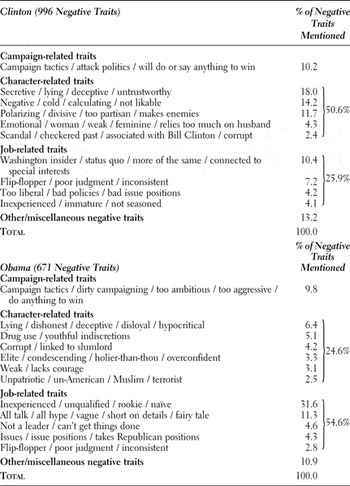
The results in Tables 4 and 5 reveal qualitative differences in the manner in which Clinton and Obama were portrayed in the 25 newspapers in the sample. Negative traits are grouped into three broad categories in Table 4: campaign-related, character-related, and job-related. Roughly 10% of the negative traits mentioned for each candidate were campaign-related and warrant only passing mention. The crux of the difference in their negative characterizations can be seen by comparing the “character-related” and “job-related” categories.
While 50.6% of the negative traits linked to Clinton were character-related and 25.9% were job-related, the opposite is true for Obama. Fully 54.6% of the negative traits linked to Obama were job-related, while only 24.6% were character-related. Thus, not only did newspapers emphasize negative aspects of Clinton's image at a significantly higher rate than Obama's, but the traits highlighted were also far more personal than those endured by Obama.
Examples from articles in the sample illustrate the very different manner in which Clinton and Obama were portrayed. The following passage from the Birmingham News is taken from an article on the Democratic presidential debate held on October 30:
Her critics said Clinton's performance played into a pre-existing caricature: that she is both secretive and calculating in her quest to win. Even the Republican National Committee chairman, Mike Duncan, weighed in to describe Clinton as “scary.”Footnote 13
A New York Times article associated a slightly different set of negative, character-related traits with Clinton, this time citing regular voters:
At several of her campaign events recently, Iowans, even some of her own supporters, publicly asked if she was likable enough to win, and some noted that people found her “cold” and “remote.”Footnote 14
For both candidates, negative trait characterizations tended to appear in articles by way of third-party sources. In the following passage from the Des Moines Register, Clinton herself is the source of the standard “inexperience” charge against Obama:
Without mentioning [Obama] by name, Clinton said the country can't afford on-the-job training for the next president.Footnote 15
The Los Angeles Times quotes a South Carolina retiree on this same job-related point:
Obama “hasn't got enough experience,” he said. “You've got to be dirty to play politics. And he hasn't gotten dirty enough.”Footnote 16
These passages illustrate the key finding to be taken from Table 4: Whereas Obama was largely portrayed as inexperienced, Clinton was largely portrayed as secretive, cold, and even “scary.” Negative portrayals of Clinton were clearly more personal than those proffered to Obama.
Table 5 groups the positive traits mentioned in relation to Clinton and Obama into five broad categories. The first two—expertise and dominance masculinity—were developed by R. W. Connell (Reference Connell1995) and later applied to the U.S. presidency (Duerst-Lahti Reference Duerst-Lahti, Carroll and Fox2006). Expertise masculinity “emerges from capacity with technology or other intellectualized pursuits” (Duerst-Lahti Reference Duerst-Lahti, Carroll and Fox2006, 29). Exemplars include Jimmy Carter, Al Gore, and John Kerry. Traits categorized under the heading “expertise masculinity” include “intelligent,” “smart,” and “experienced.” Dominance masculinity is associated with “dominating, controlling, commanding, and otherwise bending others to one's will … . [It is] often rooted in physical prowess” (Duerst-Lahti Reference Duerst-Lahti, Carroll and Fox2006, 28–29). Exemplars include John F. Kennedy, Ronald Reagan, and George W. Bush. Traits categorized under the heading “dominance masculinity” include “strong,” “tough,” and “tested.”
A number of findings emerge from Table 5. Clinton was portrayed as more masculine than Obama on both masculinity dimensions. Nearly one-third of Clinton's positive trait references suggest expertise masculinity versus only 6.9% of Obama's. This passage from the Las Vegas Review-Journal attributes Clinton's front-runner status to her expertise:
Clinton's knowledge of issues and strong debate performances throughout the primary campaign are among the reasons she is leading her rivals in national and most state polls.Footnote 17
Likewise, 21.6% of Clinton's positive trait references suggest dominance masculinity, versus only 12.8% of Obama's. This passage from the Wall Street Journal uses a prominent third-party source on the right to characterize Clinton as “tough,” a typical dominance masculinity trait:
[Former Republican House Speaker Newt] Gingrich praises Clinton's toughness, noting, “She has not caved in to MoveOn.org” by apologizing for [her] Iraq war vote.Footnote 18
Unfortunately, the masculinity traits that Americans typically prize in their presidential candidates were not necessarily sought by voters in 2008. According to Patricia Lee Sykes (Reference Sykes2008, 762), “polls repeatedly revealed the public searching for a conciliator, not a combatant, to change the Washington partisan battle field.”Footnote 19 Here, Obama had the advantage. We group a number of traits under the broad heading of “charismatic authority.” According to Max Weber (Reference Weber, Roth and Wittich1978, 241), individuals exhibiting charismatic authority are “considered extraordinary and treated as endowed with supernatural, superhuman, or at least specifically exceptional powers or qualities … not accessible to the ordinary person.” Traits categorized as suggestive of charismatic authority in Table 5 include “agent of change,” “inspirational,” “transformative,” “charismatic,” and “uniter.” Such traits account for more than half of Obama's positive trait references, compared with only 6.9% for Clinton.
A front-page article in South Carolina's The State illustrates the lengths to which some journalists went in portraying Obama as charismatic:
[W]hat sets the 46-year-old Obama apart most is how he engages audiences, physically and emotionally. … He seems to hug and shake a crowd at once. On the campaign trail, he has a crisp, resonant voice combined with an easy, self-effacing manner. Tall, slim, with exceptionally long fingers, he juxtaposes a physical sense of calm with disarmingly emotional strings of words. His presence lets him lift a vague stump speech about hope into something that seems much weightier, at least in the moment.Footnote 20
Needless to say, newspaper descriptions of Clinton's most commonly referenced positive trait—her qualifications and experience—lacked such a laudatory tone.
Not only was Clinton not characterized as embodying charismatic authority, but the traits used to describe her may also have cast her in a classic “double bind” (Jameison 1995). While women running for president may feel compelled to be seen as “man enough” for the job, being perceived as “too tough” or “too strong” can backfire. In Clinton's case, the masculine traits used to describe her (52.1% for expertise and dominance masculinity combined) dwarfed both her feminine (11.3%) and charismatic authority (6.9%) trait characterizations.
TONAL DIFFERENCE EXPLANATIONS
As expected, Hillary Clinton's coverage was markedly less positive in tone than Barack Obama's and her other Democratic rivals. Yet this might just be a case of standard front-runner coverage, in which the likely winner faces greater press scrutiny (Graber Reference Graber2006). If so, we would expect the tone of Clinton's coverage to be the most negative when she was highest in the polls and the most positive when she was lowest in the polls.
Our data indicate that national standings partially explain differences in the tone of coverage afforded Clinton and Obama. Support among likely voters was negatively correlated with the tone of Clinton's coverage. When Clinton was highest in the national USA Today/Gallup poll, the tone of her headlines was least favorable, as indicated by a significant correlation of –0.10 (p < .01). This finding is consistent with previous research suggesting that “the substance of stories tends to be favorable for trailing candidates in the race and unfavorable for front-runners” (Graber Reference Graber2006, 222). Meanwhile, Obama's coverage appears to support a related theory: Rising momentum promotes positive coverage (Aldrich Reference Aldrich1980; Bartels Reference Bartels1985). As Obama's poll numbers improved, so did the tone of his headlines, as indicated by a significant correlation of 0.18 (p < .01). Given the size of the correlations, Clinton's front-runner status and Obama's rising momentum appear to only partially explain tonal differences in their coverage.Footnote 21
Market responsiveness is another possible explanation for tonal differences in coverage afforded Clinton and Obama. Research suggests that newspapers serving markets supportive of a particular politician tend to be more supportive of her/him (Barrett and Peake Reference Barrett and Peake2007; Gentzkow and Shapiro Reference Gentzkow and Shapiro2006; Peake Reference Peake2007). If market forces are at work, we would expect newspapers serving markets more supportive of Clinton to cover her more favorably (and Obama less so).
Tonal differences in coverage may also reflect the preferences of each paper's editorial board. Although a proverbial wall ostensibly separates the editorial board from the newsroom, newspapers whose editorial pages support a particular candidate tend to provide news coverage favorable toward that candidate (Barrett and Barrington Reference Barrett and Barrington2005; Kahn and Kenney Reference Kahn and Kenney2002; Page Reference Page1996; Schiffer Reference Schiffer2006). If editorial bias is at work, we would expect newspapers whose editorial boards endorsed Clinton to cover Clinton more favorably (and Obama less so).
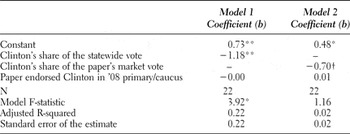
The models displayed in Table 6 test these two possible explanations for tonal differences in coverage. The dependent variable in each is the difference between Obama's and Clinton's average article tone score. Positive scores indicate that an individual newspaper's coverage favored Obama relative to Clinton; negative scores indicate that an individual newspaper's coverage favored Clinton relative to Obama. Newspapers serve as the unit of analysis.
Predicting the difference between Obama's and Clinton's average article tone score (OLS regression).

Notes: The unit of analysis is the newspaper. The Washington Post is excluded because its market had not voted by February 5, 2008. The Wall Street Journal is excluded because it is a national newspaper. The Wichita Eagle is excluded because it published too few articles to construct a tone measure. The dependent variable is Obama's average article tone score minus Clinton's average article tone score. Clinton's share of the two-candidate (Obama/Clinton) vote in a newspaper's state is the primary independent variable in Model 1. Clinton's share of the two-candidate (Obama/Clinton) vote in a newspaper's market is the primary independent variable in Model 2; market is defined as county of each newspaper plus contiguous counties.
† Statistically significant at p <.10 (one-tailed).
* Statistically significant at p < .05 (one-tailed).
** Statistically significant at p < .01 (one-tailed).
In order to test the market responsiveness hypothesis, each model reported in Table 6 includes a measure of market support for Clinton. Model 1 uses her share of the two-candidate statewide vote in each state's Democratic primary or caucus. Model 2 uses a more refined, market-based measure of support for Clinton: her share of the two-candidate vote in the county of each newspaper plus contiguous counties.Footnote 22 In order to test the editorial bias hypothesis, both models include a variable indicating whether or not each newspaper endorsed Clinton.
The newspaper endorsement variable did not prove significant in either model. Thus, there was no support for the hypothesis that newspapers whose editorial boards endorsed Clinton provided her with more favorable coverage relative to Obama.
The market responsiveness hypothesis is supported, however. The significant, negative coefficient on Clinton's share of the statewide vote in Model 1 indicates that as her share of the statewide vote increased, Obama's coverage (relative to Clinton's) became less positive. For example, the model predicts that a newspaper in a state where Clinton won 58% of the two-candidate vote (10 points above her average) would post a tonal difference score of .05, indicating nearly balanced coverage between the two candidates. Meanwhile, a paper in a state where Clinton won 38% of the vote (10 points below her average) would have a predicted tonal difference score of .28, indicating coverage that significantly favored Obama over Clinton.
Model 2 employs a more refined measure of market support for Clinton: Clinton's share of the two-candidate vote in the county of each newspaper plus contiguous counties. The results in Model 2 generally corroborate those reported in Model 1. However, the coefficient on Clinton's share of the newspaper's market vote is only significant at the p < .10 level.
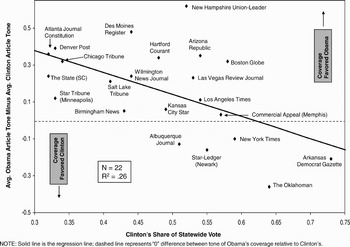
Figure 1 provides a scatter plot of the relationship between Clinton's statewide vote share and the difference between the Obama and Clinton average article tone scores.Footnote 23 The solid line is the regression line; the dotted line represents no difference in the tone of coverage afforded Obama and Clinton. Scores above the dotted line indicate coverage that favored Obama relative to Clinton; scores below the dotted line indicate coverage that favored Clinton relative to Obama.
Clinton's statewide vote regressed on difference between Obama's and Clinton's average article tone scores.

A number of important findings emerge in Figure 1. First, Clinton's hometown papers—the New York Times and the Arkansas Democrat-Gazette—both provided coverage whose tone favored Clinton over Obama. This is not surprising. What is surprising, however, is that only three other papers joined them in offering coverage whose tone favored Clinton over Obama. They are the Albuquerque Journal, the Star-Ledger (Newark), and The Oklahoman. Clinton won the Democratic nominating contests in each of these states.
Second, the majority of newspapers in the sample provided coverage that was more positive in tone for Obama than for Clinton. These papers appear above the dotted line in Figure 1. In some cases, this tonal advantage for Obama was pronounced, as in the New Hampshire Union-Leader and the Des Moines Register—papers whose coverage arguably carried extra weight due to the placement of their state's nominating contests first on the calendar.
Third, the downward slope of the regression line indicates that as Clinton's statewide support increased, the tone of her coverage improved relative to Obama. While tonal differences are not fully explained by market responsiveness—given the adjusted R2 of .26—there is some evidence that the market mechanism was at work.
Taken together, these findings indicate that the tonal disadvantage Clinton suffered vis-à-vis Obama is only partially explained by factors related to Clinton's front-runner status, Obama's rising momentum, and support for each candidate in the markets of each newspaper in the sample. These factors do not fully account for the tonal disadvantage endured by Clinton in the critical weeks leading up to Super Tuesday.
DISCUSSION
This study, encompassing 6,600 articles from 25 leading American newspapers, found both fairness and bias in newspaper coverage of Hillary Clinton's presidential campaign prior to Super Tuesday. Clinton was treated with equanimity on a number of indicators that have traditionally disadvantaged women running for president. Neither her appearance nor her viability was noted disproportionately. Mentions of her qualifications and issue positions clearly indicate that the press treated her candidacy seriously. Moreover, Clinton broke the “coverage barrier” that had hindered women presidential candidates in years past. She garnered headline mentions and column-inches at rates exceeding her Democratic rivals.
These signs of progress are counterbalanced by a number of indicators of bias, however. The rate at which newspapers questioned Clinton's electability—while low overall—was positively and significantly correlated with explicit references to her gender. Moreover, the overall tone of her coverage was negative relative to Obama and the other Democrats in the race. Such negativity likely undermined any benefit she received from garnering the most coverage.
The tone of her negative coverage was also markedly personal. Her negative trait references were much more likely to include character-oriented terms, such as “polarizing,” “unlikable,” and “deceptive.” Such personal, negative trait references were nearly twice as common as job-related, negative trait references for Clinton. Newspapers' negative portrayal of Obama, meanwhile, focused largely on his relative lack of experience. Whereas she was “cold,” “secretive,” and “divisive”—arguably gender-based stereotypes—Obama was “inexperienced.” The latter is certainly a serious negative charge against anyone running for president, but is clearly job-related and unlikely to be construed as a damaging character flaw.
Our analysis of positive portrayals of Clinton is equally troubling. Faced with the classic “double bind” (Jamieson Reference Jamieson1995), women must demonstrate characteristics typically associated with the “masculinized” presidency (Duerst-Lahti Reference Duerst-Lahti, Carroll and Fox2006), while at the same time avoiding labels such as “too aggressive.” Positive press portrayals of Clinton suggest that the fine line may have been crossed. Over half of Clinton's positive trait references qualify as masculine, while only about 10% encompass traditionally feminine traits. Meanwhile, the very charismatic authority traits sought by the electorate in 2008 were largely ascribed to Obama.
We examined several possible explanations for Clinton's disproportionately negative coverage. We found support for the front-runner and market responsiveness hypotheses, but neither fully explains the marked negativity in Clinton's coverage relative to her competitors. Two other explanations warrant consideration, though neither is directly testable using our data. The first concerns the degree to which messages emanating from the campaigns were simply reflected in the coverage. The second concerns the uniqueness of Clinton as a candidate.
To be sure, images portrayed by the press reflect, in part, messages emanating from the campaigns. Campaigns attempt to promote positive images of their candidate; both Clinton and Obama appear to have been successful in this regard. Clinton strove to demonstrate her mettle in terms of both dominance and expertise masculinity. According to Sykes (Reference Sykes2008, 762), she followed the example of Britain's Margaret Thatcher and presented herself as the “strong, experienced candidate capable of tackling tough decisions on war as well as law and order.” This strategy made sense, given that stereotypically masculine traits are deemed more important by voters than stereotypically feminine traits (Rosenwasser and Dean Reference Rosenwasser and Dean1989). However, Clinton's newspaper coverage largely described her using the very traits (“strong,” “tough,” “fighter”) known to be problematic for women (Duerst-Lahti Reference Duerst-Lahti, Carroll and Fox2006).
Obama faced a similar challenge. As the first African American with a real chance of winning a major party's presidential nomination, he too needed to demonstrate traits typically associated with U.S. presidents, such as strength and toughness. However, he risked being racially stereotyped as an “angry black man” if he came across as too tough. This specific challenge for African-American public officials is noted in a recent study of racial stereotypes. A team of Princeton psychologists assert that white voters became comfortable with Obama in part because he avoided showing anger (Fiske et al. Reference Fiske, Bergsieker, Russell and Williams2009). Our findings suggest that newspaper coverage of Obama focused very little on dominance masculinity traits like “strength” and “toughness” that might have triggered such racial stereotypes. Less than 13% of Obama's positive traits can be characterized as such. Instead, newspapers seemed to reflect the positive message emanating from Obama's campaign: his message of hope and change.
Campaign agency must also be taken into account when considering negative portrayals of the candidates. After all, campaigns succeed, in part, when they successfully cast their opposition in a negative light. Obama and Edwards argued that Clinton represented the politics of the past, conveying an image of Clinton as divisive and polarizing. It was evident that a deeply personal, negative portrayal of Clinton dominated during the final debate before the New Hampshire primary. A local journalist told Clinton that surveys suggested that New Hampshire voters were “hesitating on the likability issue [and] … seem to like Barack Obama more.” Clinton gamely responded, “Well that hurts my feelings.” The exchange ended with Obama remarking, “You're likable enough, Hillary.”Footnote 24
A final possibility to consider is whether the negative portrayal of Clinton as unlikable, distant, and cold was simply an extension of a preexisting frame that had been used to describe Clinton since the early 1990s (Jamieson Reference Jamieson1995). This frame was readily available to reporters covering Clinton's presidential campaign. It was easily accessed in numerous “Anti-Hillary” books in the popular press (Klein Reference Klein2005; Limbacher Reference Limbacher2003; Morris Reference Morris2004; Noonan Reference Noonan2000) that offered damaging, visceral characterizations of Clinton. Doris Graber points out that journalists tend to create “stereotypes of the candidates early in the campaign and then build their stories around these stereotypes by merely adding new details to the established image” (2006, 232). Clinton thus entered the campaign with a serious disadvantage: An enduring negative frame already existed about her. It had been developed over the years and could simply be called up by reporters. No such comparable negative frame was ready-made for Obama. We do not mean to suggest that reporters were justified in using this deeply personal, negative frame to characterize Clinton. Quite the contrary. Its use gave voice to harmful gender stereotypes.
One important limitation of our study is its exclusive focus on newspaper coverage. While we do not analyze other forms of media, our findings do resemble those of two studies that analyzed coverage by broadcast and other media outlets. The Center for Media and Public Affairs (CMPA) and the Project for Excellence in Journalism (PEJ) found that Obama's coverage was markedly more positive in tone than Clinton's (CMPA 2008; PEJ 2007). Their analyses of the “master narratives” and traits used to describe Clinton and Obama also yielded findings similar to our own.Footnote 25 A second limitation of our study is its conclusion on Super Tuesday. It is possible that the coverage afforded Clinton and Obama, particularly as it relates to tone and candidate trait characterizations, changed after February 5. Again, the CMPA and PEJ studies—which extended beyond Super Tuesday—tend to corroborate our findings.Footnote 26
Jennifer Lawless cautions researchers to “rely on more than one candidate's experiences and more than one election cycle to determine the extent to which our observations are systemic and systematic” (Reference Lawless2009, 79). Clinton's historic campaign for president represents a single case in a single set of presidential primaries and caucuses whose outcome was doubtless influenced by a host of factors. Heading into the fall campaign, Clinton was the undisputed Democratic front-runner in the polls, had the widest name recognition, and led in early fund-raising. Without these advantages, print journalists might not have been nearly as attentive to her campaign.
Women running for president in the future will not necessarily receive equal coverage in the manner of Clinton—in terms of coverage amount and substantive emphasis—unless they, too, can claim these advantages. The bigger concern, however, is whether women will run for president at all. Perceptions matter. And while Clinton's coverage was voluminous, it was also disproportionately negative relative to the men against whom she was running. Her coverage may have left the impression that the print media treat women unfairly. Certainly our analysis suggests that this was the case in leading newspapers from across the county. Perceptions of bias may discourage women from entering the candidate pool for president of the United States and a host of other elective positions that constitute the pipeline to the White House.
The public did perceive that Clinton was treated unfairly. After her televised reference to Saturday Night Live and repeated suggestions on the campaign trail that Obama was being given a “free pass,” polling organizations began to query the public about perceptions of media bias. On June 5, after Obama had been named the Democratic presidential nominee, the Pew Research Center for the People & the Press (2008) reported that 37% of Americans believed that news organizations had favored Obama versus just 8% who perceived a bias toward Clinton. The findings reported in this study indicate that public perceptions were correct, long before Saturday Night Live spoofed the media.