Introduction
The Palouse agronomic region of northern Idaho and adjoining eastern Washington annually accounts for 10–30% of total United States of America production of dry peas, Pisum sativum Linnaeus (Fabaceae), seeding approximately 40 500 ha with a value around USD 20–30 million (United States Department of Agriculture-National Agricultural Statistics Service 2018a, 2018b). The pea aphid, Acyrthosiphon pisum Harris (Hemiptera: Aphididae), has been the key pest of dry peas in this region for over 60 years (Portman and Manis Reference Portman and Manis1954). Infestations are annually evident in practically every commercial dry pea field in the Palouse, where they reduce crop yield quantity and quality directly by feeding on phloem sap and indirectly as vectors of two viruses that episodically cause widespread regional epidemics – bean leaf roll virus (Virus: Luteoviridae) and pea enation mosaic virus (Virus: Luteoviridae) (Clement Reference Clement2006). Integrated pest management decision guidelines for crop yield damage caused by A. pisum are currently antiquated (last published two decades ago). Homan et al. (Reference Homan, Stoltz and Schotzko1992) advise dry pea producers to apply foliar insecticides in commercial fields when mean density exceeds 30–40 pea aphids per sweep net sample. This static rule-of-thumb is not clearly based on measurements of pea aphid impacts on yield and fails to incorporate the variable economic parameters that determine the profitability of a control action and the relationship between pea aphid density and crop yield. Decision tools are needed based on an empirical yield loss relationship for pea aphids and that incorporate crop market value, cost of control, insecticide efficacy, and crop yield potential that together determine the economic injury level.
Bioeconomic research for pea aphids as direct pests of commercial dry peas is limited in North America to the work of Maiteki and Lamb (Reference Maiteki and Lamb1985a, Reference Maiteki and Lamb1985b), who studied crop susceptibility to A. pisum feeding during various plant growth stages by establishing artificial pea aphid cohorts on caged dry pea plants in Manitoba, Canada. Only flowering through pod development growth stages were susceptible to direct feeding injury as measured by seed yield components; pea aphid infestations during the preceding vegetative stages of plant growth had no effect on seed yield. These authors computed economic injury levels from damage curves (sensu Pedigo et al. Reference Pedigo, Hutchins and Higley1986) established by insecticidal field check methods. Economic injury level values were two to three pea aphids per plant at the beginning of crop flowering or the equivalent from sweep net sampling of 9–12 pea aphids per sweep.
Specific objectives of this research were thre fold:
(1) Experimentally derive damage curves using encaged pea aphid cohorts in small field plots and statistically describe pea crop seed yield as a function of noninfectious (virus-free) pea aphid density during early reproductive growth stages of peas
(2) Compute from these damage curves dynamic economic injury levels that account for variable crop market value, insecticide purchase, application expenses and differences in efficacy among registered insecticide products
(3) Design sampling programme growers can use to implement the estimated economic injury level values. Although our methods were designed to estimate economic injury level values, stated as pea aphid density per plant, for more than one-half century, sweep net sampling has been a standard sampling method for integrated pest management in the dry pea industry in the Palouse region. Hence, we completed this work by converting per-plant densities into sweep net sample size equivalents.
Materials and methods
Pea aphid bioeconomics: field studies
Field infestation studies with caged pea aphids from insectary colonies were conducted during 2009 and 2010 in 2-ha (5-acre) plots of Aragorn dry peas at the University of Idaho Parker Research Farm 3.2 km (2 miles) east of Moscow, Idaho, United States of America. Aragorn is a semi-leafless variety representative of commercial dry pea production in this region. Study sites were seeded on 16 May 2009 and 13 May 2010 at 168 kg per ha (150 lb per acre) on 15-cm (6-inch) row spacing using conventional tillage practices. Seeds were treated with standard commercial rates of fungicides mefenoxam and metalaxyl (Maxim and Apron, respectively; Syngenta Corporation, Wilmington, Delaware, United States of America) and micronutrient molybdenum. Crop cultural methods followed standard commercial practices with two exceptions: there were no applications of commercial insecticides, and herbicide applications were limited to spot-spraying weed patches with glyphosate, clopyralid (Round-Up; Scotts Company LLC, Marysville, Ohio, United States of America; Dow AgroSciences, Indianapolis, Indiana, United States of America), and Stinger (Dow AgroSciences).
The two-year study was restricted to caged 17-day infestations during early reproductive plant growth stages (i.e., stages R201 (enclosed buds) through R207 (pod fill); first petals visible, flowers still closed; Knott Reference Knott1987; Meier Reference Meier2001). Experimental units consisted of 18 adjacent pea plants within a row. Prior to being caged and infested with insectary pea aphids, in 2010, plants were sprayed every three to four days to dripping with insecticidal soap (Garden Safe Brand; 1% active ingredient potassium salts of fatty acids, 99% other ingredients) to eliminate any confounding natural pea aphid infestations. No protective sprays were applied prior to caging the plants during 2009 because plants were free of pea aphids.
Replicates were enclosed by a 92-cm-tall by 80-cm-wide cage comprised of a wooden A-frame covered with “No-see-um Netting” (BioQuip Products, Rancho Dominguez, California, United States of America; www.bioquip.com). This netting has an irregular weave with the largest hole being a 0.4 × 0.6 mm (0.01 × 0.02 in) triangle. Six pea aphid density treatments were imposed: 0, 4, 9, 18, 90, and 270 mixed nymphal and adult apterous pea aphids from insectary colonies released per cage (i.e., 0, 0.22, 0.5, 1.0, 5.0, and [10] 15 pea aphids per plant). The maximum treatment imposed during the 2010 early reproductive growth stage experiment was 180 pea aphids per cage rather than 270 due to low numbers in the insectary colony. The pea aphid densities chosen bracket those densities that have been observed in the study region. Pea aphids used for infesting plants were from a colony that had been field-collected during 2008 and maintained in the laboratory on “Joel” dry peas in a growth chamber at 20 °C with a 16:8 light:dark photoperiod at the H.C. Manis Entomological Laboratory at the University of Idaho (Moscow, Idaho, United States of America). In the laboratory, insectary pea aphids were counted and placed into small containers destined for individual cages and transported to the field. The cages were opened from one side and pea aphids were deposited with a slow sweeping motion to distribute them uniformly among the 18 plants. These initial densities were chosen because a preliminary study during 2008 showed they generated pea aphid infestation densities ranging from noneconomic to severely economic (S.D.E., unpublished data).
Pea aphids were encaged on the plants for a 17-day infestation period. This period was intended to allow for pea aphid population growth and feeding injury over the duration of the early reproductive growth stages of the crop while limiting pest damage to a defined time to allow estimation of preventable yield loss for practical economic injury level calculations. After the 17-day infestation period for each year, the cages were removed and all plants were sprayed to dripping with insecticidal soap to terminate infestation; soap sprays continued as required to prevent subsequent natural populations of pea aphids from causing confounding damage during 2009 and 2010.
The experimental design was a randomised complete block design with four replications of each density treatment during 2009 and five replications of each density treatment during 2010. Blocks and the replications within blocks were each separated by 3 m. Despite the formal randomised complete block design, the goal of this experimental approach was to generate a wide range of pea aphid densities for regression analyses rather than to replicate precise pea aphid density treatments.
The centre 10 plants within each 18-plant experimental unit were reserved for crop seed yield measurement at the end of growing season. The remaining eight plants (four on each end of the replicate) were destructively censused for pea aphids 3, 10, and 17 days after initial infestation. Each census involved opening the cage, cutting and removing two randomly selected plants from the reserved eight plants, and visually counting all pea aphids. The day-3 census provided an estimate of cohort establishment, while days 10 and 17 provided estimates of density changes throughout the experiments.
Pea plant seed yield parameters were measured at crop maturity on 5 August 2009 and 9 August 2010 by clipping the centre 10 reserved plants at soil level and drying within paper bags in an oven at 32 °C for 72 hours. Seeds then were manually threshed from pods. Response parameters for each replicate were total number of seeds, mean weight per seed, total seed weight (designated as yield), and weight of pea seeds that satisfy United States Department of Agriculture #1 grade standards (designated economic yield). Economic yield was determined by sieving seeds through a standard commercial pea seed grading pan with 4.37 mm (11/64 in) oblong holes (Seedburo Equipment Company, Des Plaines, Illinois, United States of America; www.seedburo.com); pea seeds that passed through the sieve do not meet standards for United States Department of Agriculture #1 dry peas, while those retained on the sieve constituted economic yield (United States Department of Agriculture 2014). The parameter economic yield, required to calculate an economic injury level, is based solely on the weight of United States Department of Agriculture #1 dry peas.
Pea aphid bioeconomics: analyses
Relationships between pea seed yield parameters and various expressions of realised A. pisum density per plant were quantified by computing linear and nonlinear regressions among experiments and treatments (JMP version 10.0; SAS Institute 2012). Linear and nonlinear regression residual distributions satisfied assumptions of normality and variance (JMP version 10.0). Each cage provided one yield × density estimate for these regression analyses. Dependent variables were expressed as the mean of 10 plants within a replicate. Two yield variables, field yield and economic yield, were re-expressed as relative values by standardising to the highest yielding control plot. Crop yield potential in the Palouse production region varies from field to field, and re-expression as relative yield allowed the resulting regression models to be applicable to any field condition.
Independent variables for analyses included four-point estimates of pea aphid density per cage: INITIAL pea aphid density encaged per plant (i.e., 0, 0.22, 0.5, 1, 5, [10], and 15), DAY3 mean realised pea aphid density per plant three days post infestation (n = 2 plants/cage), DAY10 mean realised density per plant 10 days post infestation (n = 2 plants/cage), and DAY17 mean realised pea aphid density per plant 17 days post infestation (n = 2 plants/cage).
In addition to using these point estimates of pea aphid density, we reasoned that an expression of pea aphid intensity that integrated pea aphid density with infestation duration might better predict pest impact on pea seed yield. Hence we computed cumulative pea aphid days per cage but re-expressed time (days post inoculation) as pea aphid degree-days during each of the infestation intervals.
At least six different estimates of the lower developmental threshold temperature have been reported for pea aphids (Siddiqui et al. Reference Siddiqui, Barlow and Randolph1973; Campbell and Mackauer Reference Campbell and Mackauer1975; Lamb et al. Reference Lamb, MacKay and Gerber1987). From these six estimates we chose the 2.4 °C value of Siddiqui et al. (Reference Siddiqui, Barlow and Randolph1973) because those pea aphids were collected at a latitude similar to Moscow, Idaho (46.73°N) — Ottawa, Canada (45.42°N) — and so best account for possible latitudinal effects on the lower developmental threshold temperature. We used daily minimum and maximum temperatures recorded on-site at the University of Idaho Parker Farm weather station and computed DD2.4°C using the single sine method calculator at the University of California integrated past management website (www.ipm.ucdavis.edu/WEATHER/index.html).
Cumulative pea aphid days were computed for two time periods: from INITIAL infestation through DAY17 (designated aphid*DD2.4°C 0–17), and from the DAY3 census through DAY17 (designated aphid*DD2.4°C3–17). The former expression overestimates actual pea aphid days if establishment mortality is high, while the latter value better accounts for actual pea aphid days under those conditions. We used the trapezoidal rule to compute realised pea aphid days per cage as:
 $$\eqalign{{\rm {aphid}} \ast{\rm{D}}{{\rm{D}}_{2.4^\circ {\rm{C}}}}_{\,0 - 17} \cr = \left[ {\left( {{\rm{INITIAL}} + {\rm{DAY}}3/2} \right) \left( {{\rm{D}}{{\rm{D}}_{2.4^\circ {\rm{C}}}}_{\,0 - 3}} \right)} \right] \cr + \left[ {\left( {{\rm{DAY3}} + {\rm{DAY}}10/2} \right)\left( {{\rm{D}}{{\rm{D}}_{2.4^\circ {\rm{C}} \,\;3 - 10}}} \right)} \right] \cr + \left[ {\left( {{\rm{DAY}}10 + {\rm{DAY}}17/2} \right)\left( {{\rm{D}}{{\rm{D}}_{2.4^\circ {\rm{C}}\,\,10 - 17}}} \right)} \right]$$
where INITIAL, DAY3, DAY10, and DAY17 are pea aphid densities per plant as initially released or as observed 3, 10, and 17 days post infestation, and DD2.4°C are degree-days during those time intervals. Values for the variable aphid*DD2.4°C 3–17 were computed by excluding from the prior equation the terms for the interval INITIAL to DAY3.
Pea aphid sampling programme: field studies
We sampled natural populations of pea aphids in small field plots at the University of Idaho Parker Research Farm 3.2 km east of Moscow, and at the University of Idaho Kambitsch Research Farm 19.3 km south of Moscow. The Parker Research Farm study site was seeded with ‘Aragorn’ dry peas on 6 May 2011 at 168 kg per ha on 15-cm row spacing, while Kambitsch Research Farm study site was seeded with ‘Aragorn’ dry peas on 19 May 2011 at 140 kg per ha on 25-cm row spacing using conventional tillage practices. Seeds were treated with standard commercial rates of fungicides mefenoxam and metalaxyl (Maxim and Apron, respectively; Syngenta Corporation) and micronutrient molybdenum. Crop cultural methods followed standard commercial practices with two exceptions: there were no applications of commercial insecticides, and herbicide applications were limited to spot-spraying of weed patches with glyphosate and clopyralid (Round-Up and Stinger, respectively; Scotts Company LLC and Dow AgroSciences).
Sampling began when plants reached the early vegetative growth stage (stage V105; Knott Reference Knott1987; Meier Reference Meier2001; 15 (five nodes)) on 7 June 2011 at Parker and on 14 June 2011 at Kambitsch; sampling continued every three to six days until the late reproductive growth stage (stage R207; Knott Reference Knott1987; Meier Reference Meier2001; 89 (pod fill)) on 28 July 2011 at Parker and on 2 August 2011 at Kambitsch (Knott Reference Knott1987; Meier Reference Meier2001). This sampling protocol generated 27 observations – 14 dates from the Parker study site and 13 dates from the Kambitsch study site.
The sampling universe at Parker was a 1-ha square plot within a larger 2-ha field, while the sampling universe at Kambitsch was a 46 × 6-m rectangular plot. Sampling involved two methods: (1) nondestructive visual counts of pea aphids on randomly selected plants and (2) random sweep netting with a standard 38-cm insect sweep net (BioQuip Products; www.bioquip.com). A random number generator was used to assign sampling areas within each sampling universe. Visual count sample unit size was one randomly selected plant; sample size was 100 units (plants) each date. Sweep net sample unit size was 25 180-degree sweeps across two rows, and sample size was five units (i.e., 125 total sweeps) each date. Pea aphids captured in the net were counted and recorded in the field. Sampling always began with plant visual inspections, so as to minimise pea aphid disturbance when sweep netting.
Pea aphid sampling programme: analyses
Each sampling date generated two summary statistics: mean number of pea aphids per plant and mean number of pea aphids per 25 sweeps. Relationships between these parameters were quantified by computing linear and quadratic regressions (PROC REG, PROC GLM; SAS version 9.2; SAS Institute 2012). The goal was to derive a statistical model that could be used to convert mean pea aphids per plant into estimates of sweep net sample means and so directly express economic injury level values in terms of either sample unit.
Results
Pea aphid bioeconomics
There were substantial statistical differences (F 1,52 = 4.03; P < 0.05) between years (one-way analysis of variance) in nearly all yield parameters (relative yield, relative economic yield, total seeds, and weight per seed) and for all expressions of A. pisum density and intensity (INITIAL, DAY3, DAY10, DAY17, aphid*DD2.4°C 0–17, and aphid*DD2.4°C 3–17). Exceptions were yield and economic yield, which did not differ between the 2009 and 2010 experiments. Though there were statistically significant differences between years in numerous yield parameters and all expressions of A. pisum density, our main goal was to obtain a wide variation of A. pisum density levels and yield parameters, thus describing the entirety of the damage curve.
Linear and nonlinear regression analyses for all replicates during both years (n = 52) yielded 72 models. Of the 72 models, 57 were statistically significant (P > F < 0.05). Linear regression analyses had r2 values ranging from 0.00 to 0.68, while nonlinear analyses had r2 values ranging from 0.02 to 0.69 (Supplementary Tables 1–2). We further used the combined means of replicates in all years and among all densities (six treatments × two years; n = 12) to improve model accountability and reduce mean squared error terms for both linear and nonlinear regression analyses (Tables 1–2). On average r2 values doubled for both linear and nonlinear regression analyses, all while reducing mean squared error terms. These models were used to select the best-fit model, whether it was linear or nonlinear, for deriving current economic injury level values.
Results of linear regression analyses y = a + bx for relationships between dry pea crop yield parameters (y) as a function of pea aphid density (x) during the 2009 and 2010 early reproductive growth stage infestation experiments, Moscow, Idaho.

a DAY3, DAY10, and DAY17 are number of pea aphids censused from two plants per A-frame 3, 10, and 17 days post infestation; aphid*DD2.4°C 3–17 is the cumulative aphid:degree-days above 2.4 °C from DAY3 through DAY17; aphid*DD2.4°C 0–17 is the cumulative aphid:degree-days above 2.4 °C from INITIAL through DAY17.
b Relative yield is the total weight of all seeds from each A-frame, standardised to the highest yielding control plot (0 pea aphid infested).
c Relative economic yield is the total weight of #1 grade seeds from each A-frame, standardised to the highest yielding control plot (0 pea aphid infested).
d MSE, mean squared error.
Results of quadratic regression analyses y = a + bx + cx 2 for relationships between dry pea crop yield parameters (y) as a function of pea aphid density (x) during the 2009 and 2010 early reproductive growth stage experiments, Moscow, Idaho.
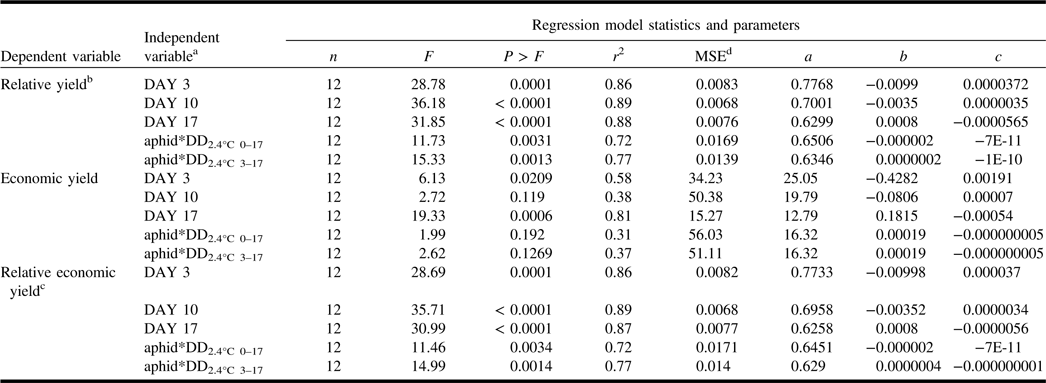
a DAY3, DAY10, and DAY17 are number of pea aphids censused from two plants per A-frame 3, 10, and 17 days post infestation; aphid*DD2.4°C 3–17 is the cumulative aphid:degree-days above 2.4 °C from DAY3 through DAY17; aphid*DD2.4°C 0–17 is the cumulative aphid:degree-days above 2.4 °C from INITIAL through DAY17.
b Relative yield is the total weight of all seeds from each A-frame, standardised to the highest yielding control plot (0 pea aphid infested).
c Relative economic yield is the total weight of #1 grade seeds from each A-frame, standardised to the highest yielding control plot (0 pea aphid infested).
d MSE, mean squared error.
The most important yield parameter for integrated pest management decision making is economic yield, the weight of United States Department of Agriculture #1 dry peas. Regression models with the greatest utility for computing economic injury level values are those that allow calculation of preventable loss, expressed as relative economic yield as a function of a pest infestation metric at a specific point in crop development. Thus, the expressions DAY10, DAY17, aphid*DD2.4°C 0–17, and aphid*DD2.4°C 3–17 have lower use than INITIAL and DAY3, which provide an unambiguous estimate of preventable loss. The former four expressions confound damage that has already occurred from pea aphid feeding prior to the sample date with subsequent damage occurring after the sample date.
Between models based on INITIAL and DAY3 samples, DAY3 provided the least variable model. The initial portion of the damage curve is critical to the calculation of economic injury level values because profit margins for agricultural enterprises often justify pest control action at relatively small pest densities (Rosenheim et al. Reference Rosenheim, Parsa, Forbes, Krimmel, Law and Segoli2011). That situation is true for dry pea producers in the Pacific Northwest of the United States of America where current conditions (i.e., 36 cwt/ha crop yield potential, USD 25–30/ha insecticide purchase and application, USD 16.00/cwt crop market value) justify integrated pest management action if it prevents 4.2–5.0% yield loss. Our resulting model was:
 $$y = 0.7733-0.00998x + 0.000037{x^2}$$
 $$\eqalign{\scale98%{( {n = 12;F = 28.69;{r^2}} = 0.86;\hskip 8.7pc {}}\cr {{\scale98%{P > F = 0.0001;{{\rm{mean\;squared\;error}} = 0.00822} )\hskip 3.3pc }$$
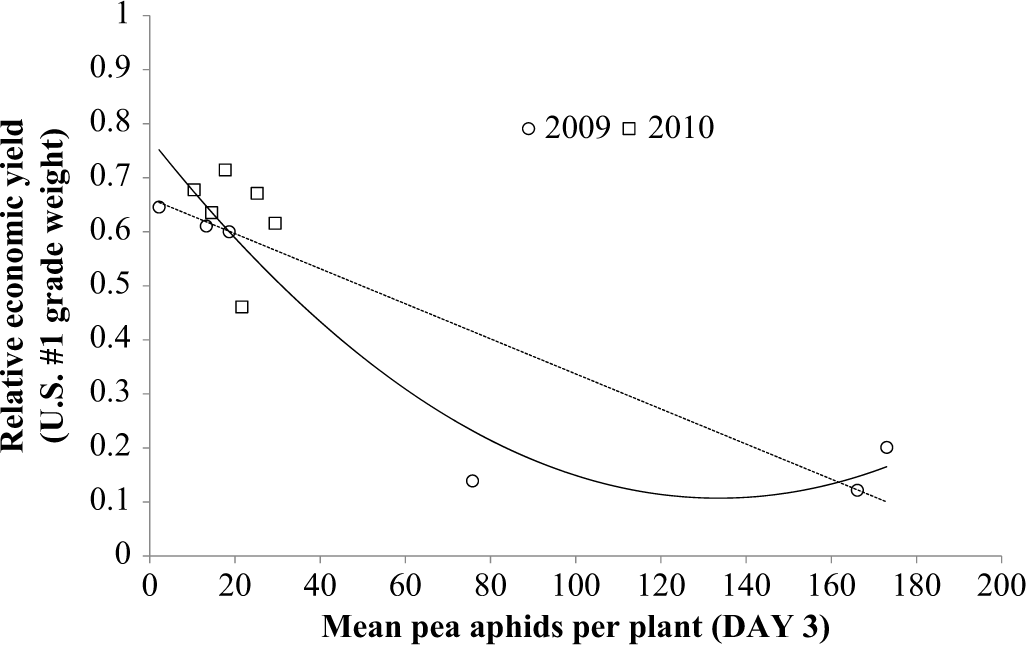
where y is relative economic yield (i.e., relative weight of United States Department of Agriculture #1 dry peas) and x is pea aphid density per plant three days (DAY3) after initial encagement (Fig. 1). This quadratic model further reduced variation, compared with the linear model, in predicted yield and so was adopted as the basis for computing economic injury levels.
Linear (y = −0.0032x + 0.6614’ r² = 0.76; n = 12; P > F = 0.0002) and quadratic (y = 0.7733 − 0.00998x + 0.000037x 2; r² = 0.86; n = 12; P > F = 0.0001) regression models y = a + bx (dashed line) and y = a + bx + cx 2 (solid line) from the 2009 and 2010 reproductive plant growth stage experiments for the relationship between relative economic yield (y) and mean pea aphids per plant on the DAY3 (x) census. Each data point is the standardised mean weight of the United States Department of Agriculture #1 dry pea seeds from 10 plants per A-frame cage and mean aphid density from two plants per A-frame cage as censused three days after initial cohort encagement, Moscow, Idaho.
Calculation of economic injury level values began by equating costs of pest control with the benefits of pest control, where benefits are the value of crop yield loss that can be prevented with a control action (Southwood and Norton Reference Southwood and Norton1973; Pedigo et al. Reference Pedigo, Hutchins and Higley1986). The amount of yield loss per pea aphid is given as:
 $$D{\rm{ \,=\, }}\left( {{Y_{\rm{0}}}{\rm{\,-\, }}{Y_A}} \right){Y_{\rm{p}}}$$
where D (damage coefficient) is the amount of preventable yield loss per hectare (cwt/ha), Y 0 is relative economic yield (cwt/ha) when pea aphids are absent, YA is relative economic yield (cwt/ha) when pea aphids are present, and Yp is yield potential (cwt/ha) at a specified field site. Because relative economic yield is given by the quadratic model, the terms Y 0 and Y A in the previous equation can be re-expressed as:
 $$D{\rm{ \,=\, }}a{\rm{ \,-\, }}bx{\rm{ \,+\, }}c{x^{\rm{2}}}{\rm{\,-\, }}\left( {a{\rm{ \,-\, }}bx{\rm{ \,+\, }}c{x^{\rm{2}}}} \right)$$
for pea aphid densities x = 0 and x > 0. Multiplication by crop market value (V, USD/cwt), yield potential (Y p, cwt/ha), and control efficacy (K “killing power”, proportional reduction in pest density following an insecticide application) gives the value of preventable economic yield loss (D $) as:
 $${D_{\rm{\$ }}}{\rm{ \,=\, }}\left( {bx{\rm{ \,-\, }}c{x^{\rm{2}}}} \right){Y_p}VK$$
Equating this term (D $) with control costs (C, USD/ha purchase + application expense) gives:
 $$C{\rm{ \,=\, }}\left( {bx{\rm{ \,-\, }}c{x^{\rm{2}}}} \right){Y_p}VK$$
Solving for x, A. pisum density, results in the economic injury level equation:
 $$EIL = {{ - \left( { - YpVKb} \right) + \sqrt {{{\left( { - YpVKb} \right)}^2} - 4\left( {YpVKc} \right)\left( { - C} \right)} } \over {2\left( {YpVKc} \right)}}$$
where economic injury level is the pest density at which the costs of control (USD/ha) equal benefits of control (USD/ha).
Given the quadratic model parameters b = −0.00998 and c = 0.000037 from our regression model, we computed economic injury level values by specifying yield potential (Yp) as 36 cwt/ha United States Department of Agriculture #1 dry peas per hectare and then substituting various values for control action costs (C, USD/ha) and crop market values (V, USD/cwt) (Painter Reference Painter2009; Patterson and Painter Reference Patterson and Painter2010; Matthews and Kurtz Reference Matthews and Kurtz2011). For simplicity, insecticide control efficacy was assumed to be 100% (i.e., K = 1.0). The resulting values (Table 3) ranged from five to 19 pea aphids per plant at the beginning of crop reproductive growth (i.e., stage R201; Meier (Reference Meier2001) 59; Knott Reference Knott1987; Meier Reference Meier2001). Under current production and market conditions (V = USD 16/cwt; C = USD 25–30/ha), the economic injury level is three to five pea aphids on average per plant at the beginning of crop reproductive growth (Table 3).
Economic injury levelsa stated as pea aphids per plant at the start of plant reproductive growth.
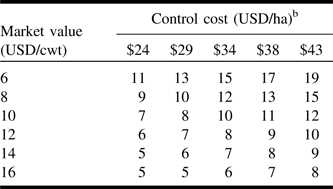
a Economic injury level calculations assume 36 cwt/ha yield potential and insecticide efficacy = 1.0; computed values were rounded up to the next whole number for ease of use.
b Control cost = insecticide purchase price + field application expense.
Plant inspection and sweep net sampling during 2011 generated a wide range of pea aphid density estimates. Observations ranged from zero to 126 pea aphids per plant and from zero to 612 pea aphids per 25 180-degree sweeps. As is typical in the Palouse region, maximum densities during 2011 were observed from mid-July through early August during early reproductive growth stages.
Pea aphid sampling programme
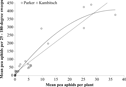
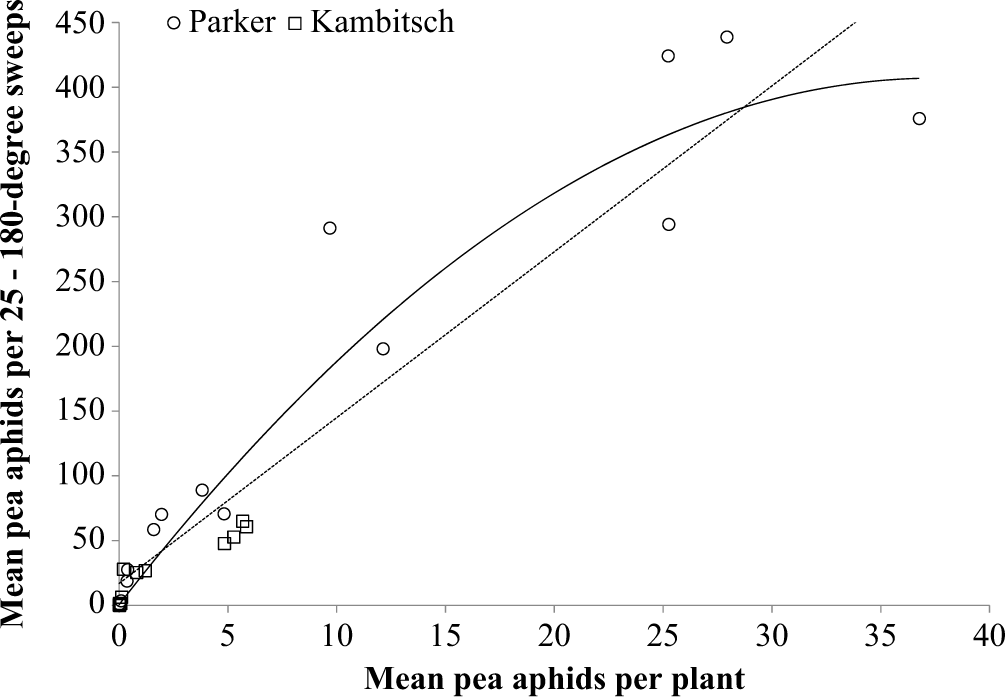
Regression analyses generated highly accountable linear and quadratic models for the relationship between pea aphid density from sweep net sampling and visual census counts from plant inspections (Fig. 2); the r2 values show that relatively little variability in sweep net density estimates remains to be explained by factors other than absolute pea aphid density per plant. Both models have logical limitations. The linear model y = 16.899 + 12.803x nonsensically predicts that sweep net sampling captures approximately 17 pea aphids per 25 sweeps when no pea aphids occur on plants, and the quadratic equation y = 0.514 + 21.653x − 0.288x 2 predicts that sweep net density increases as a function of absolute density up to 37.6 pea aphids per plant and thereafter decreases to zero pea aphids per 25 sweeps at 75.2 pea aphids per plant. Nonetheless, one arguably could use either the linear or quadratic model with confidence, but over the observed range of the data, the quadratic model minimises illogical predictions while maximising accountability. Re-expression of economic injury level values in Table 3 from pea aphids per plant into pea aphids per 25 sweeps with the quadratic model, y = 0.514 + 21.653x − 0.288x 2, gives the economic injury level values as pea aphids per 25 sweeps (Table 4). Insecticide application is justified in dry peas if sampling detects 86–307 pea aphids per 25 sweeps at the beginning of the plant reproductive growth.
Linear (y = 16.899 + 12.803x; r² = 0.89; n = 27; p > F = < 0.001) and quadratic (y = 0.514 + 21.653x − 0.288x 2; r² = 0.92; n = 27; P > F = < 0.0001) regression models y = a + bx (dashed line) and y = a + bx + cx 2 (solid line) for the relationship between mean pea aphids per 25 sweeps (y) and mean number of aphids per plant (x) at the University of Idaho Parker Farm and Kambitsch Farm from 7 June to 2 August 2011. Each observation is the mean of 100 plant inspections and 125 sweeps.
Economic injury levelsa stated as pea aphids per 25 sweeps at the start of plant reproductive growth.

a Economic injury level calculations assume 36 cwt/ha yield potential and insecticide efficacy = 1.0; values were computed from pea aphid per plant rounded up to the next whole number for ease of use.
b Control cost = insecticide purchase price + field application expense.
Discussion
The economic injury level values derived here provide commercial dry pea producers and pest management advisors with research-based alternatives to nominal guidelines that have been recommended without change by the University of Idaho Extension for well over 60 years (Portman and Manis Reference Portman and Manis1954; Homan et al. Reference Homan, Stoltz and Schotzko1992). Those guidelines in turn seem to have been based on still earlier work in Wisconsin, United States of America, on green canning peas by Dudley and Bronson (Reference Dudley and Bronson1943), who advised in their United States Department of Agriculture’s Farmers Bulletin: “an infestation that yields 30 to 40 aphids per sweep of the insect net, or of one aphid per plant on plants too small to be swept, constitutes a menace that either should be treated immediately (with rotenone) or should be carefully watched for further developments.” Given all the intervening changes in crop production practices, integrated pest management technology, and market conditions, it is remarkable that commercial pea producers in the Pacific Northwest have used those nominal values without change for so long. Their longevity speaks both to the value that growers give to simple, easily-understood integrated pest management advice as well as the difficulty of conducting bioeconomic research that describes relationships between pest density and crop damage. Problematically, as discussed below, the published nominal thresholds are high and potentially allow economically preventable yield loss to occur.
The economic injury levels in Table 2 include the range of values derived > 30 years ago by Maiteki and Lamb (Reference Maiteki and Lamb1985b) (i.e., 9–12 pea aphids per sweep, 225–300 pea aphids per 25 sweeps), but the similarity would seem to be coincidental because the former are based on the weight of United States Department of Agriculture #1 dry peas, while the latter were derived from the weight of a 1000-seed sample. Maiteki and Lamb (Reference Maiteki and Lamb1985b) reported that linear models best describe dry pea crop yield response to pea aphid feeding, though their only statistically significant model was for the yield parameter 1000-seed weight; no other yield parameter (including total seed weight per unit area, or weight of #1 weight dry peas) was affected by pea aphid feeding in their studies. Work here showed that seed size, seed number, as well as individual seed weight and total economic yield all declined as nonlinear functions of pea aphid density. Furthermore, since the 1980s there have been numerous changes in crop production practices, market conditions, pesticide research, pesticide resistance management, integrated pest management, and dry pea varietal selection. All of these factors should be taken into consideration when making a dynamically evaluated and economically viable pea aphid control decision as a dry pea producer.
Statistical description of the damage curve allows calculation of economic injury level values for any desired combination of crop yield potential, market value, insecticide efficacy, and control cost. Growers readily can establish values for the first three parameters by consulting their own on-farm field records, local agribusinesses, or regional cost–return price estimates compiled by the University of Idaho Extension, such as those of Painter (Reference Painter2009) and Patterson and Painter (Reference Patterson and Painter2010). Values for insecticide efficacy (K) are not directly available but can be computed from small-plot field experiments that quantify pest density following insecticide application. At least six such studies of pea aphid control in dry peas with 10 different commercially available active ingredients have been published since 1997 from field work in Idaho and Washington, United States of America (Bragg and Burns Reference Bragg and Burns1998, Reference Bragg and Burns1999, Reference Bragg and Burns2000a, Reference Bragg and Burns2000b; Eigenbrode and Ding Reference Eigenbrode and Ding2005, Reference Eigenbrode and Ding2006). Expression of post-application pea aphid density as a proportion of pea aphids in untreated plots from those six studies gives mean K values from 0.09 for insecticidal soap (i.e., 9% kill) to 0.96 for bifenthrin (i.e., 96% kill). Whereas entomologists often ignore the parameter K by assuming producers never use integrated pest management technology that is < 100% effective (K = 1), the K values computed here show that failure to account for actual insecticide effectiveness results in economic injury levels that overestimate the value of preventable yield loss up to 91% and so advise pest control action when it is not profitable.
Given the dynamic nature of these economic injury level calculations and all their possible permutations, the process best can be delivered to intended users as an online integrated pest management decision aid (e.g., University of Idaho Legume Virus Project Aphid Tracker; www.cals.uidaho.edu/aphidtracker) that allows growers and advisors to customise calculations for their specific financial conditions. Dry pea crop responses to pea aphid feeding injury vary with seasonal precipitation and temperature (Maiteki and Lamb Reference Maiteki and Lamb1985b), as well as among dry pea cultivars and varieties (Soroka and Mackay Reference Soroka and Mackay1990; Howard and Garland Reference Howard and Garland1994). Since the economic injury levels are based on pea aphid counts taken early in the reproductive growth period, they can be used as approximate economic thresholds for pea aphid. These economic injury levels are applicable in the inland Pacific Northwest where they were developed and should be applicable in other regions where dry pea is grown as a rain-fed summer annual crop. Recommendations can be used with greatest confidence in the Palouse dry pea production area of Idaho and Washington but can be used in neighbouring dry pea production regions where crop agronomic practices, environmental conditions, and pest biology are similar to those that pertained during this study.
Although Poston et al. (Reference Poston, Pedigo and Welch1983) observed that nominal economic injury level values often conservatively recommend management action when pest density does not pose a real economic threat, the research-based economic injury level values here instead show that those static values of 30–40 pea aphids per sweep net sample grossly underestimate actual damage. In particular, given current typical crop yield potential of 36 cwt/ha, crop market price of USD 16/cwt, and total control costs of USD 25–30/ha, the economic injury level is approximately five pea aphids per sweep (i.e., 86–101 pea aphids per 25 sweeps; Table 2). At 30 pea aphids per sweep net sample (i.e., 750 pea aphids per 25 sweeps) the quadratic model is past its maximum y-axis value (407.5 pea aphids per 25 sweeps; Fig. 2). Using this maximum y-axis value of 407.5 pea aphids per 25 sweeps (16.3 pea aphids per sweep net sample) the damage curve predicts an economic yield loss of 62%.
Nonlinear quadratic models better described relationships between crop yield and pest density than did linear models in this study, suggesting that the damage curve can be considered a desensitised response (sensu Pedigo et al. Reference Pedigo, Hutchins and Higley1986) in which per-capita damage decreases with successive pea aphids. Lee and Bechinski (Reference Lee, Bechinski, Quisenberry and Peairs1998) similarly reported a diminishing or desensitised response for barley crop yield as a function of density of Russian wheat aphid, Diuraphis noxia (Kurdjumov) (Hemiptera: Aphididae). In contrast, linear models a priori seem less biologically realistic because they assume constant per-capita damage at all pea aphid densities.
Economic injury level values here were computed as break-even densities, the number of pea aphids at which the costs of purchasing and applying insecticide are exactly equal to the benefits of pest control, where benefits are the value of preventable loss of United States Department of Agriculture #1 dry peas. But because pest density was stated as cohort numbers on day 3 of the 17-day infestation period, the values in Tables 3–4 can be considered economic thresholds, the density at which control action should be imposed to prevent infestations from exceeding break-even densities during the next two-plus weeks. We presumed that feeding injury during the initial three days of cohort establishment in the field was minimal and that preventable crop loss primarily was caused by subsequent population increase and feeding.
These statistical models measured plant yield response to caged pea aphids in the absence of natural enemies. If natural enemies cause high mortality, then the economic injury levels are too conservative because they assume each pea aphid survives to its maximum potential lifespan.
Economic injury level values can be implemented in commercial dry pea fields by directly counting pea aphids on plants, by sweep net sampling, or using a binomial sequential decision plan (Stokes et al. Reference Stokes, Bechinski and Eigenbrode2013). Economic threshold values that account for lag time in decision-making process would be advised at 70% of the economic injury levels and can easily be calculated using simple mathematical methods (multiplying pea aphid numbers in Tables 3–4 by 0.70). Farmer adoption of new integrated pest management technology depends on many factors, including ease of use and compatibility with current pest management practices (Bechinski Reference Bechinski, Pedigo and Buntin2000). Hence the expression of economic injury levels as density per 25 sweeps and as an easy-to-use printable table (binomial sequential sampling plan) is critical to adoption by the dry pea industry because sweep net sampling is standard scouting practice for pea aphids in our region, while a printable online table (www.cals.uidaho.edu/aphidtracker) could cut pest detection time and effort down to a practical level.
Supplementary material
To view supplementary material for this article, please visit https://doi.org/10.4039/tce.2019.10.
Acknowledgements
We thank Amelia Jurkowska, Erin Coyle, Hongjian Ding, and Ying Wu for their outstanding help in the field and laboratory with this project. We thank all the members of the Dry Pea & Lentil Council, United States of America, for their support. United States Department of Agriculture–National Institute of Food and Agriculture Risk Avoidance and Mitigation Program (USDA-NIFA-RAMP) award number 2008-51101-04522 primarily supported funding for this work with additional funding from the United States Department of Agriculture–National Institute of Food and Agriculture Regional Approaches to Climate Change (USDA-NIFA-REACCH) programme, award number 2011-68002-30191.