1. Introduction
Space plasmas are a unique laboratory to study the transfer of energy in highly turbulent media (Bruno & Carbone Reference Bruno and Carbone2016). In particular, the solar wind near the Earth has been continuously probed by space missions (Tu & Marsch Reference Tu and Marsch1995). The in situ measurements of this quasi-collisionless, highly variable and structured plasma show a medium in a state of fully developed turbulence. Under these conditions, turbulence is primarily originated at the Sun, and transported at high speed away from the source (Goldstein et al. Reference Goldstein, Neugebauer, Phillips, Bame, Gosling, McComas, Wang, Sheeley and Seuss1996). This turbulence is then dissipated through magnetohydrodynamic (MHD) to kinetic scales, where processes such as plasma wave excitation (Valentini, Perrone & Veltri Reference Valentini, Perrone and Veltri2011), temperature anisotropy (Servidio et al. Reference Servidio, Valentini, Califano and Veltri2012; Perrone et al. Reference Perrone, Bourouaine, Valentini, Marsch and Veltri2014a), plasma heating (Smith et al. Reference Smith, Matthaeus, Zank, Ness, Oughton and Richardson2001; Perrone et al. Reference Perrone, Valentini, Servidio, Dalena and Veltri2014b; Wan et al. Reference Wan, Matthaeus, Roytershteyn, Karimabadi, Parashar, Wu and Shay2015; Vaivads et al. Reference Vaivads, Retinò, Soucek, Khotyaintsev, Valentini, Escoubet, Alexandrova, André, Bale and Balikhin2016; Valentini et al. Reference Valentini, Perrone, Stabile, Pezzi, Servidio, De Marco, Marcucci, Bruno, Lavraud and De Keyser2016; Hughes et al. Reference Hughes, Gary, Wang and Parashar2017; Arzamasskiy et al. Reference Arzamasskiy, Kunz, Chandran and Quataert2019), particle energization (Gibelli, Shizgal & Yau Reference Gibelli, Shizgal and Yau2010), entropy cascade (Cerri, Kunz & Califano Reference Cerri, Kunz and Califano2018; Pezzi et al. Reference Pezzi, Servidio, Perrone, Valentini, Sorriso-Valvo, Greco, Matthaeus and Veltri2018; Kawazura, Barnes & Schekochihin Reference Kawazura, Barnes and Schekochihin2019) and enstrophy cascade (Servidio et al. Reference Servidio, Chasapis, Matthaeus, Perrone, Valentini, Parashar, Veltri, Gershman, Russell and Giles2017) are activated. Consequently, this energy cascade produces finer structures in the particle velocity distribution function (Marsch, Ao & Tu Reference Marsch, Ao and Tu2004; Valentini et al. Reference Valentini, Veltri, Califano and Mangeney2008; Vásconez et al. Reference Vásconez, Valentini, Camporeale and Veltri2014), and favours the presence of quasi-perpendicular wave vectors. In this environment, from a wave perspective, it is expected that kinetic Alfvén waves will be naturally developed at scales near the ion skin depth. In fact, recent observational analysis (Kiyani et al. Reference Kiyani, Chapman, Sahraoui, Hnat, Fauvarque and Khotyaintsev2012; Salem et al. Reference Salem, Howes, Sundkvist, Bale, Chaston, Chen and Mozer2012) and numerical simulations (TenBarge & Howes Reference TenBarge and Howes2012; Vásconez et al. Reference Vásconez, Pucci, Valentini, Servidio, Matthaeus and Malara2015; Pucci et al. Reference Pucci, Vásconez, Pezzi, Servidio, Valentini, Matthaeus and Malara2016; Valentini et al. Reference Valentini, Vásconez, Pezzi, Servidio, Malara and Pucci2017) have suggested that kinetic Alfvén waves can play an important role in the dissipation of turbulent energy. The MHD approximation describes space plasma phenomenology at large enough scales (Servidio, Matthaeus & Dmitruk Reference Servidio, Matthaeus and Dmitruk2008). In this approach, a Kolmogorov-like behaviour is highly supported by observations of velocity and magnetic fluctuations showing power-law spectra and intermittency (Carbone et al. Reference Carbone, Bruno, Sorriso-Valvo and Lepreti2004; Greco et al. Reference Greco, Matthaeus, Servidio, Chuychai and Dmitruk2009). At the MHD scales, the solar wind has shown scale-dependent non-Gaussian statistics (Sorriso-Valvo et al. Reference Sorriso-Valvo, Carbone, Veltri, Consolini and Bruno1999), with non-Gaussian fluctuations observed as well in the large scales (Marino et al. Reference Marino, Sorriso-Valvo, D'Amicis, Carbone, Bruno and Veltri2012) as happens also in anisotropic fluids with waves (Feraco et al. Reference Feraco, Marino, Pumir, Primavera, Mininni, Pouquet and Rosenberg2018). The intermittent cross-scale energy transfer has been extensively described through the MHD version of the von Kármán–Howarth equation for incompressible hydrodynamic turbulence (Frisch Reference Frisch1995). Based on conservation laws of the MHD invariants, such law predicts the linear scaling of the mixed third-order moment of the MHD variables (Politano & Pouquet Reference Politano and Pouquet1998). Broadly observed in numerical simulations (Sorriso-Valvo et al. Reference Sorriso-Valvo, Carbone, Noullez, Politano, Pouquet and Veltri2002) and in space plasmas (MacBride, Forman & Smith Reference MacBride, Forman and Smith2005; Sorriso-Valvo et al. Reference Sorriso-Valvo, Marino, Carbone, Noullez, Lepreti, Veltri, Bruno, Bavassano and Pietropaolo2007; Marino et al. Reference Marino, Sorriso-Valvo, D'Amicis, Carbone, Bruno and Veltri2012; Hadid et al. Reference Hadid, Sahraoui, Galtier and Huang2018; Bandyopadhyay et al. Reference Bandyopadhyay, Goldstein, Maruca, Matthaeus, Parashar, Ruffolo, Chhiber, Usmanov, Chasapis and Qudsi2020), the third-order law has been recently extended to include the effect of compressibility, anisotropy, Hall currents and other two-fluid effects (Galtier Reference Galtier2008; Andrés et al. Reference Andrés, Mininni, Dmitruk and Gomez2016; Hellinger et al. Reference Hellinger, Verdini, Landi, Franci and Matteini2018; Ferrand et al. Reference Ferrand, Galtier, Sahraoui, Meyrand, Andrés and Banerjee2019). At the bottom of the inertial (or Hall) range, the turbulent energy is dissipated in an efficient way as a result of inhomogeneous energy transfer, mostly occurring at small-scale vorticity filaments, rotational (or tangential) discontinuities and current sheets, among other structures (Zimbardo et al. Reference Zimbardo, Greco, Sorriso-Valvo, Perri, Vörös, Aburjania, Chargazia and Alexandrova2010). At scales close to the proton inertial length and/or to the proton skin depth, pure MHD models are no longer valid (Matthaeus, Servidio & Dmitruk Reference Matthaeus, Servidio and Dmitruk2008). Kinetic processes, led by field–particle interactions, have to be considered. Observations at  $1$ AU show non-Maxwellian velocity distribution functions of ions and electrons in the zone where a low collision rate is measured (Leamon et al. Reference Leamon, Smith, Ness, Matthaeus and Wong1998). Moreover, analysis of the intermittency at kinetic scales (Kiyani et al. Reference Kiyani, Chapman, Sahraoui, Hnat, Fauvarque and Khotyaintsev2012; Wu et al. Reference Wu, Perri, Osman, Wan, Matthaeus, Shay, Goldstein, Karimabadi and Chapman2013; Chen et al. Reference Chen, Sorriso-Valvo, Šafránková and Němeček2014) has given insights into our understanding of the distribution of energy in the kinetic-scale cascade (Boldyrev & Perez Reference Boldyrev and Perez2012) and how it is dissipated at electron scales (TenBarge & Howes Reference TenBarge and Howes2013). This has also been reported in numerical simulations (Leonardis et al. Reference Leonardis, Sorriso-Valvo, Valentini, Servidio, Carbone and Veltri2016; Franci et al. Reference Franci, Cerri, Califano, Landi, Papini, Verdini, Matteini, Jenko and Hellinger2017; Grošelj et al. Reference Grošelj, Cerri, Navarro, Willmott, Told, Loureiro, Califano and Jenko2017). In fact, Vlasov–Maxwell numerical simulations have confirmed that particle energization is taking place near the most intense small-scale structures (Servidio et al. Reference Servidio, Valentini, Perrone, Greco, Califano, Matthaeus and Veltri2015). The processes responsible for such energization are not yet understood. However, mechanisms such as plasma instabilities (Primavera et al. Reference Primavera, Malara, Servidio, Nigro and Veltri2019; Settino et al. Reference Settino, Malara, Pezzi, Onofri, Perrone and Valentini2020), wave–particle interactions (Sorriso-Valvo et al. Reference Sorriso-Valvo, Catapano, Retinò, Le Contel, Perrone, Roberts, Coburn, Panebianco, Valentini and Perri2019; Chen, Klein & Howes Reference Chen, Klein and Howes2019), increase of collisions (Pezzi, Valentini & Veltri Reference Pezzi, Valentini and Veltri2016; Pezzi Reference Pezzi2017; Pezzi et al. Reference Pezzi, Perrone, Servidio, Valentini, Sorriso-Valvo and Veltri2019) and turbulent energy dissipation due to the relation of spatially localized structures – such as thin current sheets – and magnetic reconnection sites (Carbone, Veltri & Mangeney Reference Carbone, Veltri and Mangeney1990; Servidio et al. Reference Servidio, Matthaeus, Shay, Cassak and Dmitruk2009, Reference Servidio, Dmitruk, Greco, Wan, Donato, Cassak, Shay, Carbone and Matthaeus2011; Cerri & Califano Reference Cerri and Califano2017; Franci et al. Reference Franci, Cerri, Califano, Landi, Papini, Verdini, Matteini, Jenko and Hellinger2017; Yang et al. Reference Yang, Matthaeus, Parashar, Wu, Wan, Shi, Chen, Roytershteyn and Daughton2017; Camporeale et al. Reference Camporeale, Sorriso-Valvo, Califano and Retinò2018), have been pointed out as good candidates. Then, direct numerical simulations have turned out to be quite useful for understanding the physics of plasmas under conditions of the near-Earth solar wind. The interested reader is referred to two recent works that present, and discuss, the current state of our understanding of plasma heating and kinetic-scale turbulence from simulations, i.e. Matthaeus et al. (Reference Matthaeus, Yang, Wan, Parashar, Bandyopadhyay, Chasapis, Pezzi and Valentini2020) and Cerri, Groselj & Franci (Reference Cerri, Groselj and Franci2019).
In this work, we study the properties of the turbulent energy transfer in plasmas in the direct numerical simulation framework previously investigated in Perrone et al. (Reference Perrone, Passot, Laveder, Valentini, Sulem, Zouganelis, Veltri and Servidio2018), which also followed the ‘Turbulent Dissipation Challenge’ (Parashar et al. Reference Parashar, Salem, Wicks, Karimabadi, Gary and Matthaeus2015; Pezzi et al. Reference Pezzi, Parashar, Servidio, Valentini, Vásconez, Yang, Malara, Matthaeus and Veltri2017; González et al. Reference González, Parashar, Gomez, Matthaeus and Dmitruk2019; Papini et al. Reference Papini, Franci, Landi, Verdini, Matteini and Hellinger2019). In their work, Hall MHD (HMHD), Landau fluid (LF) and hybrid Vlasov–Maxwell (HVM) bidimensional simulations in turbulent regimes were ran under collisionless plasma conditions, considering an out-of-plane ambient magnetic field. Magnetic diffusivity was carefully introduced in the fluid models. The fields obtained from these simulations allow us to explore different scales linked to their respective range of validity.
This paper is organized as follows. In § 2, we briefly present the three numerical models, namely HMHD, LF and HVM, which describe – under the same two-dimensional configuration – a collisionless plasma, in typical conditions of the solar wind plasma, in a quasi-developed turbulent state. Our analyses of local and global energy transfers of this state are presented in §§ 3 and 4, respectively. We summarize and conclude in § 5.
2. Numerical models
The dynamical behaviour of a plasma strongly depends on its frequencies. Here, we provide a very brief description of the three models used in the present work, which can properly focus on different ranges of frequency. At the lowest frequencies, where ions and electrons are locked together, and the plasma behaves like an electrically conducting fluid, a MHD model is good enough to describe the system. In this study, we use a HMHD simulation, which retains dispersive effects that become relevant at scales comparable to the proton skin depth. However, when collisions can be neglected, pressure anisotropy can develop in the plasma. In this case, and at somewhat higher frequency than the previous regime, a two-fluid description is needed, since electrons and ions can move relatively to each other. Therefore, we use a LF model which is able to take into account both pressure anisotropy and low-frequency kinetic effects, such as Landau damping. At higher frequencies, a kinetic model is required. We consider the HVM approach which describes the evolution of the proton distribution function, while electrons are treated as a fluid. All three models include the electron inertial effects with a proton-to-electron mass ratio 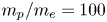 $m_p /m_e =100$.
The HMHD and LF codes use a two-dimensional Fourier pseudo-spectral method to compute the spatial derivatives, while the time advance is performed with a third-order Runge–Kutta scheme. In these fluid codes, aliasing errors in the evaluation of nonlinear terms are treated by a  $2/3$ truncation in the spectral space. In the HVM code, time advance is based on the time-splitting scheme (Cheng & Knorr Reference Cheng and Knorr1976), combined with the current advance method (Matthews Reference Matthews1994). In the Vlasov equation, advection in space and velocity is solved through an explicit upwind scheme (Van Leer Reference Van Leer1977). The HVM code uses fast Fourier transform operations only when computing the fields, and truncation is not needed since possible dealiasing errors are damped by the intrinsic dissipation of the numerical scheme.
The vector fields will evolve in a double periodic domain  $D = [L,L]$, in the
 $(x,y)$ plane.
 $L = 2{\rm \pi} \times 25 d_p$ is the length of each direction
 $x$ and
 $y$. This domain is discretized with
 $N_x = N_y = 1024$ grid points. Additionally, the HVM simulation is run in a three-dimensional velocity domain
 $- 5 v_{\textrm {th},p} \leq \boldsymbol {v} \leq 5 v_{\textrm {th},p}$, discretized with
 $51^3$ points, and where
 $v_{\textrm {th},p} = \sqrt {T_p / m_p}$ is the thermal velocity of the protons. At
 $t=0$, the equilibrium was set by a homogeneous plasma embedded in a uniform background magnetic field,
 $\boldsymbol {B}_0 = (0,0,B_0)$, oriented in the
 $z$ direction. We set the proton plasma beta as
 $\beta = 2 v_{th,p} / v_A = 1$, where
 $v_A = B_0 / \sqrt {4 {\rm \pi} n_0 m_p}$ is the Alfvén speed. The initial perturbation of this equilibrium is performed by velocity (and magnetic) field fluctuations with random phases in the interval
 $2 \leq m \leq 6$, for the wavenumbers
 $k = 2 {\rm \pi} m /L$. Although the amplitudes of the magnetic perturbations are
 $b / B_0 \approx 0.3$, neither density fluctuations nor parallel variances are imposed. In fluid models, a magnetic diffusivity term with a coefficient
 $\eta = 2 \times 10^{-2}$ has been added.
2.1. Hall magnetohydrodynamics
The set of HMHD equations, in a non-dimensional form, reads
 \begin{gather} \frac{\partial n}{\partial t} + \boldsymbol{\nabla} \boldsymbol{\cdot} (n \boldsymbol{u}) = 0, \end{gather}
 \begin{gather} {\frac{\partial \boldsymbol{u}}{\partial t} + (\boldsymbol{u} \boldsymbol{\cdot} \boldsymbol{\nabla}) \boldsymbol{u} ={-} \frac{\beta}{2 n} \boldsymbol{\nabla} P + \frac{1}{n} \left[ (\boldsymbol{\nabla} \times \boldsymbol{B}) \times \boldsymbol{B} \right] - \eta_4 \nabla^4 \boldsymbol{u} }, \end{gather}
 \begin{gather} {\frac{\partial \boldsymbol{B}}{\partial t} ={-}\boldsymbol{\nabla} \times \boldsymbol{E} - \eta_4 \nabla^4 \boldsymbol{B}}, \end{gather}
 \begin{gather} {(1 - d_e^2 \nabla^2)} \boldsymbol{E} + \boldsymbol{u} \times \boldsymbol{B} -\frac{1}{n} \left[ (\boldsymbol{\nabla} \times \boldsymbol{B}) \times \boldsymbol{B} \right] {- \eta (\boldsymbol{\nabla} \times \boldsymbol{B})} = 0, \end{gather}
 \begin{gather} P = n^\gamma, \end{gather}
where  $n$ is the plasma density,
 $\boldsymbol {u}$ is the hydrodynamic velocity,
 $\boldsymbol {E}$ and
 $\boldsymbol {B}$ are the electric and magnetic fields, respectively,
 $P$ is the isotropic total pressure,
 $\eta = 2 \times 10^{-2}$ is the magnetic diffusivity and
 $\gamma = 5/3$ is the adiabatic index. This non-dimensional set of equations is obtained normalizing
 $n$ to
 $n_0 m_p$,
 $\boldsymbol {u}$ to the Alfvén speed
 $v_A$,
 $t$ to the inverse proton cyclotron frequency
 $\varOmega _{\textrm {cp}}^{-1}$ and the length units to the proton skin depth
 $d_p = v_A / \varOmega _{\textrm {cp}}$. In Ohm's law, the electron inertia is retained in the form used in Valentini et al. (Reference Valentini, Trávníček, Califano, Hellinger and Mangeney2007), with a non-dimensional electron skin depth
 $d_e^2 = m_e/m_i$ taken equal to
 $1/100$. For regularization purposes, and to reproduce the same-time behaviour for the maximum value of the integrated parallel current density
 $\langle\,j_z^2\rangle$, bi-Laplacian hyperviscosity and hyperdiffusivity, with coefficients equal to
 $\nu _4=\eta _4=5\times 10^{-4}$, have been added to the right-hand side of velocity and magnetic field equations. Note that hyperviscosity and hyperdiffusivity strongly mitigate the effect of the electron inertia, and therefore the
 $d_e^2$ term is negligible in the present run.
2.2. Landau fluid
The LF system of dynamical equations solves for the evolution of the magnetic field, density, velocity, parallel and perpendicular pressures and heat fluxes in a way consistent with the low-frequency limit of the linear kinetic theory, up to a scale of the order of the ion gyroradius. The electric field is computed using a generalized Ohm's law, which includes the Hall term, together with electron inertia with the same simplified form and the same artificial mass ratio as in the HMHD case, and the same magnetic diffusivity. The electron pressure gradient, which is formally present in Ohm's law and in the momentum equation, is here neglected to closely match the conditions of the Vlasov simulations, in which electrons are cold. The ion velocity equation reads
 \begin{equation} \frac{\partial \boldsymbol{u}}{\partial t} + (\boldsymbol{u} \boldsymbol{\cdot} \boldsymbol{\nabla}) \boldsymbol{u} ={-} \frac{\beta}{2 n} \boldsymbol{\nabla} \boldsymbol{\cdot} \boldsymbol{P} + \frac{1}{n} \left[ (\boldsymbol{\nabla} \times \boldsymbol{B}) \times \boldsymbol{B} \right], \end{equation}
while the density and the magnetic fields obey (2.1) and (2.3) of HMHD. The ion pressure tensor is conveniently written as  $\boldsymbol {P} = p_{\perp }\boldsymbol {n} + p_{\|} \boldsymbol {\tau } + \boldsymbol {\varPi }$, with
 $\boldsymbol {\tau } = \hat {b}\otimes \hat {b}$,
 $\boldsymbol {n} = \boldsymbol {I} - \boldsymbol {\tau }$ and
 $\hat {b}=\boldsymbol {B}/|\boldsymbol {B}|$ is the unit vector along the local magnetic field. The parallel and perpendicular ion pressures obey
 \begin{gather} \partial_t p_{\|} + \boldsymbol{\nabla} \boldsymbol{\cdot} (\boldsymbol{u} \, p_{\|}) + 2 p_{\|}\, \hat{b}\boldsymbol{\cdot} \boldsymbol{\nabla} \boldsymbol{u}\, \boldsymbol{\cdot}\hat{b} + \hat{b}\boldsymbol{\cdot} (\boldsymbol{\nabla} \boldsymbol{\cdot}\boldsymbol{Q}) \boldsymbol{\cdot} \hat{b} \nonumber\\ +\left(\left(\boldsymbol{\varPi} \boldsymbol{\cdot} \boldsymbol{\nabla} \boldsymbol{u}\right)^S : \boldsymbol{\tau} - \boldsymbol{\varPi} :\frac{\textrm{d}\boldsymbol{\tau}}{\textrm{d}t}\right) =0, \\ \partial_t p_{{\perp}} + \boldsymbol{\nabla}\boldsymbol{\cdot}(\boldsymbol{u} \, p_{{\perp}})+ p_{{\perp}} \boldsymbol{\nabla}\boldsymbol{\cdot} \boldsymbol{u} - p_{{\perp}}\,\hat{b}\boldsymbol{\cdot}\boldsymbol{\nabla} \boldsymbol{u} \boldsymbol{\cdot} \hat{b} \nonumber\\ + \frac{1}{2}\left(\textrm{tr}\,\boldsymbol{\nabla} \boldsymbol{\cdot}\boldsymbol{Q} - \hat{b}\boldsymbol{\cdot} \left(\boldsymbol{\nabla} \boldsymbol{\cdot}\boldsymbol{Q}\right) \boldsymbol{\cdot} \hat{b} \right)\nonumber\end{gather}
 \begin{gather}+\frac{1}{2}\left(\textrm{tr}\, \left(\boldsymbol{\varPi}\boldsymbol{\cdot} \boldsymbol{\nabla} \boldsymbol{u}\right)^S -\left(\boldsymbol{\varPi} \boldsymbol{\cdot} \boldsymbol{\nabla} \boldsymbol{u}\right)^S : \boldsymbol{\tau} + \boldsymbol{\varPi} :\frac{\textrm{d}\boldsymbol{\tau} }{\textrm{d}t} \right) =0 , \end{gather}
thus involving the ion heat flux tensor  $\boldsymbol {Q}$ along with the non-gyrotropic ion pressure tensor
 $\boldsymbol {\varPi }$. Here, and in (2.6), the latter will be neglected in the energy transfer budget since we are discarding finite Larmor radius effects, even though they may be relevant for energy transfers at the scale of the present simulations, and the trace term explicitly contributes to the energy conservation (see e.g. Yang et al. (Reference Yang, Matthaeus, Parashar, Wu, Wan, Shi, Chen, Roytershteyn and Daughton2017) for full kinetic simulations and Cerri & Camporeale (Reference Cerri and Camporeale2020) for explicit formulation in hybrid kinetic models). The non-gyrotropic pressure closure used in the present LF model (Passot et al. Reference Passot, Henri, Laveder and Sulem2014) is indeed valid only in a weakly nonlinear regime, while as we numerically checked it may lead to non-physical behaviour in the present context of a too strong nonlinearity, especially when electrons are cold. So here we focused on kinetic damping only. This point should also be kept in mind when interpreting the possible discrepancies between ion-scale features obtained from HVM simulation and from the fluid simulations (see e.g. § 5).
On the same footing, the ion heat flux tensor  $\boldsymbol {Q}$ is taken in its gyrotropic form, which in (2.7) and (2.8) implies
 $\hat {b}\boldsymbol {\cdot } (\boldsymbol {\nabla } \boldsymbol {\cdot }\boldsymbol {Q}) \boldsymbol {\cdot } \hat {b} = \boldsymbol {\nabla }\boldsymbol {\cdot } (q_{\|} \hat {b} ) - 2q_{\perp r} \boldsymbol {\nabla } \boldsymbol {\cdot } \hat {b}$ and
 $( \textrm {tr} ( \boldsymbol {\nabla } \boldsymbol {\cdot }\boldsymbol {Q} ) - \hat {b}\boldsymbol {\cdot } (\boldsymbol {\nabla } \boldsymbol {\cdot }\boldsymbol {Q}) \boldsymbol {\cdot } \hat {b} )/2 = \boldsymbol {\nabla } \boldsymbol {\cdot } (q_{\perp } \hat {b}) + q_{\perp } \boldsymbol {\nabla } \boldsymbol {\cdot } \hat {b}$, where the gyrotropic heat flux components obey (still neglecting higher-order non-gyrotropic contributions)
 \begin{gather} \partial_t q_{\|} + \boldsymbol{\nabla}\boldsymbol{\cdot} (q_{\|} \boldsymbol{u}) + 3 q_{\|} \hat{b}\boldsymbol{\cdot} \boldsymbol{\nabla} \boldsymbol{u} \boldsymbol{\cdot} \hat{b} + 3 p_{\|} \left(\hat{b}\boldsymbol{\cdot} \boldsymbol{\nabla}\right)\left(\frac{p_{\|}}{\rho} \right) \nonumber\\ + \boldsymbol{\nabla}\boldsymbol{\cdot} ({\tilde{r}_{\|\|}} \hat{b})- 3 {\tilde{r}_{\|\perp}} \boldsymbol{\nabla}\boldsymbol{\cdot} \hat{b}=0,\\ \partial_t q_{{\perp}}+ \boldsymbol{\nabla}\boldsymbol{\cdot}(\boldsymbol{u} q_{{\perp}}) + q_{{\perp}}\boldsymbol{\nabla}\boldsymbol{\cdot} \boldsymbol{u} + p_{\|}\left(\hat{b}\boldsymbol{\cdot}\boldsymbol{\nabla}\right)\left(\frac{p_{{\perp}}}{\rho}\right) + \boldsymbol{\nabla} \boldsymbol{\cdot} \left({\tilde{r}_{\|\perp}} \hat{b}\right) \nonumber\end{gather}
 \begin{gather}+ \left(\left(p_{\|} -p_{{\perp}}\right)\frac{p_{{\perp}}}{\rho} -{\tilde{r}_{{\perp}{\perp}}}+ {\tilde{r}_{\|\perp}}\right) \left(\boldsymbol{\nabla}\boldsymbol{\cdot} \hat{b}\right) =0. \end{gather}
The gyrotropic fourth-rank cumulants  ${\tilde {r}_{\|\|r} }$,
 ${\tilde {r}_{\|\perp r}}$ and
 ${\tilde {r}_{\perp \perp r}}$ needed to close the hierarchy are given by (5.1), (5.2) and (5.4) of Sulem & Passot (Reference Sulem and Passot2015), where ion Landau damping is retained only in a quasilinear form, in the approximation discussed in Passot et al. (Reference Passot, Henri, Laveder and Sulem2014).
Together with the same hyperviscosity and hyperdiffusivity included in HMHD equations, additional bi-Laplacian dissipative terms have been supplemented in the equations for the density and the pressures (with coefficient equal to  $2.5 \times 10^{-3}$) and in the equations for the ion heat flux (with coefficient
 $10^{-4}$) in order to deal with the high level of compressibility in the simulation (the Mach number reaching values up to
 $0.4$). In fact, we note that compressibility of these fluid models will be important when comparing our results.
2.3. Hybrid Vlasov–Maxwell
The HVM code (Valentini et al. Reference Valentini, Trávníček, Califano, Hellinger and Mangeney2007) solves the Vlasov equation for the proton distribution function  $f = f (\boldsymbol {r}, \boldsymbol {v}, t)$, while the electron response is taken into account through a generalized Ohm's law for the electric field. The Vlasov equation, in normalized units,
 \begin{equation} \frac{\partial f}{\partial t} + \boldsymbol{v} \boldsymbol{\cdot} \frac{\partial f}{\partial \boldsymbol{r}} + (\boldsymbol{E} + \boldsymbol{u} \times \boldsymbol{B}) \boldsymbol{\cdot} \frac{\partial f}{\partial \boldsymbol{v}} = 0, \end{equation}
is solved in a 2D-3V phase-space domain (two dimensions in physical space and three dimensions in velocity space), coupling it with (2.3) and (2.4). Velocities  $\boldsymbol {v}$ and
 $\boldsymbol {u}$ (proton bulk velocity) are scaled to
 $v_A$. Quasi-neutrality (
 $n = n_e = n_p$), and cold electrons, is considered. The time step is chosen in order to satisfy the Courant–Friedrichs–Lewy condition for the numerical stability. The proton distribution function is initialized with a homogeneous-density Maxwellian function. In this procedure, displacement current is neglected in the Ampère law, making the assumption of low frequencies.
3. Local energy transfer analysis
The analysis developed in this work is performed in a period of maximal turbulence activity. As described by Perrone et al. (Reference Perrone, Passot, Laveder, Valentini, Sulem, Zouganelis, Veltri and Servidio2018), this state is reached at  $t^* = 60 \varOmega _{\textrm {cp}}^{-1}$, for the same set of simulations considered here. They established
 $t^*$ after following
 $\langle\,j_z^2 \rangle$ in time, for HMHD, LF and HVM descriptions, where the same
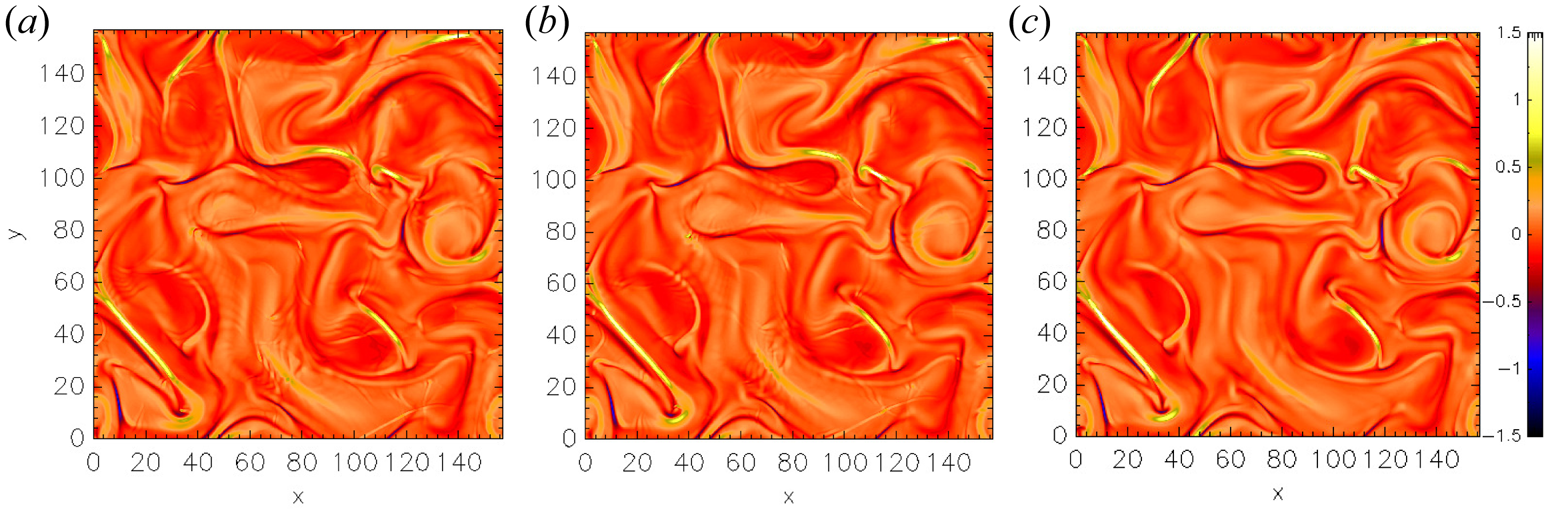
 $\beta$ was held in order to ensure a similar level of density fluctuations. In figure 1, we plot the out-of-plane component of the current density,
 $j_z(x,y)$, at
 $t = t^*$. The structure locations (and intensities) present on this component are consistent for the three simulations: HMHD (figure 1a), LF (figure 1b) and HVM (figure 1c).
Contour plot of the out-of-plane current density  $j_z(x,y)$ for HMHD (a), LF (b) and HVM (c) simulations at
 $t = t^{\ast }$ (see text).

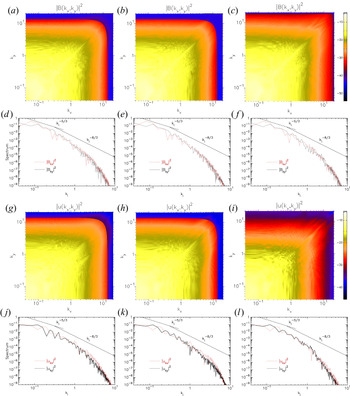
Figure 2 shows the spectra of  $\boldsymbol {B}$ and
 $\boldsymbol {u}$ for the HMHD (figure 2a,d,g,j), LF (figure 2b,e,h,k) and HVM (figure 2c,f,i,l) simulations. Magnetic field spectra (bidimensional
 $|B(k_x,k_y)|^2$, and reduced integrated
 $|B_{ki}|^2$) are presented in figure 2(a–f), while the velocity field spectra (bidimensional
 $|u(k_x,k_y)|^2$, and reduced integrated
 $|u_{ki}|^2$) can be seen in figure 2(g–l). The integrated spectra are plotted with respect to
 $k_i = k_x$ with a red-dashed line, and with respect to
 $k_i = k_y$ with a black-solid line. Bidimensional spectra maps of HMHD and LF simulations show the
 $2/3$ truncation, which was not performed in the HVM simulation.
Magnetic field (a–f) and velocity field (g–l) spectra. The integrated spectra are presented with respect to  $k_i$,
 $i = x$ (red-dashed line),
 $y$ (black-solid line). Standard phenomenological power laws (
 $k_{i}^{-5/3}$ in the MHD range (see e.g. Frisch Reference Frisch1995) and
 $k_{i}^{-8/3}$ in the HMHD range (Meyrand & Galtier Reference Meyrand and Galtier2013)) are reported as reference.

Considering that, in the small-scale limit, HMHD physics was observed to match hybrid kinetic model results (Vásconez et al. Reference Vásconez, Pucci, Valentini, Servidio, Matthaeus and Malara2015; Pucci et al. Reference Pucci, Vásconez, Pezzi, Servidio, Valentini, Matthaeus and Malara2016), Hellinger et al. (Reference Hellinger, Verdini, Landi, Franci and Matteini2018) presented a generalization of the von Kármán–Howarth equation for incompressible hydrodynamic turbulence, in the framework of incompressible HMHD equations. This generalization was revisited by Ferrand et al. (Reference Ferrand, Galtier, Sahraoui, Meyrand, Andrés and Banerjee2019), who also considered homogeneous turbulence, and worked with two-point correlation tensors depending only on the relative displacement  $\boldsymbol {\ell }$, and not on the absolute positions, as
 $\delta \boldsymbol {g} = \boldsymbol {g} (\boldsymbol {r} + \boldsymbol {\ell }) - \boldsymbol {g} (\boldsymbol {r})$. In this context, the mean rate of total energy injection
 $\epsilon$ is expressed as the combination of the third-order structure functions corresponding to the MHD turbulent cascade flux (Carbone, Sorriso-Valvo & Marino Reference Carbone, Sorriso-Valvo and Marino2009; Verdini et al. Reference Verdini, Grappin, Hellinger, Landi and Müller2015) and to Hall corrections (Galtier Reference Galtier2008):
 \begin{gather} {-}4 \epsilon = \boldsymbol{\nabla} \boldsymbol{\cdot} \langle (\delta \boldsymbol{u} \boldsymbol{\cdot} \delta \boldsymbol{u}) \delta \boldsymbol{u} + (\delta \boldsymbol{B} \boldsymbol{\cdot} \delta \boldsymbol{B}) \delta \boldsymbol{u} - 2 (\delta \boldsymbol{u} \boldsymbol{\cdot} \delta \boldsymbol{B}) \delta \boldsymbol{B} - \frac{d_p}{2} (\delta \boldsymbol{B} \boldsymbol{\cdot} \delta \boldsymbol{B}) \delta \boldsymbol{j}\nonumber\\ + d_p (\delta \boldsymbol{B} \boldsymbol{\cdot} \delta \boldsymbol{j}) \delta \boldsymbol{B} \rangle. \end{gather}
In fact, we can identify the single contribution of each component that corresponds to the Yaglom effect contributions,
 \begin{gather} \boldsymbol{Y}_1 (x,y) = (\delta \boldsymbol{u} \boldsymbol{\cdot} \delta \boldsymbol{u}) \delta \boldsymbol{u}, \end{gather}
 \begin{gather}\boldsymbol{Y}_2 (x,y) = (\delta \boldsymbol{B} \boldsymbol{\cdot} \delta \boldsymbol{B}) \delta \boldsymbol{u}, \end{gather}
 \begin{gather}\boldsymbol{Y}_3 (x,y) ={-}2 (\delta \boldsymbol{u} \boldsymbol{\cdot} \delta \boldsymbol{B}) \delta \boldsymbol{B}, \end{gather}
and to the Hall effect contributions,
 \begin{gather} \boldsymbol{H}_1 (x,y) = d_p (\delta \boldsymbol{B} \boldsymbol{\cdot} \delta \boldsymbol{j}) \delta \boldsymbol{B}, \end{gather}
 \begin{gather}\boldsymbol{H}_2 (x,y) ={-} \frac{d_p}{2} (\delta \boldsymbol{B} \boldsymbol{\cdot} \delta \boldsymbol{B}) \delta \boldsymbol{j}. \end{gather}
In this way, (3.1) would be written as  $-4 \epsilon = \boldsymbol {\nabla } \boldsymbol {\cdot } \langle \boldsymbol {Y}_1 + \boldsymbol {Y}_2 + \boldsymbol {Y}_3 + \boldsymbol {H}_1 + \boldsymbol {H}_2 \rangle$. Compressive fluctuations (i.e.
 $\delta B$ and/or
 $\delta n$) naturally develop as the cascade proceeds towards smaller scales, becoming important at ion scales and below, even when these types of fluctuations are not directly injected at large (MHD) scales (which is the case for the simulations presented here). This effect was explicitly shown for two-dimensional simulations, for instance, in Cerri et al. (Reference Cerri, Franci, Califano, Landi and Hellinger2017). Direct numerical simulations of compressible MHD turbulence (Andrés et al. Reference Andrés, Sahraoui, Galtier, Hadid, Dmitruk and Mininni2018) and measurements in a collisionless space plasma using Magnetospheric Multiscale data in comparison with simulations of compressible HMHD turbulence (Andrés et al. Reference Andrés, Sahraoui, Galtier, Hadid, Ferrand and Huang2019) indicate that neglecting the contribution of compressibility to the exact laws results in an underestimation of the total energy flux and dissipation rate, especially near the ion scale. However, in Andrés et al. (Reference Andrés, Sahraoui, Galtier, Hadid, Dmitruk and Mininni2018) it was also found that except in cases in which the largest scales already display strong density fluctuations, the compressible Yaglom-like flux gives the dominant contribution to the energy flux at the MHD scales, and remains close to the incompressible Yaglom (or Politano–Pouquet) flux, while all other contributions of the compressibility to the energy flux remain small.
On the other hand, a heuristic proxy has been recently introduced. It focuses on the local turbulent energy transfer rate towards the smallest resolved scale. This proxy, named as LET, was constructed in order to extend the Yaglom law to MHD turbulence, and matches the latter law when small density fluctuations (at the scale  $\ell$) can be neglected (Carbone et al. Reference Carbone, Marino, Sorriso-Valvo, Noullez and Bruno2009). It is estimated, for two-dimensional incompressible turbulence, through the combined third-order fluctuations of velocity, magnetic field and current density (Sorriso-Valvo et al. Reference Sorriso-Valvo, Perrone, Pezzi, Valentini, Servidio, Zouganelis and Veltri2018), and neglecting unity-order multiplicative factors, as
 \begin{gather} - 2 \ell \epsilon_\ell \equiv (\delta \boldsymbol{u} \boldsymbol{\cdot} \delta \boldsymbol{u}) \delta u_\ell + (\delta \boldsymbol{B} \boldsymbol{\cdot} \delta \boldsymbol{B}) \delta u_\ell - 2 (\delta \boldsymbol{u} \boldsymbol{\cdot} \delta \boldsymbol{B}) \delta B_\ell - \frac{d_p}{2} (\delta \boldsymbol{B} \boldsymbol{\cdot} \delta \boldsymbol{B}) \delta j_\ell\nonumber\\ + d_p (\delta \boldsymbol{B} \boldsymbol{\cdot} \delta \boldsymbol{j}) \delta B_\ell. \end{gather}
Consistently with our notation, the latter equation could be rewritten as
 \begin{equation} -2 \ell \epsilon_\ell = \epsilon_Y + \epsilon_H, \end{equation}
where  $\epsilon _Y = \epsilon _{Y_1} + \epsilon _{Y_2} + \epsilon _{Y_3}$ and
 $\epsilon _H = \epsilon _{H_1} + \epsilon _{H_2}$. For this,
 $\epsilon _{Y_1} = (\delta \boldsymbol {u} \boldsymbol {\cdot } \delta \boldsymbol {u}) \delta u_\ell$ measures the kinetic energy available to be transported by the longitudinal component of
 $\delta \boldsymbol {u}$,
 $\epsilon _{Y_2} = (\delta \boldsymbol {B} \boldsymbol {\cdot } \delta \boldsymbol {B}) \delta u_\ell$ quantifies the magnetic energy that will be transported by
 $\delta u_\ell$,
 $\epsilon _{Y_3} = - 2 (\delta \boldsymbol {u} \boldsymbol {\cdot } \delta \boldsymbol {B}) \delta B_\ell$ is related to the velocity–magnetic field correlations coupled to the longitudinal magnetic field fluctuations,
 $\epsilon _{H_1} = -d_p (\delta \boldsymbol {B} \boldsymbol {\cdot } \delta \boldsymbol {B}) \delta j_\ell /2$ indicates the quantity of magnetic energy advected by longitudinal current density field fluctuations and
 $\epsilon _{H_2} = d_p (\delta \boldsymbol {B} \boldsymbol {\cdot } \delta \boldsymbol {j}) \delta B_\ell$ is related to the magnetic–current density field correlations coupled to the longitudinal magnetic field fluctuations. In (3.7), the two latter terms vanish when
 $d_p \to 0$, which recovers the classic Yaglom law. It should be noted that the unaveraged third-order quantity described in (3.7) cannot be rigorously derived, and may therefore display convergence issues. In other words, it does not describe a turbulent cascade, but just the local contribution of the turbulent fluctuations to the energy transfer. On the other hand, its use as a proxy is partly supported by the existence of local versions of the third-order scaling law, whose rigorous derivation is based on the use of scale- and space-localized filters (Duchon & Robert Reference Duchon and Robert2000; Eyink Reference Eyink2003; Camporeale et al. Reference Camporeale, Sorriso-Valvo, Califano and Retinò2018; Coburn & Sorriso-Valvo Reference Coburn and Sorriso-Valvo2019).
Since we want to explore the energy flux distribution resulting from the turbulent nonlinear transfer, we first focus on the scale  $\sim d_p$, i.e. at the bottom of the inertial range, where the intermittent structures carrying most of the energy have been formed. As we noted in § 2,
 $N_x = N_y = 1024$, then
 ${\rm \Delta} x = {\rm \Delta} y \approx 0.15$, resulting in
 $\ell \approx d_{p}$. At this scale, we will identify the Yaglom
 $\boldsymbol {Y}_m(x,y) = (\boldsymbol {Y}_{mx} + \boldsymbol {Y}_{my})/2$ and Hall
 $\boldsymbol {H}_n(x,y) = (\boldsymbol {H}_{n x} + \boldsymbol {H}_{n y})/2$ contributions, according to their spatial distribution, where
 $m = 1, 2, 3$ and
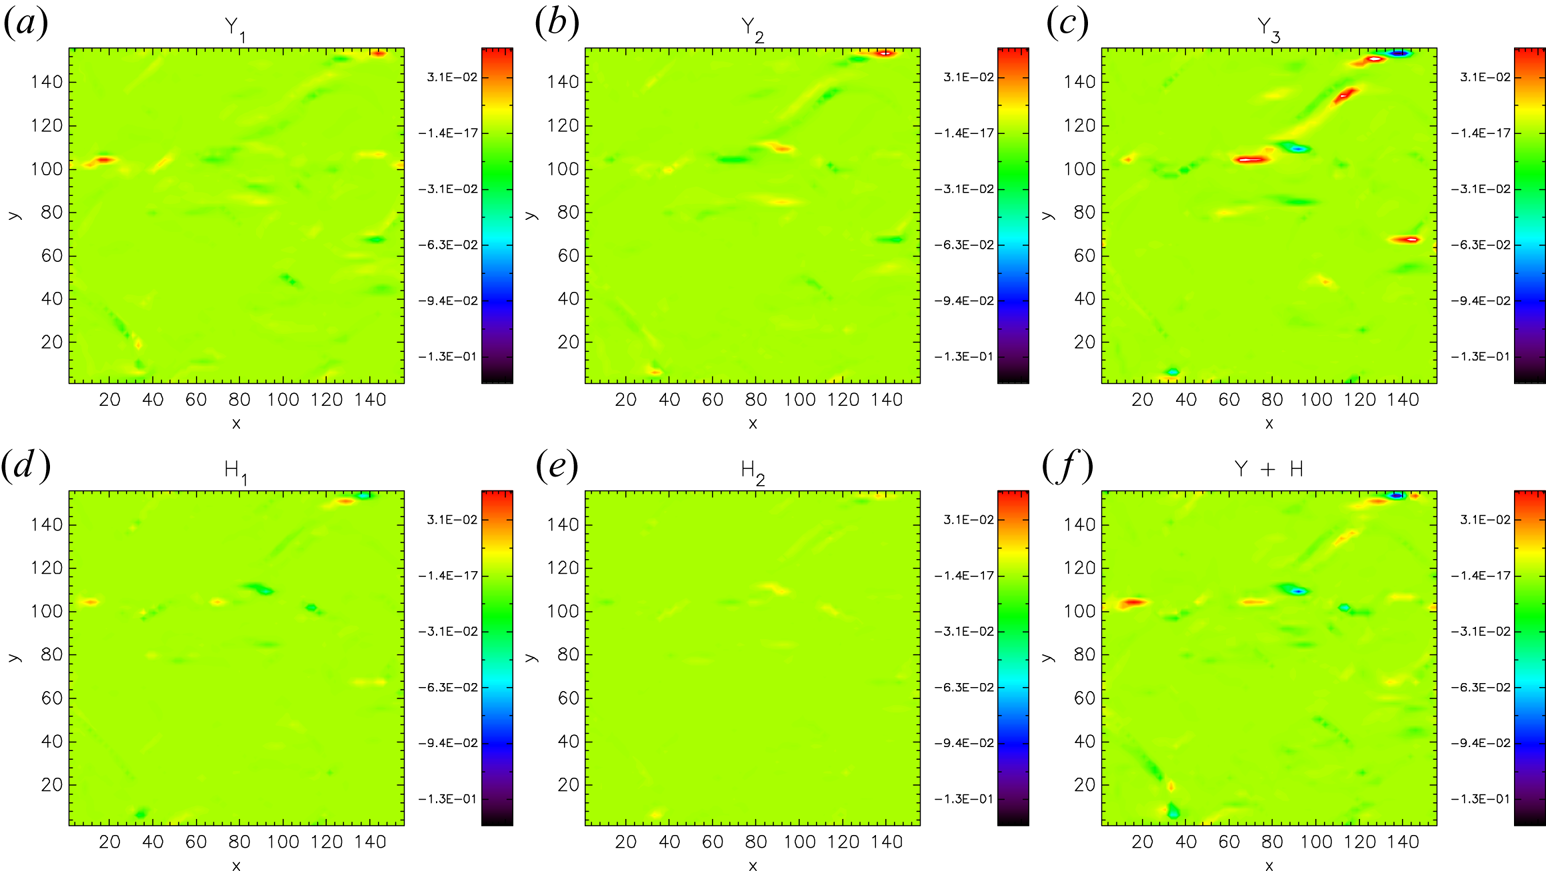
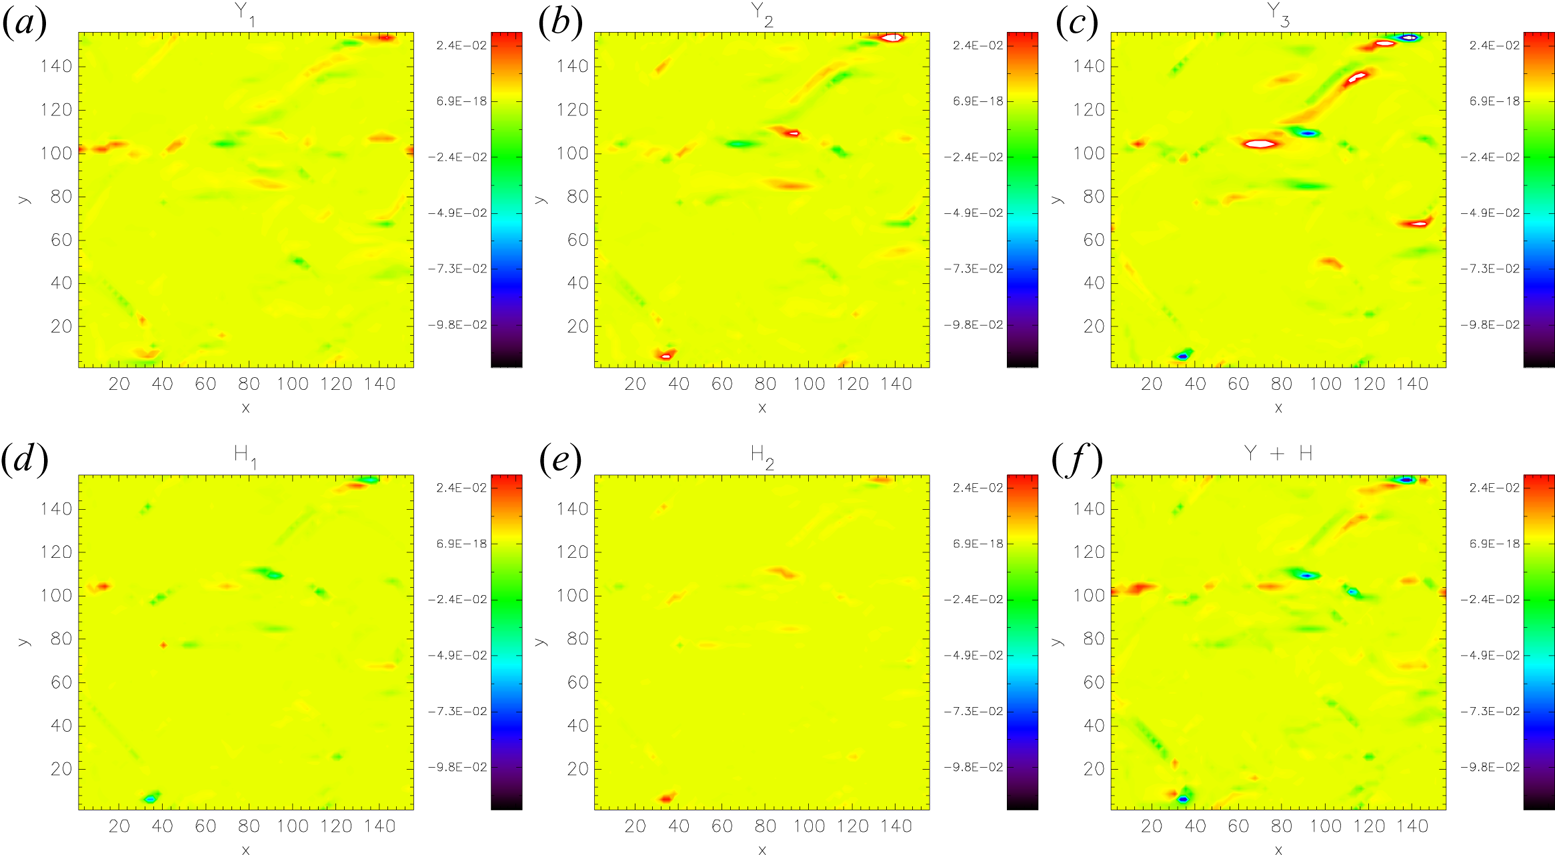
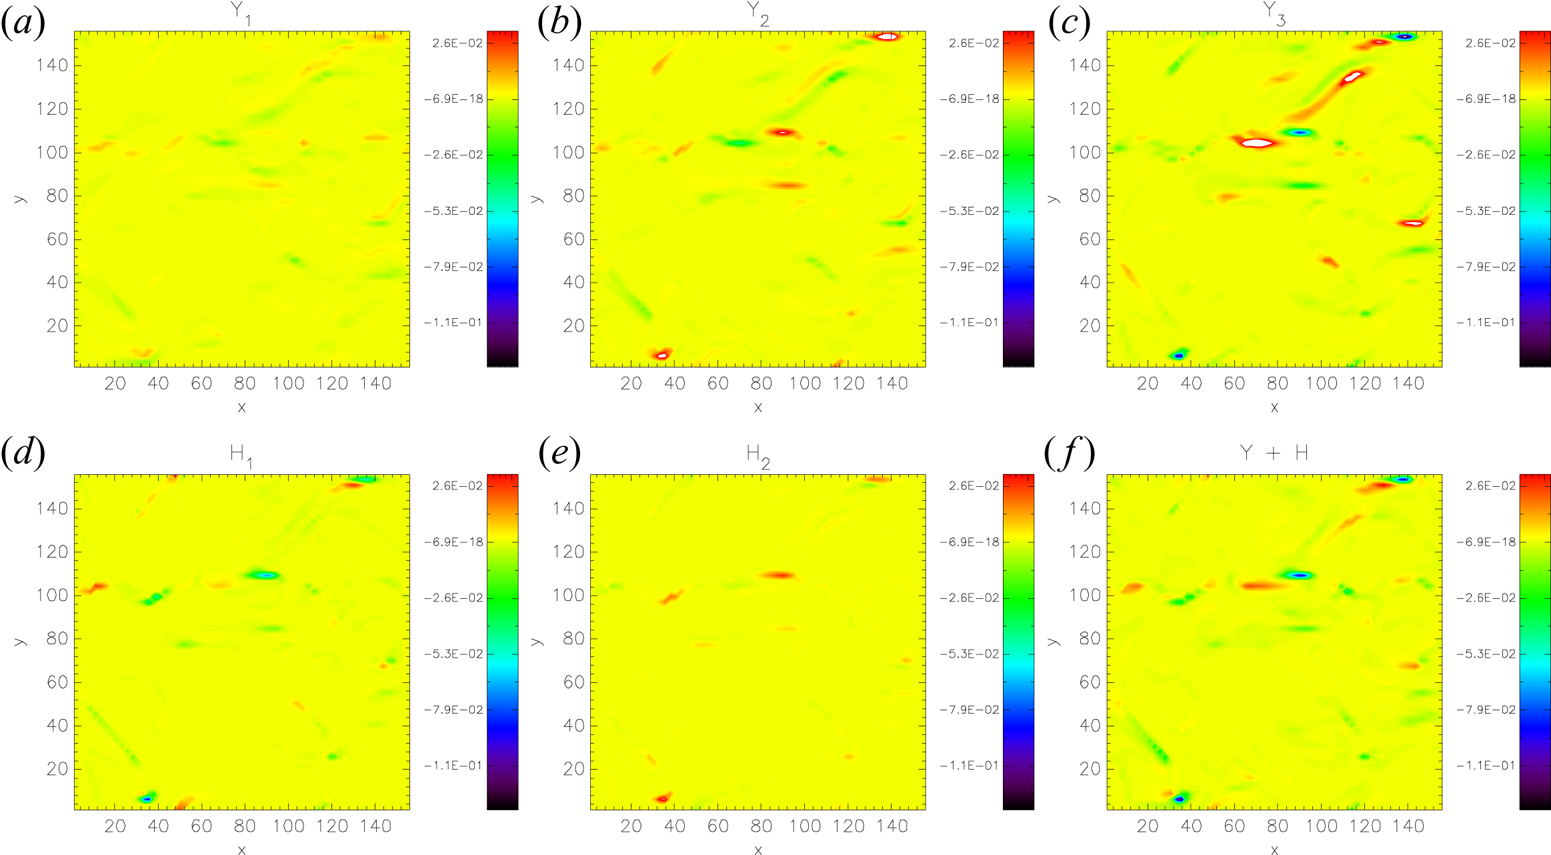
 $n = 1, 2$. These two-dimensional maps are presented in figure 3 (HMHD), figure 4 (LF) and figure 5 (HVM). They clearly highlight the intermittent nature of the cross-scale energy transfer. This is evidenced by the presence of strong contributions to the scaling law in small-scale localized, sparse structures. Most of the energy transfer, and consequently of the energy dissipation, is taking place at those locations, which was also reported in Yang et al. (Reference Yang, Matthaeus, Parashar, Wu, Wan, Shi, Chen, Roytershteyn and Daughton2017) and in Camporeale et al. (Reference Camporeale, Sorriso-Valvo, Califano and Retinò2018). This feature may be consistent with the idea that reconnection of current sheets, and the formation of coherent structures, could provide a viable mechanism for (likely cross-scale) energy transfer across ion-kinetic scales (Cerri & Califano Reference Cerri and Califano2017; Franci et al. Reference Franci, Cerri, Califano, Landi, Papini, Verdini, Matteini, Jenko and Hellinger2017). It is interesting to note that different terms of the HMHD law may present similar structures at the same locations. However, in several instances the structures of different contributions are not collocated, suggesting that the nature of the fluctuations producing the energy transfer may change with position, possibly enabling different dissipation mechanisms (Sorriso-Valvo et al. Reference Sorriso-Valvo, Catapano, Retinò, Le Contel, Perrone, Roberts, Coburn, Panebianco, Valentini and Perri2019). It is also apparent that most of the more intense structures are positive, suggesting that the energy is being transferred towards the small scales in a ‘direct’ cascade. However, several negative structures are also present, where the contribution from the various terms is acting so as to remove energy from the smaller scales. We do not imply here that the sign of the local contributions is related to the cascade direction, and the latest statements should be taken as a qualitative indication. Note that the overall energy flux will result from the average over the whole domain, and is mostly positive, as expected and as we discuss in the next section. Comparing the different simulations reveals that the various terms have similar behaviour. In particular, the
 $\boldsymbol {Y}_3$ term seems to be dominating in the simulations. Interestingly, in the HMHD simulation the Hall terms appear weaker than in the two other simulations. This observation will be discussed later.
The HMHD simulation. Bidimensional maps of Yaglom components  $\boldsymbol {Y}_1$ (equation (3.2)),
 $\boldsymbol {Y}_2$ (equation (3.3)) and
 $\boldsymbol {Y}_3$ (equation (3.4)); and Hall components
 $\boldsymbol {H}_1$ (equation (3.5)) and
 $\boldsymbol {H}_2$ (equation (3.6)), of the mean rate of total energy injection, estimated at the scale
 $\ell \simeq d_p$.

The LF simulation. Bidimensional maps of Yaglom components  $\boldsymbol {Y}_1$ (equation (3.2)),
 $\boldsymbol {Y}_2$ (equation (3.3)) and
 $\boldsymbol {Y}_3$ (equation (3.4)); and Hall components
 $\boldsymbol {H}_1$ (equation (3.5)) and
 $\boldsymbol {H}_2$ (equation (3.6)), of the mean rate of total energy injection, estimated at the scale
 $\ell \simeq d_p$.

The HVM simulation. Two-dimensional maps of Yaglom components  $\boldsymbol {Y}_1$ (equation (3.2)),
 $\boldsymbol {Y}_2$ (equation (3.3)) and
 $\boldsymbol {Y}_3$ (equation (3.4)); and Hall components
 $\boldsymbol {H}_1$ (equation (3.5)) and
 $\boldsymbol {H}_2$ (equation (3.6)), of the mean rate of total energy injection, estimated at the scale
 $\ell \simeq d_p$.

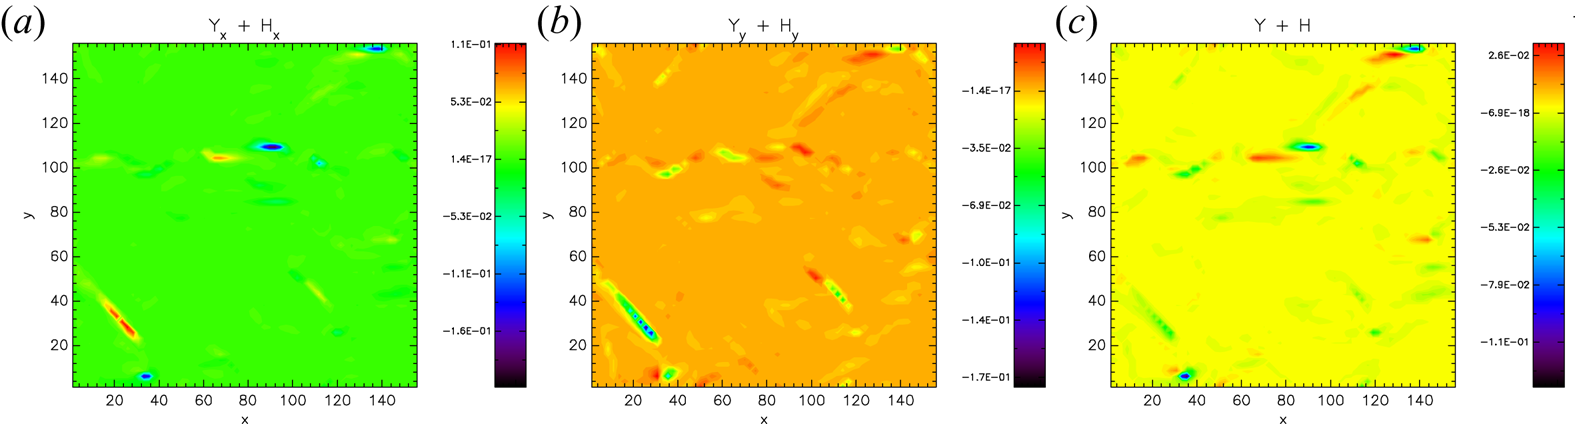
Finally, the maps of  $\boldsymbol {Y} + \boldsymbol {H}$ are separated by components in figure 6 for the HVM simulation (similar behaviour was found in HMHD and LF simulations – not shown here). While the general behaviour is similar, some differences between the two components of the energy transfer exist, possibly an effect of the finite size of the ensemble.
The  $x$ (a) and
 $y$ (b) components of the term
 $\boldsymbol {Y} + \boldsymbol {H}$ (c), computed from the HVM simulation, estimated at the scale
 $\ell \simeq d_p$.

4. Global energy transfer analysis
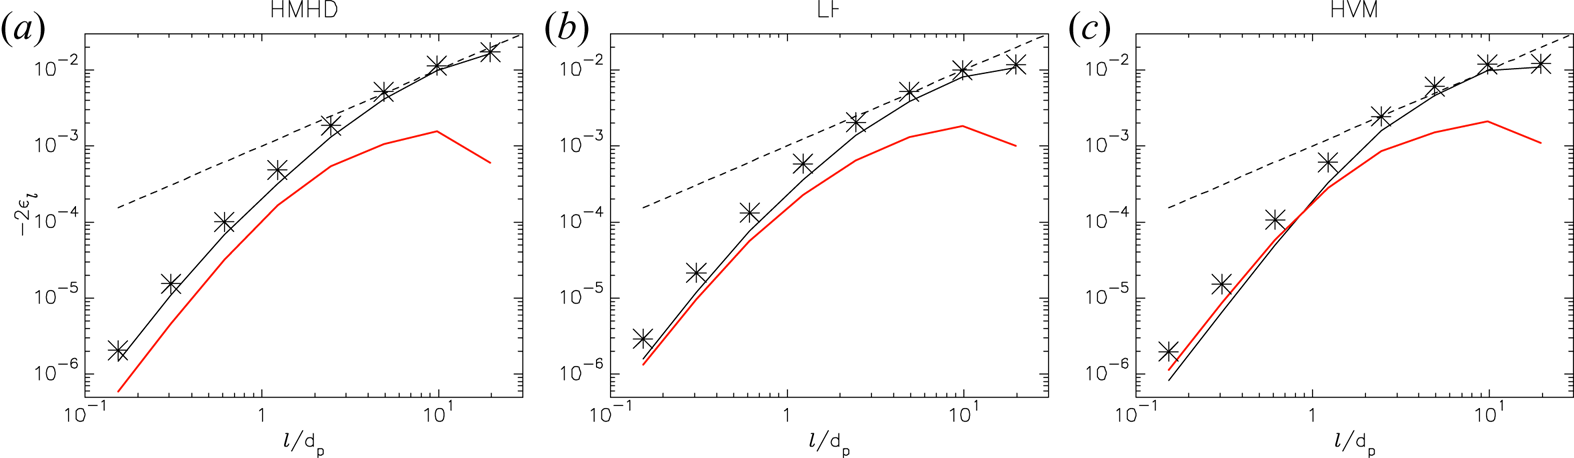
We continue our analysis computing the local turbulent energy transfer rate  $- 2 \epsilon _\ell$ across the scales
 $\ell$. Figure 7 presents the averaged (3.7) over the whole domain, corresponding to the HMHD (figure 7a), LF (figure 7b) and HVM (figure 7c) simulations. We separate the Yaglom (black-solid line) and Hall (red-solid line) contributions in order to highlight their relative amplitude across the scales
 $\ell$. The sum of both contributions, giving the Hall–Yaglom law, is plotted with asterisks. As already observed in the previous section, in the HMHD and LF simulations, the Hall contribution
 $\epsilon _{H(\ell )}$ is always less than the Yaglom one. However, both contributions become closer for scales
 $\ell \lesssim d_p$. In the case of the HVM simulation, that occurs in the range
 $\ell \lesssim d_p$,
 $\epsilon _{H(\ell )} > \epsilon _{Y(\ell )}$. Then, at
 $\ell \approx d_p$,
 $\epsilon _{Y(\ell )}$ becomes more relevant and remains so for larger scales. This behaviour is consistent with the settings of our simulations, where the mean field is out-of-plane, and there is strong whistler/magnetosonic activity. Linear theory studied by Camporeale & Burgess (Reference Camporeale and Burgess2017) supports this interpretation, which is also compatible with earlier results from hybrid and full kinetic two-dimensional simulations reported by Cerri et al. (Reference Cerri, Califano, Jenko, Told and Rincon2016) and by Grošelj et al. (Reference Grošelj, Cerri, Navarro, Willmott, Told, Loureiro, Califano and Jenko2017). If we recall that the Hall term
 $\epsilon _H$ manifests itself through compressible activity, the cascade rates are expected to be affected in the fluid simulations; while in the HVM simulation, this compressible activity is suppressed through in-plane Landau damping and ion-cyclotron resonances, which re-inject in the system incompressible Alfvénic-like fluctuations. In this two-dimensional setting, the LF model, in which Landau dissipation is introduced at a quasilinear level, partially quenches compressible fluctuations, but not as efficiently as the HVM one. In addition, we can confirm that in the interval
 $2 d_p \lesssim \ell \lesssim 10 d_p$ (roughly corresponding to the MHD turbulence range), the scaling of
 $- 2 \epsilon _\ell$ is compatible with a linear scaling law (black-dashed line) for our three cases of study, as previously reported by Sorriso-Valvo et al. (Reference Sorriso-Valvo, Perrone, Pezzi, Valentini, Servidio, Zouganelis and Veltri2018).
Cascade rate  $-2 \epsilon _\ell$ law as a function of the scale
 $\ell$, conducted in the HMHD (a), LF (b) and HVM (c) simulations. The contributing terms
 $\epsilon _Y$ (black-solid line) and
 $\epsilon _H$ (red-solid line) are presented together with their direct sum (asterisks). The dashed line represents the linear scaling.

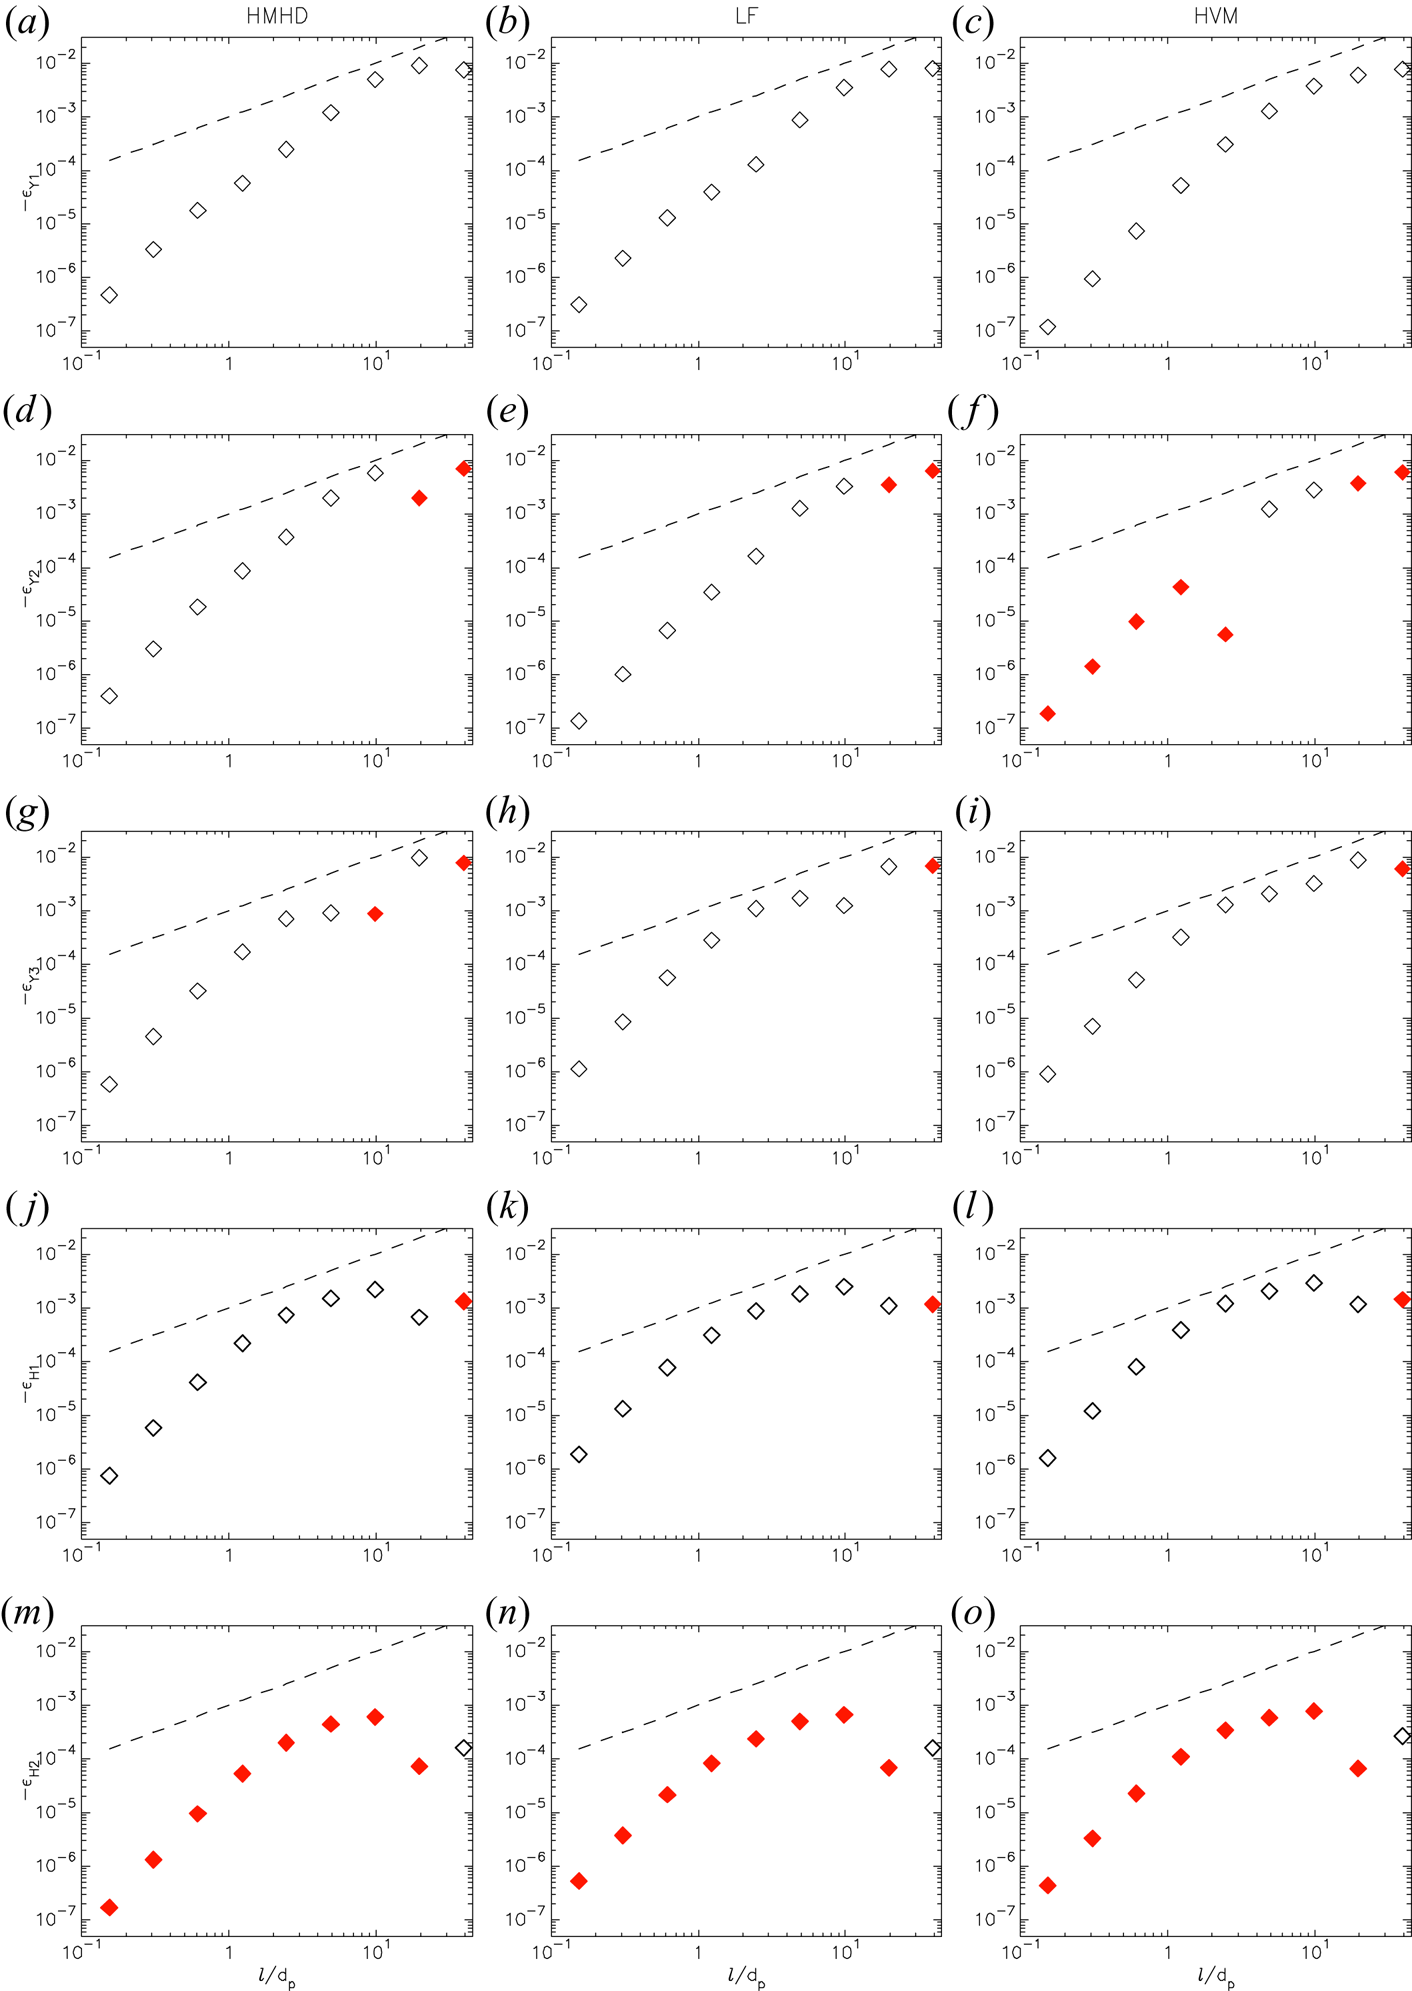
Moreover, in figure 8 we can see how Yaglom  $-\epsilon _{Y_m}$ and Hall
 $-\epsilon _{H_n}$ terms are supporting the latter global behaviour. We use open diamonds to picture the positive terms, while negative quantities are plotted with red-filled diamonds. Figure 8(a,d,g,j,m) shows the HMHD simulation results, figure 8(b,e,h,k,n) corresponds to the LF simulation, while the results from the HVM simulation are presented in figure 8(c,f,i,l,o). If we focus on the amplitude and sign of these quantities, we cannot note substantial differences between the individual Hall contributions among the simulations. However, the sign of
 $-\epsilon _{Y_2}$ (associated with the magnetic energy transported by the velocity field) is passing from negative to positive at
 $\sim 2 d_p$ in the HVM simulation. This is not seen in the HMHD and LF counterparts.
Terms  $-\epsilon _{Y_1}$ (a–c),
 $-\epsilon _{Y_2}$ (d–f),
 $-\epsilon _{Y_3}$ (g–i),
 $-\epsilon _{H_1}$ (j–l) and
 $-\epsilon _{H_2}$ (m–o). The components are computed from the HMHD (a,d,g,j,m), LF (b,e,h,k,n) and HVM (c,f,i,l,o) simulations. Open diamonds correspond to the positive sign, while red-filled diamonds show negative values. Linear scaling is plotted with a black-dashed line.

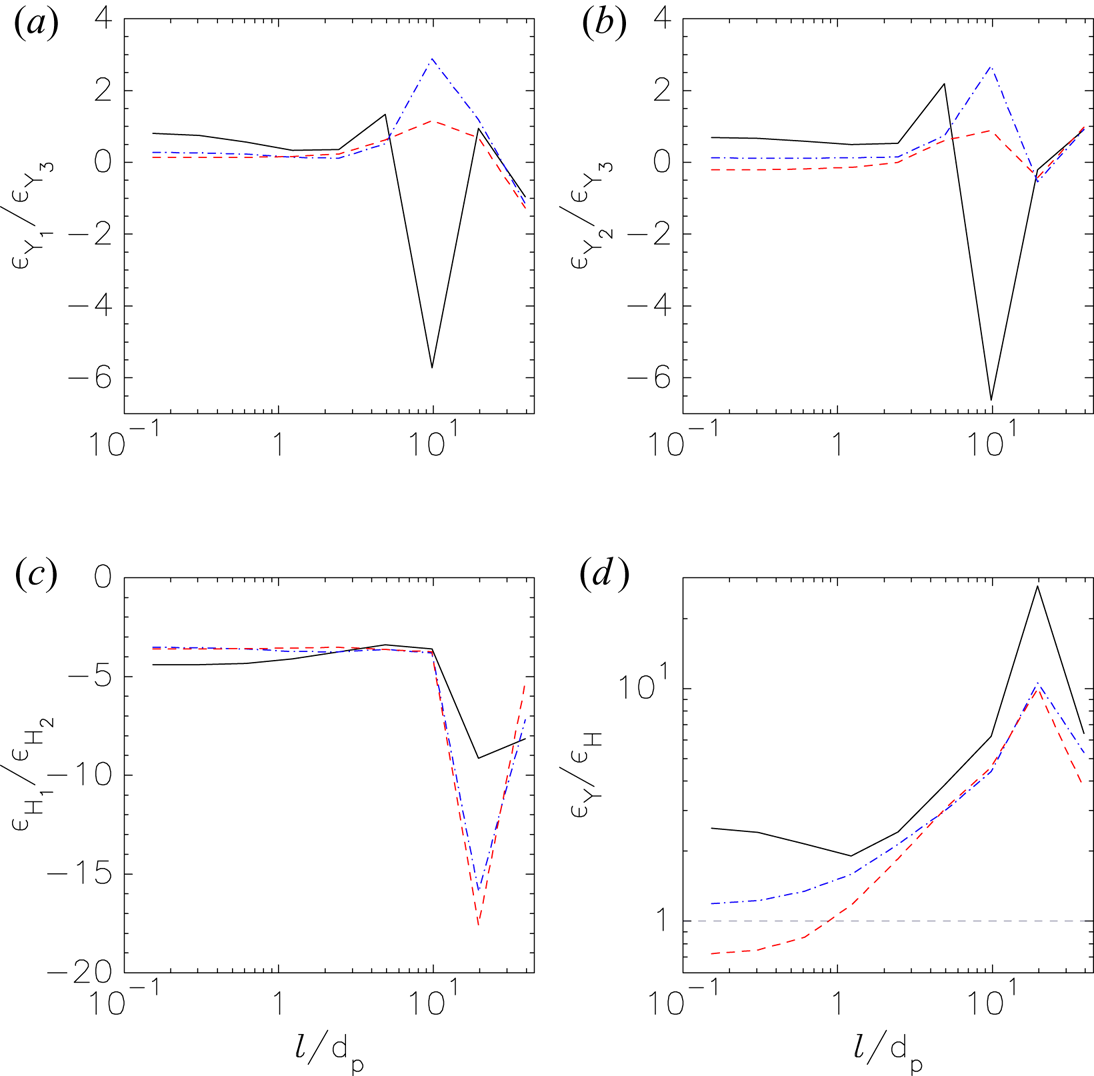
Finally, we use our results to compare the amplitude of each of the Yaglom and Hall terms across the scales. In figure 9, we present these comparisons for the Yaglom terms:  $\epsilon _{Y_1} / \epsilon _{Y_3}$ (figure 9a) and
 $\epsilon _{Y_2} / \epsilon _{Y_3}$ (figure 9b). Comparison of Hall terms
 $\epsilon _{H_1} / \epsilon _{H_2}$ is shown in figure 9(c). Figure 9(d) shows
 $\epsilon _{Y} / \epsilon _{H}$. Black-solid line represents the HMHD simulation, blue-dash-dotted line represents the LF results and red-dashed line is for the HVM simulation. From a global point of view, we note that the comparisons computed from the LF and HVM simulations are quite similar, especially for scales
 $\ell \lesssim 10 d_p$. After this range, the sign of
 $\epsilon _{Y_3}$ fluctuates with respect to that of
 $\epsilon _{Y_1}$ and
 $\epsilon _{Y_2}$. On the other hand, the sign of
 $\epsilon _{H_1}$, as compared with
 $\epsilon _{H_2}$, remains negative for all of the scales. Once again, the LF and HVM simulations seem quite similar when comparing the Hall terms. The comparison
 $\epsilon _{Y} / \epsilon _{H}$ shows that the HVM simulation is useful for study the transition from fluid to kinetic scales (
 $\sim d_p$) as we can see when comparing this ratio.
(a,b) Comparison of the Yaglom terms  $\epsilon _{Y_1}$ and
 $\epsilon _{Y_2}$, with respect to
 $\epsilon _{Y_3}$. (c) Comparison between the Hall terms (
 $\epsilon _{H_1}$ and
 $\epsilon _{H_2}$). (d) Comparison between
 $\epsilon _{Y}$ and
 $\epsilon _{H}$, where the horizontal grey-dashed line marks the barrier of
 $\epsilon _{Y}/\epsilon _{H} = 1$. Black-solid line corresponds to the HMHD simulation, blue-dash-dotted line corresponds to the LF simulation and the HVM simulation is represented by the red-dashed line.

5. Discussion and conclusions
In this paper we study the properties of energy transfer contributions in collisionless turbulent plasmas. For this scope, the heuristic proxy LET was computed for three numerical simulations (HMHD, LF and HVM) of a quasi-steady state of turbulence. Moreover, this study would also be aligned to the ‘Turbulent Dissipation Challenge’ (Parashar et al. Reference Parashar, Salem, Wicks, Karimabadi, Gary and Matthaeus2015), as we test the LET proxy on three different numerical models (which use different numerical schemes) under the same initial conditions, with similar physical and numerical parameters. We have in mind that each of these models have their own characteristic scale. In the HVM model, this scale corresponds to the proton skin depth. In the fluid models, this scale corresponds to the dissipative scale, where the energy is dissipated by viscous and resistive effects.
In figures 3–5, we presented bidimensional maps for each of the simulations, and for the scale  $\ell \approx d_p$. In particular, in figure 6 we show the location and intensity of the structures where most of the energy is contributing to the cross-scale transfer.
Then, figure 7 tests the  $-2 \epsilon _\ell$ cascade-rate definition ((3.7)). Here, when only the global contribution of
 $\epsilon _Y + \epsilon _H$ is plotted (asterisks), no strong differences are seen between our set of simulations. However, when
 $\epsilon _Y$ (black-solid line) and
 $\epsilon _H$ (red-solid line) are separated, we note that in the HVM simulation
 $\epsilon _H > \epsilon _Y$ for scales
 $\ell \lesssim d_p$, not observed for the other simulations. This difference is likely due to the slightly larger values and fluctuations of the current observed in the HVM case (see, for example, figure 1 in Perrone et al. (Reference Perrone, Passot, Laveder, Valentini, Sulem, Zouganelis, Veltri and Servidio2018)). We further point out that a net contribution in the energy budget might be due to the pressure anisotropy, which is not taken into account in the fluid Yaglom theory as briefly discussed in § 3.
We observe that  $\epsilon _{Y_2} \sim (\delta \boldsymbol {B} \boldsymbol {\cdot } \delta \boldsymbol {u}) \delta u_\ell$ have opposite sign – for the majority of the scales – in the HVM simulation, with respect to the fluid simulations (figure 6). Also for this parameter, a change of monotonicity may be noticed in the interval
 $2 d_p \lesssim \ell \lesssim 10 d_p$ (roughly corresponding to the MHD turbulence range) only in the HVM simulation. The reason for this behaviour is not fully understood.
Finally, the comparisons made in figure 9 show similarity between our set of simulations for scales  $\ell \lesssim 2 d_p$. After this range, the contribution of
 $\epsilon _{Y_3}$ decreases with respect to
 $\epsilon _{Y_1}$ (figure 9a) and
 $\epsilon _{Y_2}$ (figure 9b). A similar behaviour, related to the direction of the energy cascade, is seen when comparing the Hall terms (figure 9c), where the amplitude of
 $\epsilon _{H_2}$ decreases more about one decade with respect to
 $\epsilon _{H_1}$ when
 $\ell \gtrsim 10 d_p$.
Our overall conclusion is that the three simulations are similar, but not exactly identical, with respect to the local and global turbulent energy transfer. This implies that a cross-scale interconnection exists between fluid and kinetic dynamics, so that not only does the turbulent cascade drive the small-scale kinetic processes, but the latter also controls the cascade, acting as a form of dynamical dissipation. Further studies are needed to describe in more detail such interconnection. Work in progress includes the extension of energy transfer analysis in three-dimensional simulations and a multifractal study of the turbulence (Primavera & Florio Reference Primavera and Florio2019).
Acknowledgements
C.L.V. was partially supported by EPN projects PIM-19-01, PII-DFIS-2019-01 and PII-DFIS-2019-04. L.S.-V. was funded by the Swedish Contingency Agency, grant 2016-2102. R.M. acknowledges support from the project ‘EVENTFUL’ (ANR-20-CE30-0011), funded by the French Agence nationale de la recherche (ANR) through the programme ANR AAPG2020 CE30 JCJC. C.L.V. acknowledges valuable discussions with O. Pezzi and A. Enriquez.
Editor Francesco Califano thanks the referees for their advice in evaluating this article.
Declaration of interests
The authors report no conflict of interest.