There has been much interest in nanotwinned (NT) metals, largely due to the potential for simultaneous strength and ductility, corrosion resistance, and thermal stability in comparison with nanocrystalline metals.[ Reference Lu 1 – Reference Zhang and Misra 5 ] Owing to these properties, efforts have been made to introduce nanotwins into common engineering alloys such as various steels and brass.[ Reference Yan, Liu, Tao and Lu 6 – Reference Wang, Tao and Lu 9 ] However, those studies only produced partially NT samples and therefore the impact of the alloy content cannot be isolated. Thus, in order to further advance and effectively utilize NT structures in alloys, it is important to first understand the behavior of fully NT systems of various compositions.
The mechanical behavior of fully NT metals has been investigated primarily in single-element NT Cu focusing on how microstructural parameters such as twin thickness and grain size influence the properties.[ Reference Lu, Chen, Huang and Lu 10 – Reference Zhu, Ruan, Li, Dao, Gao and Lu 13 ] It has been shown in equiaxed NT Cu that decreasing twin thickness leads to higher strength and ductility down to a ‘critical twin thickness’, typically of the order of nanometers, below which the ductility continues to increase but strength decreases.[ Reference Lu, Chen, Huang and Lu 10 ] Simulations on equiaxed NT Cu indicate that this ‘critical twin thickness’ decreases as grain size is reduced, and so it is possible to achieve higher strengths at smaller grain sizes.[ Reference Yujie 12 , Reference Zhu, Ruan, Li, Dao, Gao and Lu 13 ] There is also a potential loss of ductility with decreasing grain size, as indicated in some experimental results.[ Reference Chen, Lu and Lu 11 ] In the case of alloys, due to the lack of fully NT samples, mechanical results are still lacking since the effect of the alloying has not been isolated from the effect of the twins.
This study aims to understand how microstructural parameters, specifically varying grain width, influence the mechanical behavior of fully NT alloys. The alloys used in this study include Cu–6 wt.%Al, Cu–2 wt.%Al, and Cu–10 wt.%Ni, which will be referred to as Cu6Al, Cu2Al, and Cu10Ni, respectively. All alloys are solid solution FCC metals with stacking fault energies (SFEs) ranging an order of magnitude with values of 6, 37, and 60 mJ/m2.[ Reference Grace and Inman 14 – Reference Rohatgi, Vecchio and Gray 16 ] Extensive mechanical (tensile and nanoindentation) and microstructural characterization were performed for all samples with the goal of educing the influence of nanotwins in the different alloy systems.
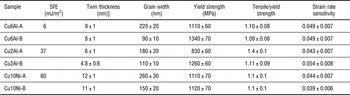
The samples in this study were synthesized by magnetron sputtering; 15–20 µm-thick fully NT films were sputtered onto Si (100) substrates using Cu6Al, Cu2Al, and Cu10Ni targets, following procedures outlined by Velasco and Hodge[ Reference Velasco and Hodge 17 ]. The films were peeled from the substrate, generating free-standing films. For each alloy, two films were sputtered with similar average twin thicknesses, ranging from 5 to 11 nm, and varying average grain widths, ranging from 90 to 260 nm. Cross-sectional transmission electron microscope (TEM) samples of free-standing films were prepared with a Fischione 1050 ion mill and observed in a JEOL 2100F TEM. Over 300 twins and 100 grains were measured for each film in order to quantify the average twin thicknesses and grain widths shown in Table I. In addition, top surface electron backscatter diffraction (EBSD) was performed to identify differences in material texture.
Stacking fault energies, average microstructural parameters, mechanical properties, and measured strain rate sensitivities (nanoindentation) of fully NT Cu6Al, Cu2Al, and Cu10Ni samples[ Reference Grace and Inman 14 – Reference Rohatgi, Vecchio and Gray 16 ]

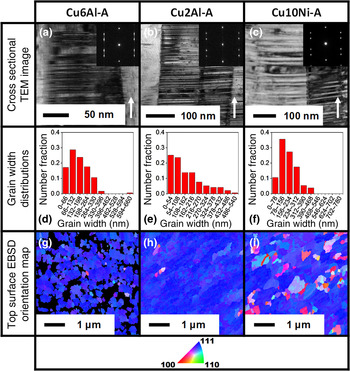
Figure 1 displays representative cross-sectional TEM images, grain width distributions, and top surface EBSD orientation maps for the largest grained sample for each composition (as shown in Table I). All measured grains in TEM images were utilized to determine grain width distributions for the six films; Figs. 1(d)–1(f) depict typical distributions. All samples showed similar trends in the distributions except for Cu2Al-A [Fig. 1(e)], where a higher percentage of large grain widths were observed; roughly 11 % of the grains were larger than 200 % of the average, compared with <1 % in the other samples. Comparing TEM and EBSD images, the Cu6Al and Cu2Al samples in the study showed similar microstructures where samples contain all horizontally aligned twins and vertical columnar grains, and most of the grains have an orientation close to (111) in the growth direction. In contrast, 5–15 % of the grains in the Cu10Ni films do not show a (111) texture.
Microstructural characterization images showing representative cross-sectional TEM images and inset diffraction patterns where the white arrow indicates growth direction (a–c), grain width distribution scaled proportional to average grain width (d–f), and top surface EBSD grain orientation maps (g–i) of Cu2 wt.%Al, Cu–6 wt.%Al, and Cu–10 wt.%Ni samples. The color in the EBSD images corresponds to the orientation in the growth direction according to the legend on the bottom (color available online). Black locations in EBSD indicate poorly indexed regimes where the average grain confidence index is below 0.1.

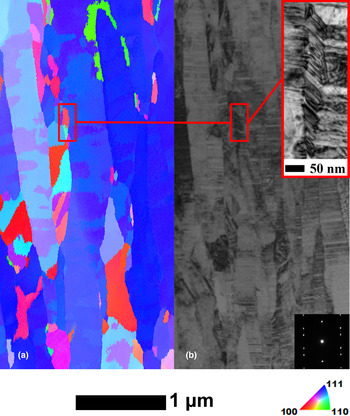
To better understand the microstructure of the non-(111) regimes in the Cu10Ni films, FIB liftout was performed to extract a lamella from the Cu10Ni-A film. Both transmission EBSD (t-EBSD) and TEM were performed on the same section of this sample to characterize the microstructure. The t-EBSD orientation map is shown in Fig. 2(a), where the colors indicate the orientation of the grains in the growth direction, analogous to Fig. 1. Note that the spatial resolution of t-EBSD does not allow for twins to be resolved, which is compensated for by the TEM image in Fig. 2(b), where the NT microstructure can be observed. As can be seen in the t-EBSD image in Fig. 2(a), there are multiple columnar grains, which are not (111) oriented and correlate to the top surface EBSD map of Cu10Ni-A in Fig. 1. Higher magnification TEM images, such as the inset in Fig. 2(b), indicate that there are twin boundaries, which are tilted to the growth direction in the regimes that are not (111) oriented. This highlights a clear difference in the alloys investigated in this study, as tilted boundaries are only observed in the Cu10Ni samples.
Cross-sectional TEM image (a) and t-EBSD orientation map (b) of Cu10Ni-A. Colors in the orientation map correspond to the crystal orientation in the growth direction, analogous to Fig. 1 (color available online). The top-right inset image highlights the representative microstructure of non-(111) oriented regimes, where twin boundaries tilted to the growth direction are observed. The bottom-right inset represents a typical SAED pattern.

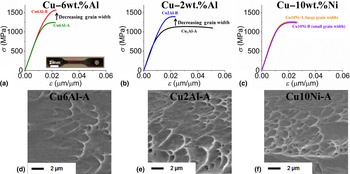
Tensile tests were carried out using free standing films, which were mechanically polished into multiple dogbones with geometries based on ASTM E345-93 with reduced sections of roughly 0.8 × 3.2 mm2. Three tests were carried out on each film following procedures outlined elsewhere.[ Reference Heckman, Velasco and Hodge 18 ] Representative stress–strain curves are shown for the Cu6Al [Fig. 3(a)], Cu2Al [Fig. 3(b)] and Cu10Ni [Fig. 3(c)] films, where the behavior for large and small grain width is compared for the various alloys. The average 0.2 % offset yield strengths as well as ratios of tensile to yield strength can be found in Table I. Representative scanning electron microscope (SEM) images of the fracture surfaces for each alloy are shown in Figs. 3(d) and 3(e), where all samples displayed microvoid coalescence as a fracture mechanism. Note that digital image correlation (DIC) was performed on each film during the tensile tests, where all samples displayed localized shear band like behavior similar to what was observed previously.[ Reference Heckman, Velasco and Hodge 18 ]
Stress–strain curves comparing the impact of grain width on the mechanical behavior for NT Cu6Al (a), Cu2Al (b), and Cu10Ni (c). Representative SEM micrographs of fracture surfaces are shown for Cu6Al-A (d), Cu2Al-A (e), and Cu10Ni-A (f) samples.

As observed in Figs. 3(a)–3(c), all of the alloys display similar strengths and relatively low ductility despite the presence of tilted twin boundaries in the Cu10Ni samples. Previous simulations have found that that when twin boundaries are tilted to the loading direction in NT Cu, the dominance of an ‘easy mode’ slip system can allow for higher ductility and lower strengths compared with twin boundaries, which are orthogonal or parallel to the loading direction.[ Reference Sun, He and Lu 19 – Reference Zhu and Gao 21 ] However, in NT Cu it has been shown that the twin thickness should be below 6 nm for ‘easy mode’ slip to be dominant for grain sizes below 250 nm.[ Reference Yujie 12 , Reference Gu, Dao, Asaro and Suresh 22 , Reference Xiaoyan, Yujie, Lei, Ke and Huajian 23 ] Therefore, the lack of improvement in ductility in the Cu10Ni samples may be due to having average twin thicknesses about 12 nm.
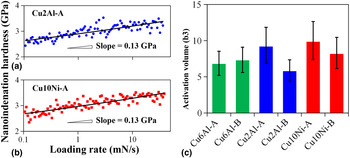
The stress–strain curves in Fig. 3 also indicate a clear difference in the response to varying grain width for all samples. In Figs. 3(a) and 3(b), a comparable decrease of about 100 nm in grain width corresponds to an increase in yield strength of more than 200 MPa for both Cu6Al and Cu2Al, and a decrease in ductility (strain to failure) for Cu2Al. Note that the higher ductility observed in Cu2Al-A may be related to the higher percentage of large grain widths [Fig. 1(e)]. In addition, Cu2Al-A shows the highest strain hardening capacity of the studied materials (as indicated by the tensile to yield strength ratio in Table I), correlated with increased ductility in nanostructured metals.[ Reference Wang and Ma 24 ] In contrast, there is no measurable difference in the tensile behavior in Cu10Ni, shown in Fig. 3(c). This suggests that the response in mechanical behavior of NT alloys to microstructural changes may vary depending on alloy content, which in turn determines the SFE. The SFE is an important parameter since it affects the deformation mechanisms and behavior of both coarse grained and nanocrystalline FCC metals.[ Reference Grace and Inman 14 , Reference Rohatgi, Vecchio and Gray 16 , Reference Rice 25 – Reference Yamakov, Wolf, Phillpot, Mukherjee and Gleiter 27 ] While direct observation of the active deformation mechanism requires in situ testing, some information can be obtained by measuring the activation volume, which is influenced by the rate-controlling deformation mechanism in a material.[ Reference Asaro and Suresh 28 ] A method for experimentally quantifying activation volume via nanoindentation at varying loading rates has been identified by Lu et al.,[ Reference Lu, Schwaiger, Shan, Dao, Lu and Suresh 29 ] where the activation volume, v*, is calculated[ Reference Zackay 30 ] as:
 $$v* = \sqrt 3 kT\left[ {\displaystyle{{\partial \ln (\dot \varepsilon )} \over {\partial \sigma}}} \right],$$
where k is the Boltzmann constant, T is the ambient temperature,
 $\dot \varepsilon $
is the strain rate (assumed to be equivalent with the loading rate[
Reference Lu, Schwaiger, Shan, Dao, Lu and Suresh
29
]), σ is the flow stress (assumed to be 1/3 of the hardness), and
 $\sqrt 3 $
is an assumed term. Nanoindentation tests were performed on each sample with a total of 100 indents at a peak load of 8 mN with loading rates varying from 0.1 to 20 mN/s in order to determine the activation volume of each film. Representative curves showing the hardness as a function of loading rate are found in Figs. 4(a) and 4(b), and calculated activation volumes are shown in Fig. 4(c), where it is observed that all samples have activation volumes with values of 5–10b3 (where b is the Burgers vector).
Nanoindentation hardness as a function of loading rate with a peak load of 8 mN for Cu2Al-A (a) and Cu10Ni-A (b), utilized to estimate the activation volume, which is shown for each sample in (c)

The samples do not show a significant difference in activation volume despite an order of magnitude change in the SFE. This indicates that an overall change in deformation mechanism is not responsible for the different response to grain width observed in the Cu10Ni compared with the Cu2Al and Cu6Al samples, further supported by the similar fracture mechanisms observed in SEM where all samples show a plastic fracture mechanism of microvoid coalescence. The calculated activation volumes are similar to those reported for nanocrystalline and NT Cu (3–20b3), where dislocation nucleation is believed to play a primary role in the material deformation.[ Reference Lu, Schwaiger, Shan, Dao, Lu and Suresh 29 , Reference Conrad 31 ] The films with the highest activation volumes are Cu10Ni-A and Cu2Al-A with values about 10b3. Both of these samples also have the largest grain width for their compositions, indicating that grain width can influence the activation volume, similar to grain size in nanocrystalline metals.[ Reference Yamakov, Wolf, Phillpot, Mukherjee and Gleiter 27 , Reference Asaro and Suresh 28 , Reference Asaro, Krysl and Kad 32 ]
The question still remains why there is a lack of response to grain width in the Cu10Ni samples compared with Cu2Al and Cu6Al, despite there being no apparent difference in the deformation mechanism. It is possible that the answer is related to a transition that occurs in NT metals when the twin thickness reaches a critical value (about 6 nm in NT Cu), above which grain width does not significantly influence the material's strength.[ Reference Gu, Dao, Asaro and Suresh 22 , Reference Xiaoyan, Yujie, Lei, Ke and Huajian 23 ] Basically, the transition indicates where the dislocations generate from; simulations have shown that below the critical twin thickness, dislocation nucleation from twin boundary to twin boundary is suppressed and dislocations primarily nucleate from grain boundaries[ Reference You, Li, Gui, Lu, Zhu, Gao and Lu 20 , Reference Gu, Dao, Asaro and Suresh 22 , Reference Xiaoyan, Yujie, Lei, Ke and Huajian 23 ]. A similar size-related transition has been reported in nanocrystalline metals, where a higher SFE typically correlates with a smaller transition grain size.[ Reference Yamakov, Wolf, Phillpot, Mukherjee and Gleiter 27 , Reference Asaro and Suresh 28 , Reference Asaro, Krysl and Kad 32 ] Since Cu10Ni has the largest SFE in this study, it could have the smallest critical twin thickness. In this case, the grain width would have a less significant impact in the strength of Cu10Ni samples and agrees with the observed stress/strain curves presented in Fig. 3(c).[ Reference Gu, Dao, Asaro and Suresh 22 , Reference Xiaoyan, Yujie, Lei, Ke and Huajian 23 ]
In this study, the mechanical behavior of magnetron sputtered fully NT Cu6Al, Cu2Al, and Cu10Ni films is analyzed. Tilted twin boundaries present in the Cu10Ni samples do not seem to significantly introduce any ductility into the material when compared with CuAl samples. The impact of grain width on the different samples varies by alloy content, where NT Cu2Al and Cu6Al alloys show increasing strength with decreasing grain width, and no change is observed in NT Cu10Ni. This dissimilarity in response to grain width does not appear to be due to an overall change in the deformation mechanism, as all the materials tested have similar activation volumes ranging from 5 to 10b3. The results from this study indicate that alloy content, correlated to the SFE, is an important factor to consider in the design of NT alloys, as it can affect how microstructure impacts the mechanical properties of the materials.
Acknowledgements
This work was performed under the auspices of NSF grant number DMR-0955338. We would like to thank the Center for Electron Microscopy and Microanalysis (CEMMA) at USC for their support and provision of electron microscopy equipment.