Introduction
Polyethylene is one of the most extensively produced synthetic polymers globally, with production volumes reaching 368 million metric tons in 2019 (Jones and Pathak, Reference Jones and Pathak2025). Its ease of manufacturing, low cost, and durability have led to its widespread use, particularly in low-density polyethylene (LDPE) form, for packaging materials such as plastic bags. However, the chemical and physical properties that make LDPE a desirable material, specifically its high molecular weight, hydrophobicity, and stable C–C backbone, render it highly resistant to degradation (Bachmann and Ong, Reference Bachmann and Ong2024). Although biodegradable polymers are alternatives to conventional synthetic plastics, their widespread adoption is impeded by several factors. The durability of some biodegradable polymers is comparable to that of their artificial counterparts; however, the production of synthetic plastics remains economically viable. This economic disparity creates a disincentive for manufacturers to transition to biodegradable polymer production, thereby limiting their potential to mitigate current plastic pollution issues (Khandare et al., Reference Khandare, Chaudhary and Jha2021). LDPE is among the most widely produced and utilised synthetic plastics. The global consumption of LDPE, primarily for the production of plastic bags, is approximately 0.5–1 trillion units per year (Nielsen et al., Reference Nielsen, Holmberg and Stripple2019). LDPE exhibits significant robustness and stability. The intrinsic physicochemical properties of LDPE, such as its hydrophobicity and high molecular weight, confer high resistance to degradation, making it one of the most common polymers found in the environment (Fibriarti et al., Reference Fibriarti, Feliatra, Amin and Darwis2021; Hariadi et al., Reference Hariadi, Saleh, Yamin and Aprilia2021). Consequently, the improper disposal of LDPE waste results in its accumulation in terrestrial and aquatic environments, posing a significant ecological threat (Shamsuddin et al., Reference Shamsuddin, Zulkifli, Abidin, Alias, Naim, Mutalib and Muhamad2025). The accumulation of plastic waste in dumpsites leads to the generation of secondary pollutants, including leachate and the formation of small plastic particles known as microplastics, which have the potential to contaminate waterways and also contaminate soil, alter its physical properties, and introduce xenobiotic compounds into the food web (Cindrella and Renjith, Reference Cindrella and Renjith2025). The translocation of these microplastics and their associated toxins through trophic levels can lead to bioaccumulation, presenting potential health risks to a wide range of organisms, including humans (Chen et al., Reference Chen, Shen, Lin, Huang, Zhao, Zhu and Zhao2025). A significant proportion of anthropogenically generated plastic waste is deposited into landfills and marine environments. This indicates that traditional approaches to plastic waste management, such as chemical recycling, landfilling, and incineration, are often insufficient. These approaches are cost-prohibitive and may generate secondary pollutants, including hazardous gases and toxic exudates (Sanniyasi et al., Reference Sanniyasi, Gopal, Gunasekar and Raj2021; Allahkarami and Allahkarami, Reference Allahkarami and Allahkarami2025). Open dumping and uncontrolled landfills, as well as even managed landfills, attract scavenging animals, insects, and other pests. The accumulation of municipal solid waste (MSW) creates an environment conducive to habitation and proliferation by various arthropod species. For instance, in the study by Abbasi et al. (Reference Abbasi, Rafinejad, Hosseinpoor, Gholami-Borujeni and Gholizadeh2019), out of nine insect orders, Coleoptera, Diptera, and Hymenoptera were the most prevalent, all of which include medically important species. Sixteen families and 25 genera of insects were collected, including the Muscid genera, Musca, Muscinia, Phannia, and Stomoxys. Musca, Psyllabora, and Phania were the most prevalent insect genera. In total, 33 species of arthropods were collected from the MSW landfill in Urmia (Abbasi et al., Reference Abbasi, Rafinejad, Hosseinpoor, Gholami-Borujeni and Gholizadeh2019). Notably, China is the country that contributes the most plastic debris to the world’s oceans, with Indonesia coming in second (Lestari and Trihadiningrum, Reference Lestari and Trihadiningrum2019). Therefore, there is a need for environmentally cost-effective and sustainable solutions for the remediation of plastic waste.
Bioremediation, which uses biological agents to break down pollutants, has emerged as a promising alternative to traditional pollution control methods. A significant focus of research into environmentally sound remediation techniques has been on biodegradation mediated by microorganisms. Certain microorganisms, including algae, fungi, and bacteria, are recognised for their potential as agents in the biodegradation of plastic; however, many demonstrate limited degradative capabilities (Brandon et al., Reference Brandon, Gao, Tian, Ning, Yang, Zhou and Criddle2018). Consequently, further investigation into effective biodegradation agents is imperative to address the critical issue of global plastic waste.
Insects are often the first organisms to experience the direct effects of pollution, and their ability to adapt to or mitigate these effects offers valuable insights into the resilience of ecosystems under stress. For instance, certain insect species have evolved mechanisms to detoxify pollutants or tolerate environmental contaminants, which may help them persist in polluted habitats. Additionally, insects such as dung beetles, ants, and termites contribute significantly to soil health and waste decomposition, processes that are essential for maintaining ecosystem services and mitigating the impacts of environmental degradation. The diverse biochemical adaptations in insects, along with their role in bioremediation, offer promising avenues for developing sustainable environmental management practices (Abbasi, Reference Abbasi2025b). Several emerging studies have shown that macroorganisms, primarily insect larvae, can also consume and break down various types of plastic (Cassone et al., Reference Cassone, Grove, Elebute, Villanueva and LeMoine1922; Peng et al., Reference Peng, Su, Chen, Chen, Zhou, Benbow and Zhang2019; Wang et al., Reference Wang, Xin, Shi and Zhang2020; Yang et al., Reference Yang, Jialei and Xia2020; Zhu et al., Reference Zhu, Pan, Li, Liu, Liu, Zhou, Dai and Qian2021; Singh and Rao, Reference Singh and Rao2025). However, the research revealed a lack of information on the impact of plastic on the life cycle, as well as insufficient morphological and biochemical support. Tenebrio molitor, popularly called the yellow mealworm, has been demonstrated to break down polyethylene and polystyrene foams (Peng et al., Reference Peng, Sun, Wu, Chen, Shen, Zhou and Zhang2022). However, research specifically investigating its capacity to degrade LDPE in sheet form, which constitutes a significant portion of consumer plastic waste, remains limited (Xia et al., Reference Xia, Sun, Gurr, Vasseur, Xue and You2018; Lee et al., Reference Lee, Kim, Jeon, Yu, Lee, Li and Kim2020; Barrionuevo et al., Reference Barrionuevo, Vilanova-Cuevas, Alvarez, Martín, Malizia, Galindo-Cardona, de Cristóbal, Occhionero, Chalup, Monmany-Garzia and Godoy-Vitorino2022). While research on the larvae of T. molitor Linnaeus, 1758 (Coleoptera: Tenebrionidae), and their capacity to consume LDPE sheets remains limited, the escalating environmental concern about LDPE sheet pollution, particularly from plastic bags, necessitates further investigation into this insect’s polymer-degrading capabilities. Tenebrio molitor exhibits holometabolous development, moving through the four different phases of life: egg, larva, pupa, and adult (Khana et al., Reference Khana, Pandey, Næss, Cabrita, Fonseca, Maia and Overrein2023). The entire life cycle of T. molitor spans approximately 3–7 months, with a potential duration of up to 2 years, depending on environmental factors (Ribeiro et al., Reference Ribeiro, Abelho and Costa2018). Following copulation, adult females oviposit eggs that hatch within 10–12 days, resulting in a larval stage that lasts 3–4 months. Larvae undergo 8–10 instars before pupation, a phase that persists for 5–48 days (Gkinali et al., Reference Gkinali, Matsakidou and Paraskevopoulou2022). Subsequently, pupae metamorphose into adults, which typically survive for 1–3 months (Hong and Han Tand Kim, Reference Hong, Hang and Kim2020). The purpose of this study is to quantitatively assess the biodegradation of commercial LDPE sheets by T. molitor larvae. The objectives were to evaluate the survival and development of larvae fed an LDPE-inclusive diet; determine the extent of LDPE degradation through gravimetric analysis; characterise the morphological and chemical changes in the LDPE surface post-ingestion; and identify the metabolic by-products of LDPE degradation through spectroscopic analysis of larval frass.
Materials and methods
Larval maintenance and conditioning
Tenebrio molitor larvae were acquired from Promeal Company (India) and maintained under controlled laboratory conditions. The larvae were kept in ventilated plastic jars (2 L) at a steady temperature of 24 ± 2°C and 60% RH in the absence of light. Before experimental exposure to plastics, the larvae were fed a standardised diet containing a 3:1 ratio of wheat bran to wheat flour. This specific dietary regimen has been shown to enhance larval immune system function and promote increased body mass, making it optimal for T. molitor development throughout its life cycle (Yang et al., Reference Yang, Gao, Liu, Zhuang, Peng, Wu and Zhuang2021).
LDPE purchase
Commercial LDPE bags were sourced from a local retailer (Nidhi Enterprise India) to represent typical consumer plastic waste. Before the experiment, the bags were cleaned with deionised water and sterilised with 70% ethanol, followed by air drying under laminar flow (to remove moisture) and ultraviolet (UV) treatment. After that, they were cut into uniform 2 cm × 2 cm pieces for the feeding experiments and weighed to a constant weight for each group (210 mg).
Experimental setups
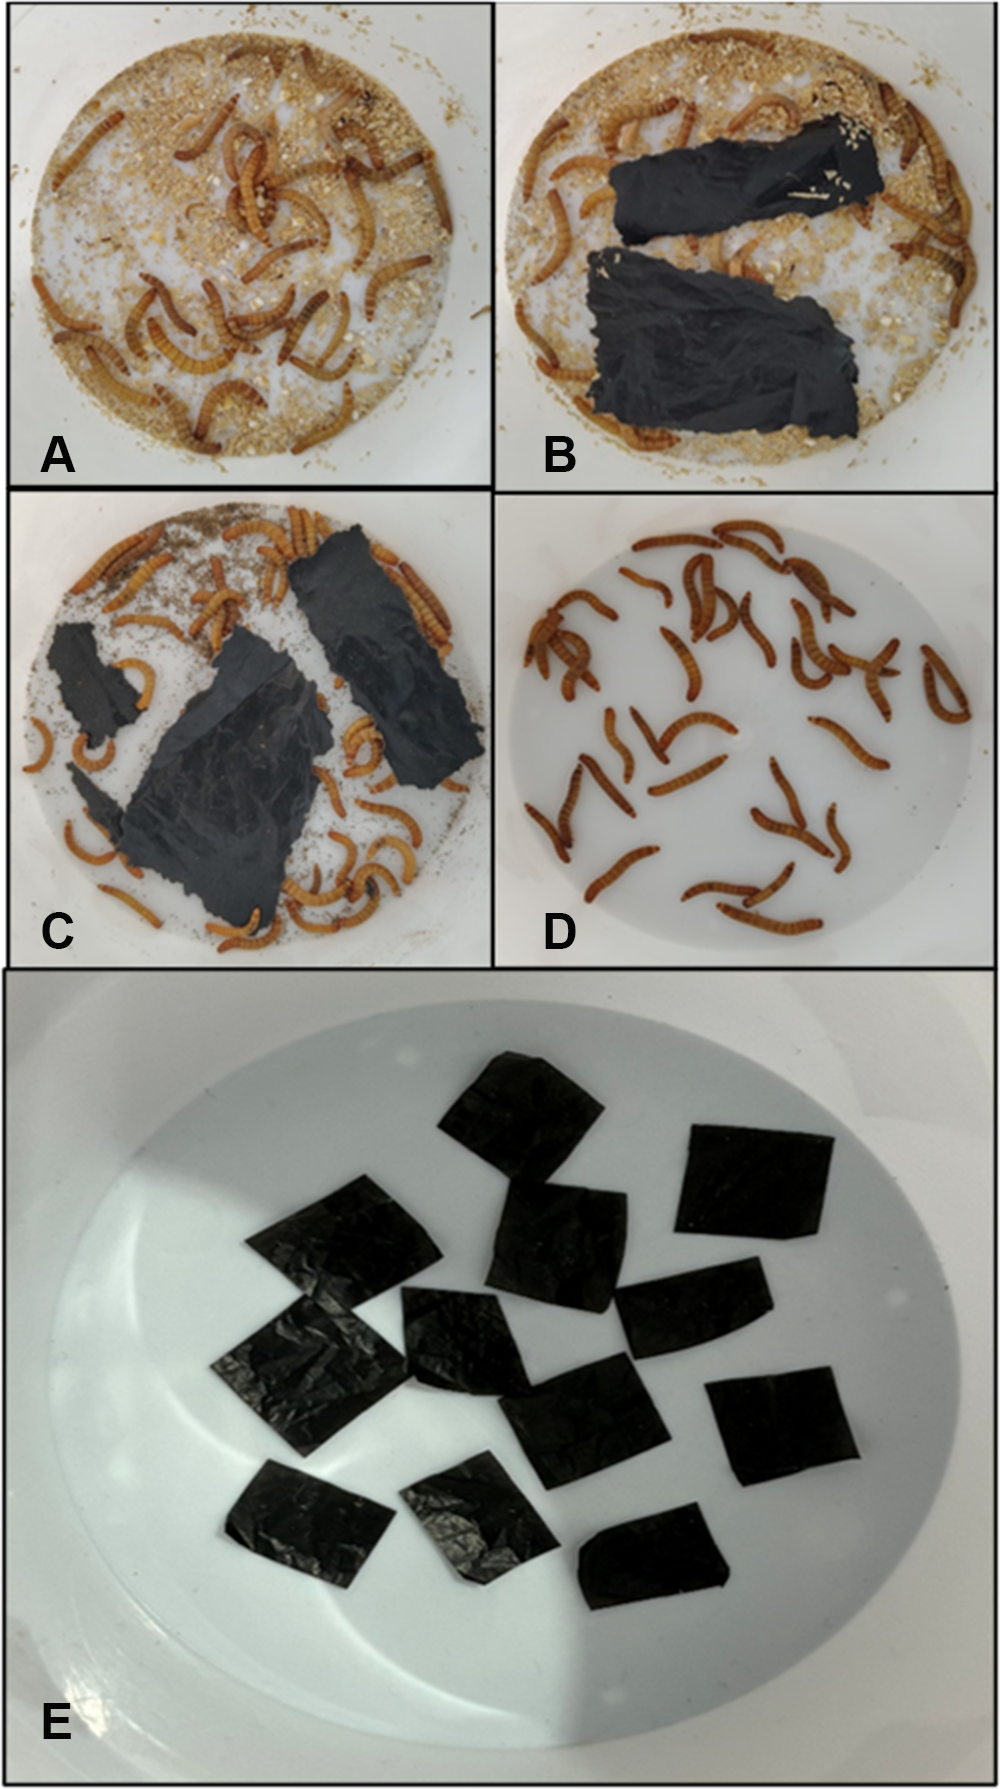
Healthy, active fourth larval stages of T. molitor of similar size were selected for the experiment. Before the feeding trial, all larvae were starved for 48 hours to purge their digestive tracts. The larvae were then randomly allocated to four experimentally treated groups according to the following method, with each group consisting of three replicates of 30 individuals each (fig. 1).
Experimental setups of Tenebrio molitor larvae: (A) Group T1 (diet), (B) Group T2 (LDPE and normal diet), (C) Group T3 (LDPE-fed only), (D) Group T4 (starvation), and (E) Group T5 (LDPE without larvae).

Figure 1 Long description
Five photographs of Petri dishes labeled A to E, each on a light background. Image A shows a dish with dozens of larvae on a granular brown substrate. Image B shows a dish with larvae and two black rectangles on a granular brown substrate. Image C shows a dish with larvae and three black rectangles on a granular brown substrate. Image D shows a dish with larvae on a light background without substrate. Image E shows a dish with about ten black rectangles on a light background, with no larvae present.
Group T1: Larvae were fed the standard artificial diet (wheat bran and flour).
Group T2: Larvae were fed a mixture of LDPE sheets and the artificial diet.
Group T3: Larvae were fed exclusively on LDPE sheets (2 cm × 2 cm piece of LDPE of approximately 210 mg).
Group T4: Larvae received no food.
Group T5: LDPE without larvae.
Groups T1 (standard diet) and T4 (starvation) were used to better understand the life expectancy of larvae fed a plastic diet compared with a regular diet and starvation conditions. Group T5 was set up to distinguish larval effects from abiotic factors, such as mechanical abrasion, oxidation, handling losses, and experimental artefacts. The larvae were housed in a cylindrical plastic container (height: 12 cm; base diameter: 8 cm; mouth diameter: 12 cm), and the experimental containers were maintained in a BOD (biochemical oxygen demand) incubator at 24°C for 21 days. The entire experiment had three replicas and was repeated three times to achieve optimal authenticity.
Impact of LDPE on the life cycle of larvae
Over the course of the 21-day experiment, each group’s parameters, such as survival rate, mortality, and pupation, were noted every seven days for all the treated groups and calculated as follows:
Survival rate
The percentage of larvae that remained alive after a predetermined time was used as the survival rate. It is a statistical metric that helps estimate the likelihood of surviving a condition. Here, the number of live larvae and pupae at any particular time was included in the survival rate. The formula used to calculate it was as follows:
 \begin{equation*}{\text{Survival}}\,{\text{Rate}}\,{\text{(SR) = }}\frac{{Nt + Np}}{{No}} \times 100\end{equation*}
where Nt was the number of alive larvae at time ‘t’, Np was the number of pupae formed, and the initial larval number was No.
Mortality rate
The mortality rate was used as the number of deaths in a given population over a specified time period, expressed as a percentage of the population’s size. Dead larvae were counted to determine the mortality rate, which was then computed using the following formula:
 ${\text{Mortality Rate }}\left( {{\text{MR}}} \right) = \frac{{N0 - \left( {Nt + Np} \right)}}{{N0}} \times 100$
where Nt was the number of alive larvae at time ‘t’, Np was the number of pupae formed, and the initial larval number was No.
Pupation
In some insects and other animals, pupation is the developmental stage during which the larva transforms into a pupa, a distinct stage characterised by a significant change in form before emerging as an adult. As a holometabolous insect, T. molitor larvae converted to pupae, and the following formula was used to calculate the percentage of larvae that reached the pupal stage:
 \begin{equation*}{\text{\% Pupation}} = \frac{{Number\,of\,\,pupa\,formed}}{{Total\,Initial\,Number\,of\,larvae\,}} \times 100\end{equation*}
Qualitative and quantitative analyses of LDPE biodegradation
To observe the impact of plastic consumption by larval T. molitor, weight reduction in larvae and the patterns of eating by the larvae on the provided LDPE sheets in terms of gravimetric, microscopical, ultramicroscopic, and chemical changes were analysed. To investigate the chemical transformation of ingested polyethylene, the egested frass from Groups T2 and T3 of larvae was examined and compared with the egested frass of Group T1 to determine whether chemical transformation is due solely to plastic degradation or to diet degradation. Group T4 was not considered because frass was not observed in larvae kept for starvation. Frass was collected at 12-hour intervals to minimise potential contamination from undigested material. The collected samples were stored in air-tight containers at −20°C until analysis. The following analyses were used to examine LDPE biodegradation qualitatively and quantitatively:
Gravimetry
At the conclusion of the 21-day experimental period, the remaining LDPE film fragments from the relevant group (Group T3, Group T2, and Group T5) were carefully collected. For accurate weight measurement, LDPE fragments were washed with 2% (v/v) sodium dodecyl sulphate solution, then with deionised water several times. They were dried for 3 hours at 40°C, and the weight loss percentage was calculated as the weight reduction index (WRI) by using the following formula (Peng et al., Reference Peng, Xu, Sun, Xiao, Sun, Shen and Zhang2023):
 \begin{align*}
\text{WRI}\,\,\text{of}&\,\,\text{LDPE} \nonumber\\ & =\,\,\frac{{initial\,weight\,of\,LDPE\, - final\,weight\,of\,LDPE}}{{initial\,weight\,of\,LDPE\,}} \times 100
\end{align*}
Microscopy and ultramicroscopy
LDPE, serving as the sole carbon source for T. molitor larvae over 21 days, underwent meticulous morphological analysis both pre- and post-experimentation. Examination was conducted using a stereomicroscope (Nikon SMZ800N) and a scanning electron microscope (SEM). Samples of the control LDPE film and to make them conductive, the film that the larvae consumed was placed on aluminium stubs and sputter-coated with a small layer of gold. An accelerating voltage of 10–15 kV was used to operate the SEM, enabling the observation of surface modifications, such as pits, rough spots, and cavities, indicative of physical degradation by the larvae (Kundungal et al., Reference Kundungal, Synshiang and Devipriya2021).
Estimation of residual LDPE in frass
The residual LDPE (extractable fraction [ER]) in the frass was extracted based on the previously established methods by Kundungal et al. (Reference Kundungal, Gangarapu and Sarangapani2019). To estimate the mass of residual polymer in the frass, 30 mg of frass sample was transferred to a clean glass vial and extracted with 2 mL Chloroform-D (purity 99.8%) by heating at a temperature between 105°C and 115°C for 30 minutes, followed by vortex mixing. The sample solvent mixtures were filtered and transferred into a clean glass vial. The residual polymer in the filtered solution was concentrated by rotary evaporation, and the resulting residue was weighed to determine the extractable fraction, a measure of residual, non-degraded, and partially degraded LDPE in the frass.
Fourier-transform infrared spectroscopy
To prepare samples for Fourier-transform infrared spectroscopy (FTIR) analysis, the collected frass was dried and pelletised with potassium bromide (KBr). The spectra were recorded in transmittance mode at room temperature over a wavenumber range of 4500–500 cm−1 to identify functional group modifications indicative of biodegradation, using a Bruker Alpha (Germany) FTIR spectrometer (Akash et al., Reference Akash, Parthasarathi, Elango and Bragadeeswaran2025).
Carbonyl and double bond index
The quantitative biodegradation of LDPE by mealworm was measured using the Carbonyl index (CI) and Double Bond index (DBI), which are based on carbonyl bond formation and degradation. The CI and DBI were calculated as the ratio of the absorption band at 1736 cm−1 as carbonyl peak, double bond (1654 cm−1), and the bending absorption band at 1466 cm−1 (CH2 scissoring peak) (Xu et al., Reference Xu, Yin and He2012).
Gas chromatography–mass spectrometry
A mass of 0.2 g of the collected frass was suspended in 10 mL of an aqueous methanol-water solution, 9:1 v/v, respectively. This mixture was kept undisturbed at room temperature for 48 hours to facilitate the extraction of soluble compounds. Following this incubation period, the mixture was centrifuged to pellet solid debris. An aliquot of the clear supernatant was carefully collected before being injected into the gas chromatography–mass spectrometry (GC-MS) system. A Thermo Scientific TRACETM 1300 Gas Chromatograph, connected to a Thermo Scientific TSQTM 8000 Evo Mass Spectrometer, was used to conduct the study. A 1 µL of sample was injected, and the oven temperature was programmed with an initial hold, followed by a temperature ramp to separate the chemical components. At 70 eV, the electron impact ionisation mode was used to acquire mass spectra. The identification of the resulting compounds was achieved by comparing their fragmentation patterns and retention times with reference spectra in the National Institute of Standards and Technology database. The overall analytical methodology was adapted from Buron-Moles et al. (Reference Buron-Moles, Vandenbossche, Gorret, Santonja-Blasco, González-Aranda, Cameleyre and Guillouet2025).
Statistical analysis
The mean ± standard deviation of the three replicates is used to present all data. Microsoft Excel was used to create the graphical presentation, and GraphPad Prism (version 8) was used for statistical analysis. Using a one-way analysis of variance and a post hoc test, the differences in survival, pupation, and mortality rates, and LDPE weight loss among the experimental groups were examined. When the p-value was less than 0.05, it was deemed statistically significant (Hussain et al., Reference Hussain, Murtaza, Lee, Mun and Yun2025).
Results
Impact of LDPE on the life cycle of larvae
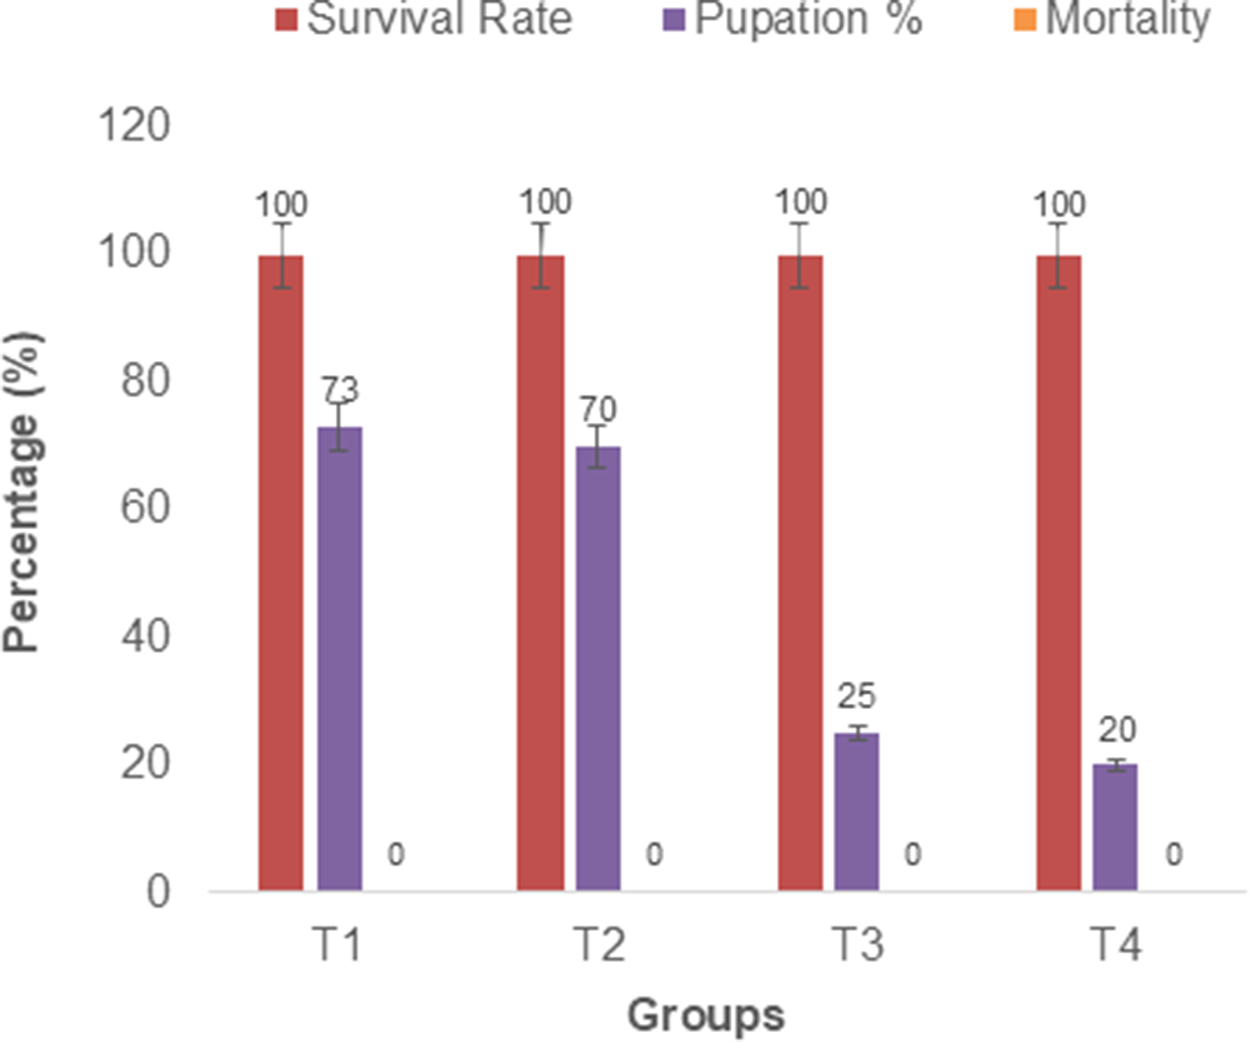
The viability and development of T. molitor larvae were monitored over a 21-day experimental period across four dietary regimens, as shown in fig. 1. All groups, including those fed LDPE (Group T3) exclusively, exhibited a 100% survival rate, indicating that LDPE is not acutely toxic to larvae. This result aligns with earlier research findings that have demonstrated the ability of T. molitor to subsist on plastic diets for extended periods (Yang et al., Reference Yang, Yang, Wu, Zhao, Song, Gao, Yang and Jiang2015; Peng et al., Reference Peng, Su, Chen, Chen, Zhou, Benbow and Zhang2019). However, the pupation rate varied significantly among the groups tested (p < 0.0001). The diet control group (T1) exhibited the highest pupation rate, at 73%, followed by the LDPE + diet group (T2), which recorded a rate of 70%. The larvae in the LDPE-only group (T3) had a pupation rate of 25%, which was not statistically different from the starvation control group (T4) at 20% (fig. 2). The statistical analysis showed that the means of all setups seemed statistically distinct with respect to the quantity of live larvae, pupa formation, and mortality, as indicated by the p along with F values (survival rate: p = 0.0100 and F = 3.663; pupa formation: p = 0.0001 and F = 183.1, and mortality: p = 0.0264 and F = 3.663). This suggests that while LDPE can be utilised as a sole carbon source to sustain life, it does not provide sufficient nutrition to support optimal growth and metamorphosis compared to a conventional diet. The ability to survive on LDPE is a critical prerequisite for its potential use in bioremediation.
Impact of dietary supplements on larvae of T. molitor. In the figure, Groups T1 (diet control), T2 (LDPE and normal diet), T3 (LDPE-fed only), and T4 (starvation control) represent the diets provided to Tenebrio molitor larvae.

Figure 2 Long description
The grouped bar graph includes a legend with three entries: Survival Rate, Pupation percent, Mortality. The x axis label is Groups. The x axis categories are T1, T2, T3, T4. The y axis label is Percentage left parenthesis percent right parenthesis. The y axis range is 0 to 120. Group T1: Survival Rate 100, Pupation percent 73, Mortality 0. Group T2: Survival Rate 100, Pupation percent 70, Mortality 0. Group T3: Survival Rate 100, Pupation percent 25, Mortality 0. Group T4: Survival Rate 100, Pupation percent 20, Mortality 0.
Quantitative and qualitative analyses of LDPE biodegradation
Gravimetry
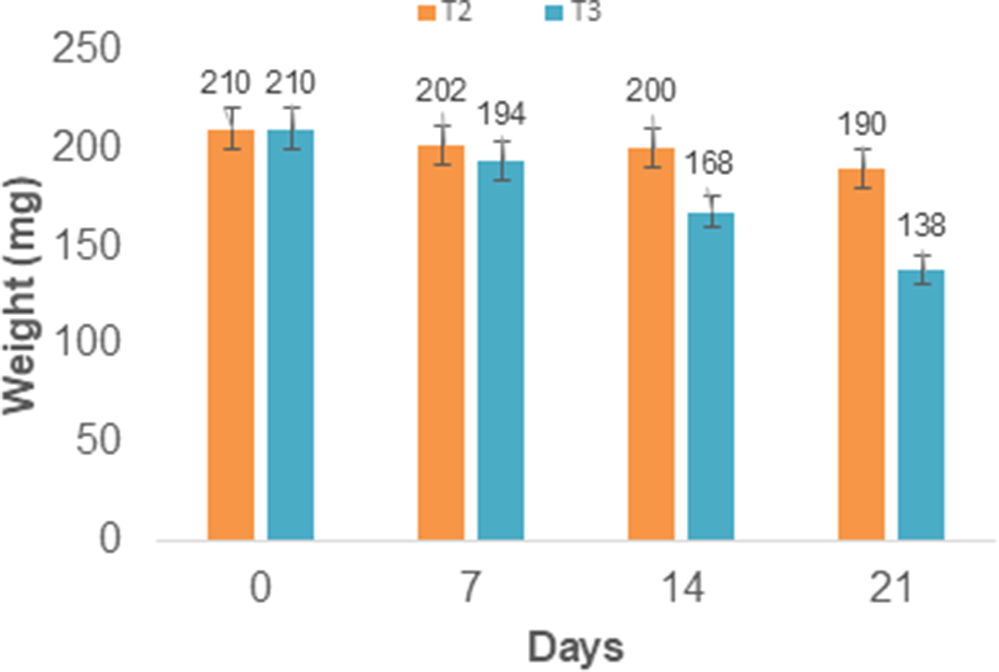
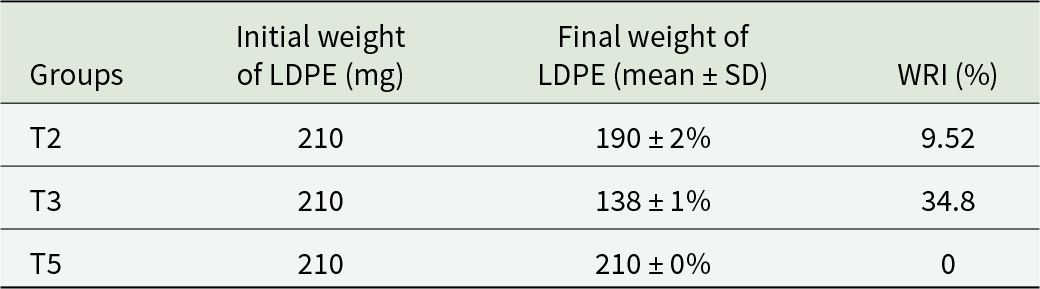
Gravimetric analysis confirmed that the larvae consumed LDPE as WRI (Table 1). The initial average weight of the LDPE samples was 210 ± 2 mg across all groups and replicates, decreasing to 138 ± 1 mg in all replicates of Group T3 (LDPE-fed only). This corresponds to an average consumption of 2.4 mg of LDPE per larva and a mean WRI of LDPE 34.28% over 21 days. While in replicates of Group T2 (LDPE + diet), the final weight of LDPE was 190 ± 2 mg, resulting in an average consumption of 0.67 mg per larva. WRI was 9.52% (fig. 3). On the other hand, replicates of Group T5 showed no weight loss of LDPE, indicating that there was no effect of abiotic factors such as mechanical abrasion, oxidation, handling losses, or experimental artefacts.
Decrease in the weight of LDPE eaten by larvae of Tenebrio molitor in Groups T2 (LDPE and normal diet) and T3 (LDPE-fed only).

Figure 3 Long description
A grouped bar graph titled T2 and T3. The horizontal axis label is Days, with tick labels 0, 7, 14, 21. The vertical axis label is Weight left parenthesis m g right parenthesis, ranging from 0 to 250. At day 0, two bars are labeled 210 and 210. At day 7, two bars are labeled 202 and 194. At day 14, two bars are labeled 200 and 168. At day 21, two bars are labeled 190 and 138.
Weight of the LDPE fed to Tenebrio molitor before and after the experiment

Table 1 Long description
The table reports LDPE mass provided to Tenebrio molitor groups and the remaining LDPE after the experiment, along with a weight reduction index in percent. All groups started with 210 mg of LDPE. T3 ended with about 138 mg on average with low variability and had the highest reduction index at 34.8 percent. T2 ended with about 190 mg on average with slightly higher variability and had a smaller reduction index at 9.52 percent. T5 ended with 210 mg with no variability and had a reduction index of 0 percent, indicating no loss. Overall, LDPE reduction was greatest in T3, moderate in T2, and absent in T5. The final weights are reported as means with standard deviation given as a percent, so variability is relative rather than in milligrams.
Microscopy and ultramicroscopy
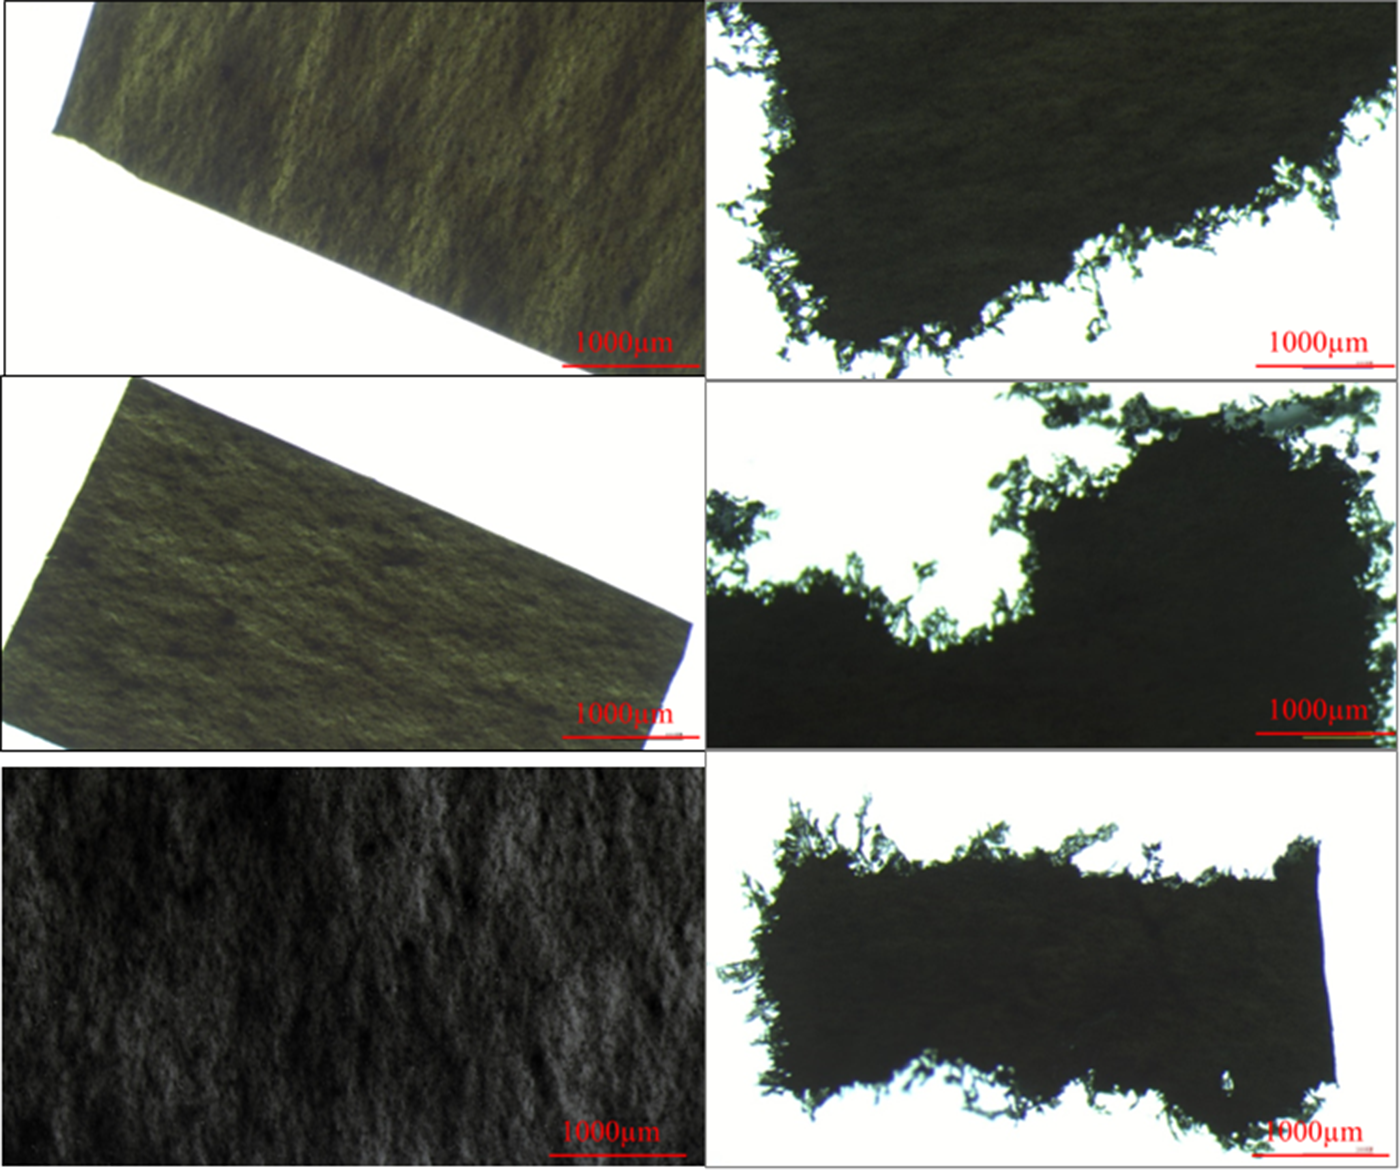
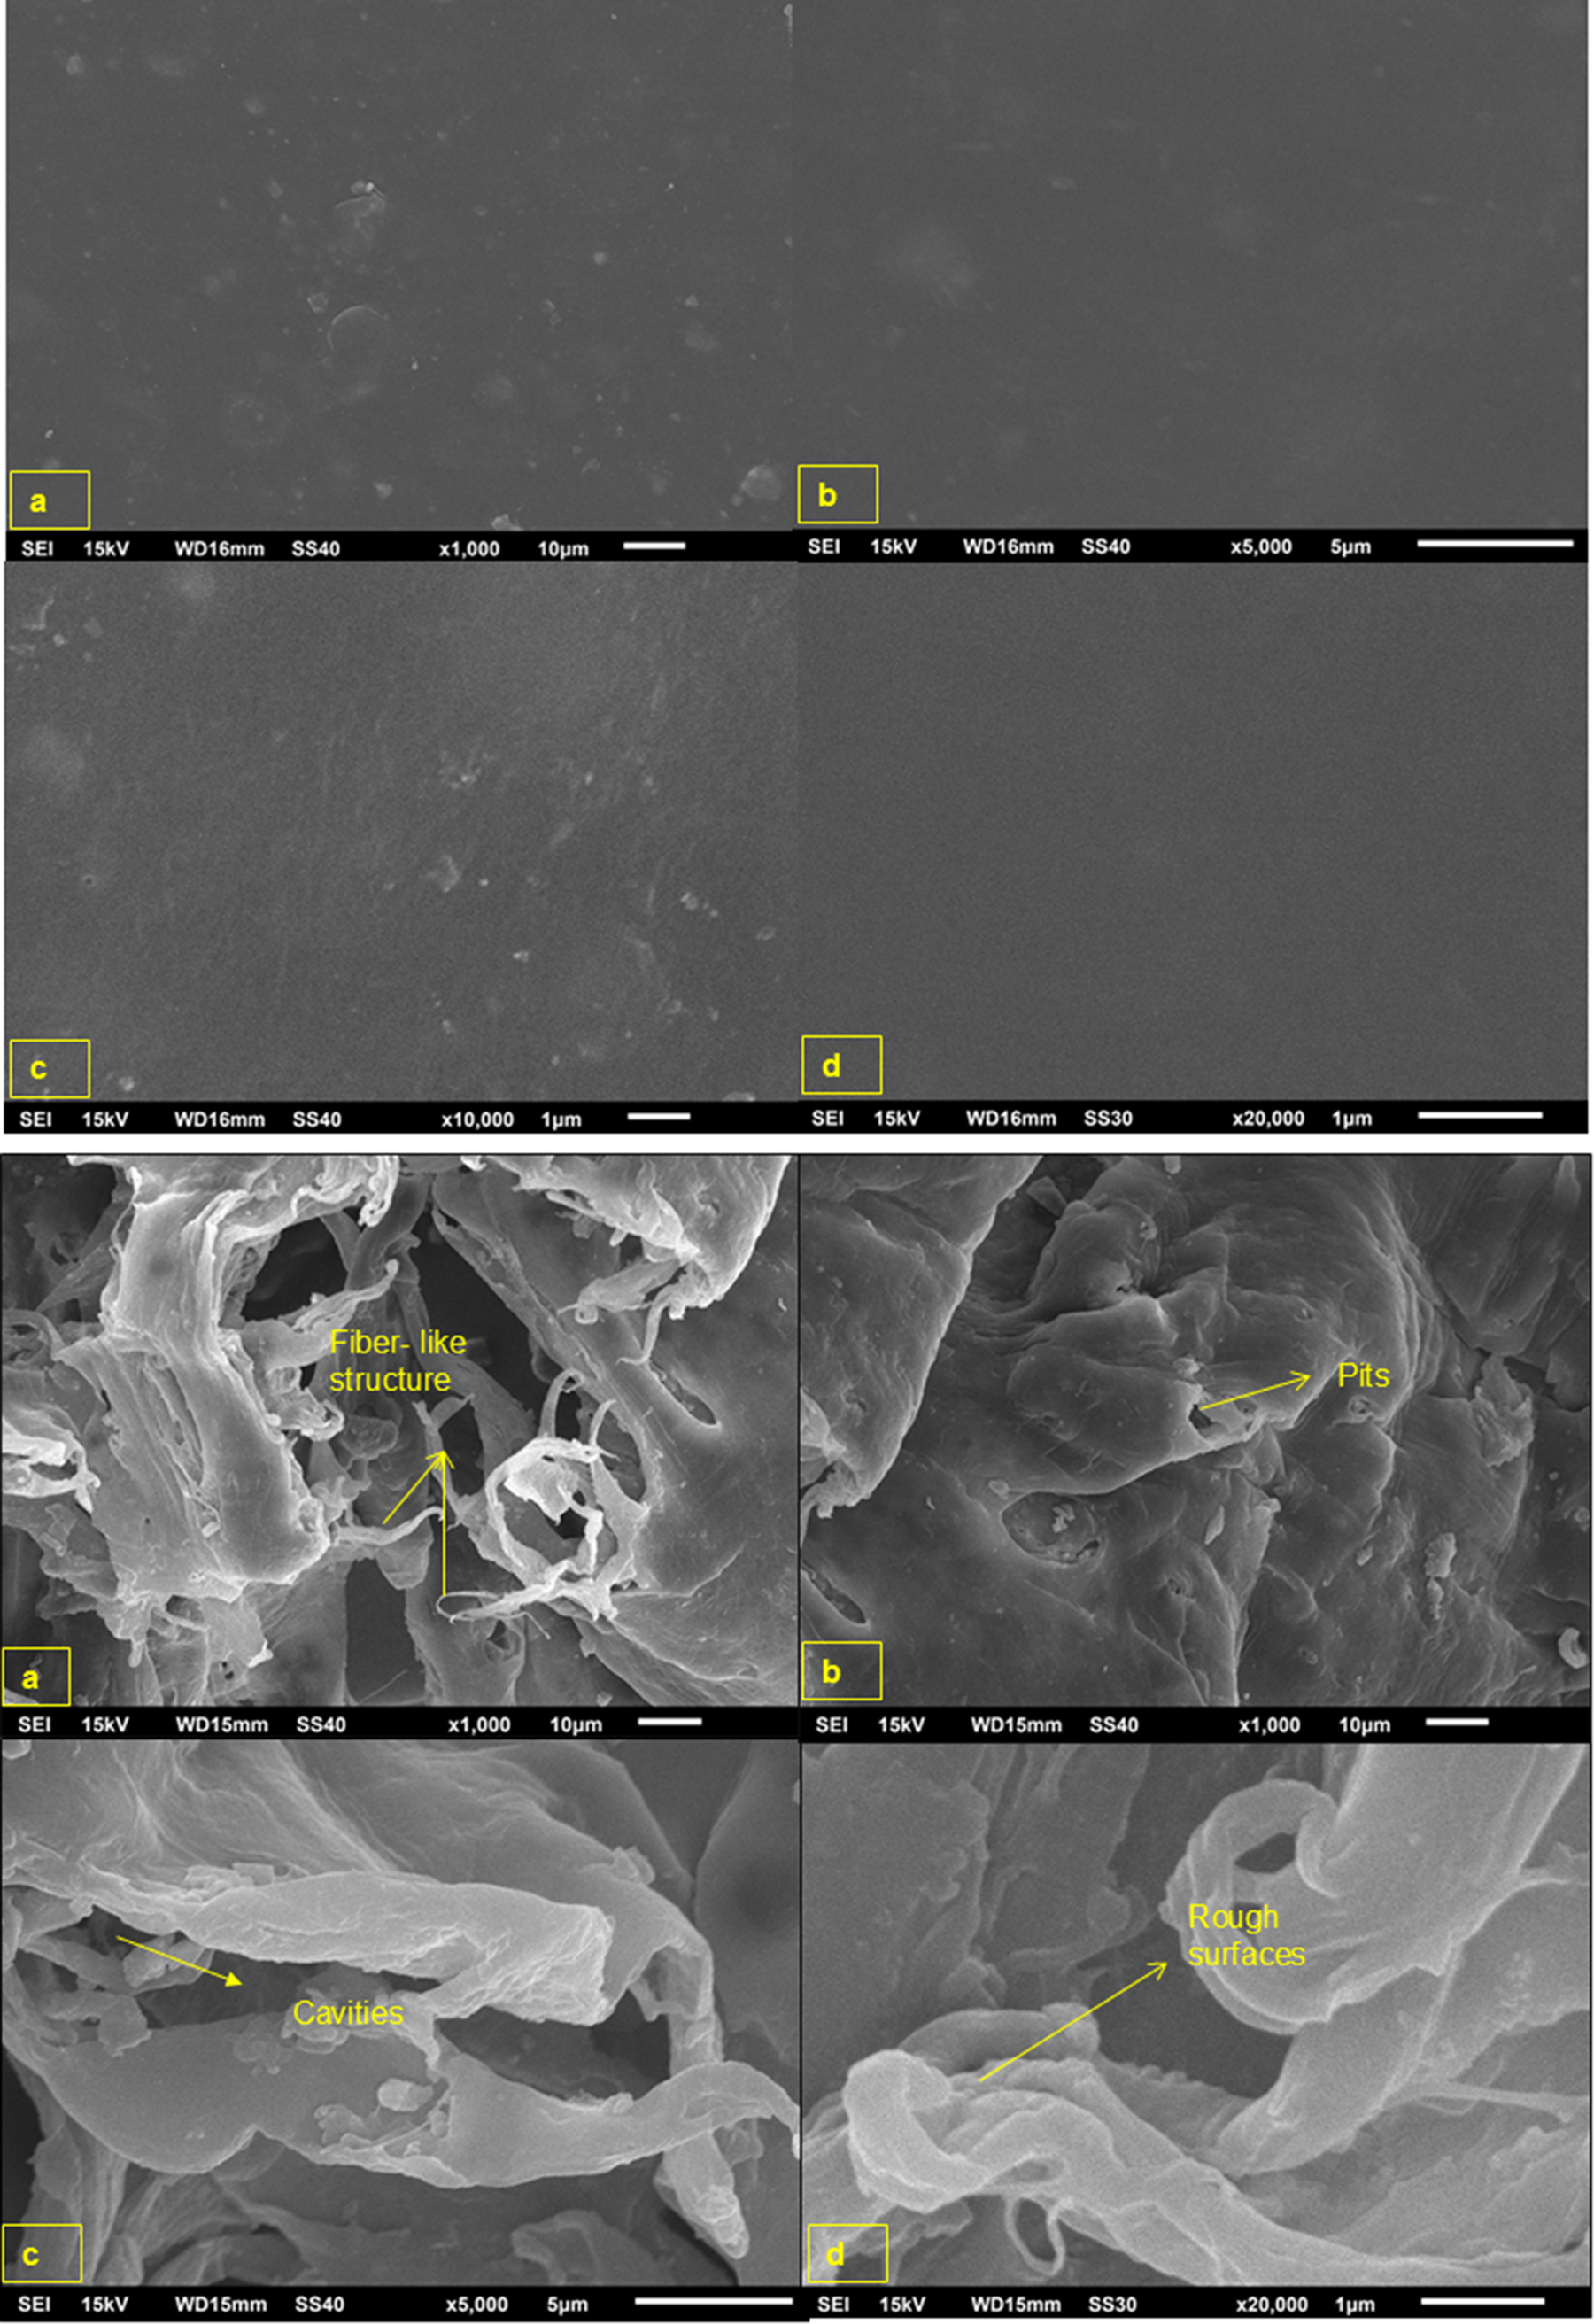
The morphological degradation of the LDPE film was characterised using stereomicroscopy and SEM. Macroscopic observation via a stereomicroscope revealed drastic morphological alterations (fig. 4). The control LDPE sheets exhibited smooth surfaces and regular edges (fig. 4i). In contrast, the sheets exposed to T. molitor larvae showed clear signs of physical deterioration, including irregular, chewed edges (fig. 4ii). SEM analysis provided further evidence at the microstructural level. The surface of the control LDPE film appeared smooth and homogenous at all magnifications (fig. 5i). In contrast, the surface of the LDPE film after larval interaction showed extensive damage (fig. 5ii). The micrographs revealed a heterogeneous topography characterised by pits, deep cavities, rough patches, and fibrous structures.
Stereomicroscopic images of LDPE showed the stages of plastic before (i) and after (ii) being provided to larvae of T. molitor.

Figure 4 Long description
The figure contains six microscopy images arranged in three rows and two columns, with scale bars of approximately 100 μm shown in red. The left column presents magnified views of a dark-colored fiber or film material. The top and middle images show elongated sections with relatively smooth surfaces and visible linear texture running along the sample. The bottom-left image provides a higher-magnification view of the surface, revealing a rough, uneven texture with fine ridges and irregular features. The right column shows edge and cross-sectional views of the same or similar material against a bright background. The top-right and middle-right images display irregular sample edges with frayed, jagged protrusions extending from the main body of the material. The bottom-right image shows a rectangular cross-section with uneven boundaries and rough margins on all sides. Together, the images illustrate the surface morphology, edge characteristics, and internal structure of the material at different magnifications, highlighting variations in texture, roughness, and structural integrity.
Scanning electron micrographs of LDPE showed the stages of plastic (i) before and (ii) after being provided to larvae of T. molitor.

Figure 5 Long description
The image A showing a grayscale scanning electron micrograph labeled a. A dark field contains scattered small bright specks and a few faint circular marks. A scale bar reads 10 micrometers. The image B showing a grayscale scanning electron micrograph labeled b. A dark field contains sparse small bright specks and faint smudged areas. A scale bar reads 5 micrometers. The image C showing a grayscale scanning electron micrograph labeled c. A darker field contains scattered small bright specks and faint streak-like marks. A scale bar reads 5 micrometers. The image D showing a grayscale scanning electron micrograph labeled d. A mostly uniform dark field contains very few small bright specks. A scale bar reads 1 micrometer. The image A showing a grayscale scanning electron micrograph labeled a. Folded, sheet-like material forms overlapping ridges and openings. Yellow arrows point to a strand-like element, with the text “fiber- like structure.” A scale bar reads 10 micrometers. The image B showing a grayscale scanning electron micrograph labeled b. A rounded, uneven surface contains multiple depressions and irregular contours. A yellow arrow points to a depression, with the text “Pits.” A scale bar reads 10 micrometers. The image C showing a grayscale scanning electron micrograph labeled c. A curved, sheet-like structure spans the frame with a narrow gap and sharp edges along one region. A yellow arrow points to the gap, with the text “Cracks.” A scale bar reads 5 micrometers. The image D showing a grayscale scanning electron micrograph labeled d. Folded, layered material forms ridges and a curled edge. A yellow arrow points to an uneven area, with the text “Rough surfaces.” A scale bar reads 1 micrometer.
Estimation of residual LDPE in frass
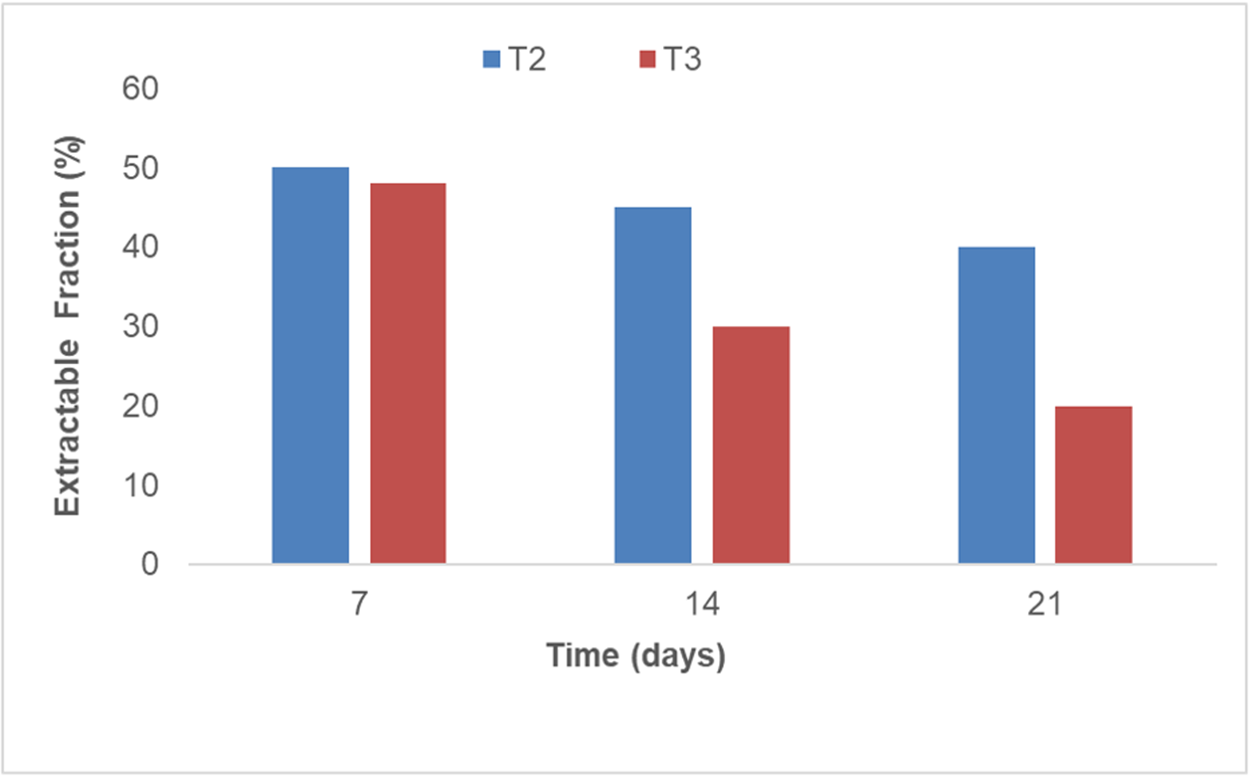
The frass of mealworms contained an ER of residual LDPE and/or modified LDPE after digestion. The residual PE was extracted from the frass of the T2 and T3 groups. The ER/residual polymer from frass of mealworms fed on LDPE + diet and LDPE only decreased over the course of the 21-day experiment. The percentage of non-degraded/partially degraded LDPE in the T3 group decreased from 42.6 ± 1.3% on day 2 to 18.4 ± 1.1% by day 21 (fig. 6). A decrease in the residual LDPE over the course of the experiment for LDPE consumed by mealworms indicated that the ingested LDPE is either degraded/mineralised or is incorporated into mealworm biomass.
Change in the extractable fraction of the excreta residue of LDPE + diet (T2) and LDPE (T3) fed mealworms.

Figure 6 Long description
The bar graph includes two series labeled T2 and T3. Horizontal axis label: Time left parenthesis days right parenthesis. Tick labels: 7, 14, 21. Vertical axis label: Extractable Fraction left parenthesis percent right parenthesis. Range: 0 to 60. At time 7: T2 equals 50, T3 equals 48. At time 14: T2 equals 45, T3 equals 30. At time 21: T2 equals 40, T3 equals 20.
Fourier-transform infrared spectroscopy
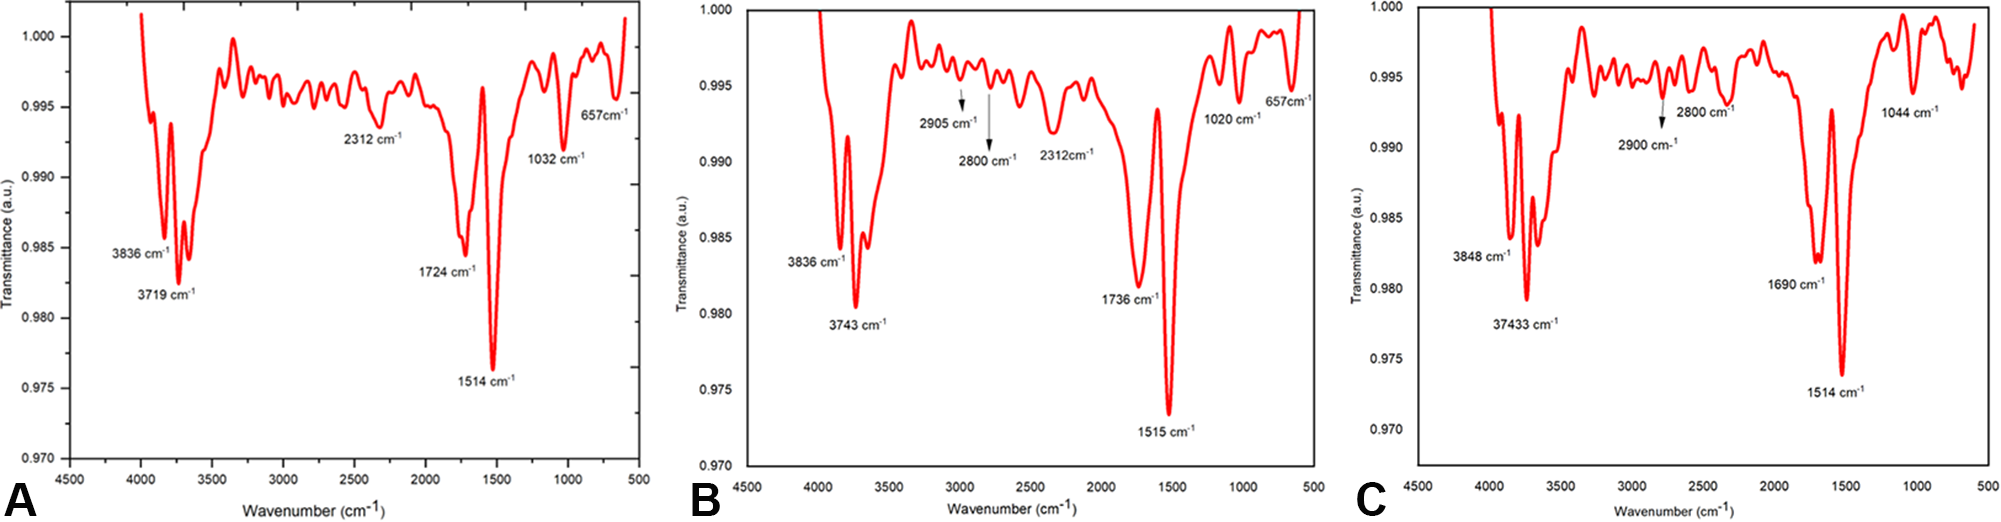
The formation of polar groups and unsaturated hydrocarbons was studied using FTIR analysis. So far, reports on LDPE biodegradation by mealworms have shown a carbonyl group peak as evidence of LDPE biodegradation after post-treatment (Bombelli et al., Reference Bombelli, Howe and Bertocchini2017; Ojha et al., Reference Ojha, Pradhan and Singh2017). The FTIR analysis helps investigate changes in the functional groups of frass from T. molitor due to chemical bond breakage, transformation, and compound formation, as well as the complete reduction of diet and LDPE films. The spectra of ER from larvae fed on LDPE showed distinct differences compared to both the control diet frass and virgin LDPE. The characteristic peaks of LDPE at 2910 and 2845 cm−1 (corresponding to C-H asymmetric and symmetric stretching) were substantially reduced in the LDPE frass samples. Significantly, new absorption peaks emerged in the frass spectra. A prominent peak appeared around 1700 cm−1, which is indicative of a carbonyl group (C=O) stretch. Additionally, a broad peak was observed around 3300 cm−1, corresponding to the hydroxyl group (–OH) of alcohols or carboxylic acids. The formation of these oxygen-containing functional groups signifies the oxidation and depolymerisation of the long polyethylene chains. This shift from a hydrophobic to a more hydrophilic surface is a key step in polymer biodegradation and is consistent with previous findings on plastic degradation by insect larvae. The frass from the diet-only (Group T1) also shows a C-O stretching band at 1032 cm−1, with medium intensity. In contrast, the NH/CO stretching bands are low in intensity (fig. 7A). The LDPE + diet (Group T2) (fig. 7C) shows C-O stretching at medium intensity with 1020 cm−1, and it also indicates the N-H stretch at 3743 cm−1. This similarity indicates that larvae preferred the diet over plastic when co-fed. Hence, there is some similarity in the chemical transformations of Groups T1 and T2 (fig. 7A and B) and dissimilarity between Groups T2 and T3 (fig. 7B and C).
FTIR analysis of the extractable fraction of T. molitor larvae fed on (A) diet, (B) LDPE and diet, and (C) LDPE only.

Figure 7 Long description
The image contains three separate panels labeled A, B and C. Each panel displays a single FTIR spectrum plotted as a line. The horizontal axis in each panel is labeled wavenumber in centimeters superscript negative 1, ranging from 500 to 4000. The vertical axis in each panel is labeled absorbance, ranging from 0.000 to 1.000. Panel A shows the spectrum for larvae fed on diet only. Labeled peaks are visible at approximately 3378 centimeters superscript negative 1, 2925 centimeters superscript negative 1, 2854 centimeters superscript negative 1, 1744 centimeters superscript negative 1, 1456 centimeters superscript negative 1, 1238 centimeters superscript negative 1 and 1032 centimeters superscript negative 1. Panel B shows the spectrum for larvae fed on LDPE and diet. Labeled peaks appear at approximately 3630 centimeters superscript negative 1, 2920 centimeters superscript negative 1, 2850 centimeters superscript negative 1, 1735 centimeters superscript negative 1, 1238 centimeters superscript negative 1 and 1020 centimeters superscript negative 1. The peaks near 2920 and 2850 centimeters superscript negative 1 appear reduced in depth compared to panel A and the peak near 1032 centimeters superscript negative 1 shifts to approximately 1020 centimeters superscript negative 1. Panel C shows the spectrum for larvae fed on LDPE only. Labeled peaks appear at approximately 3996 centimeters superscript negative 1, 2910 centimeters superscript negative 1, 1464 centimeters superscript negative 1 and 1054 centimeters superscript negative 1. The peaks near 2910 centimeters superscript negative 1 appear as prominent deep absorptions. The broad peak seen near 3378 centimeters superscript negative 1 in panel A is absent in panel C and the peak near 1744 centimeters superscript negative 1 visible in panels A and B does not appear in panel C.
CI and DBI
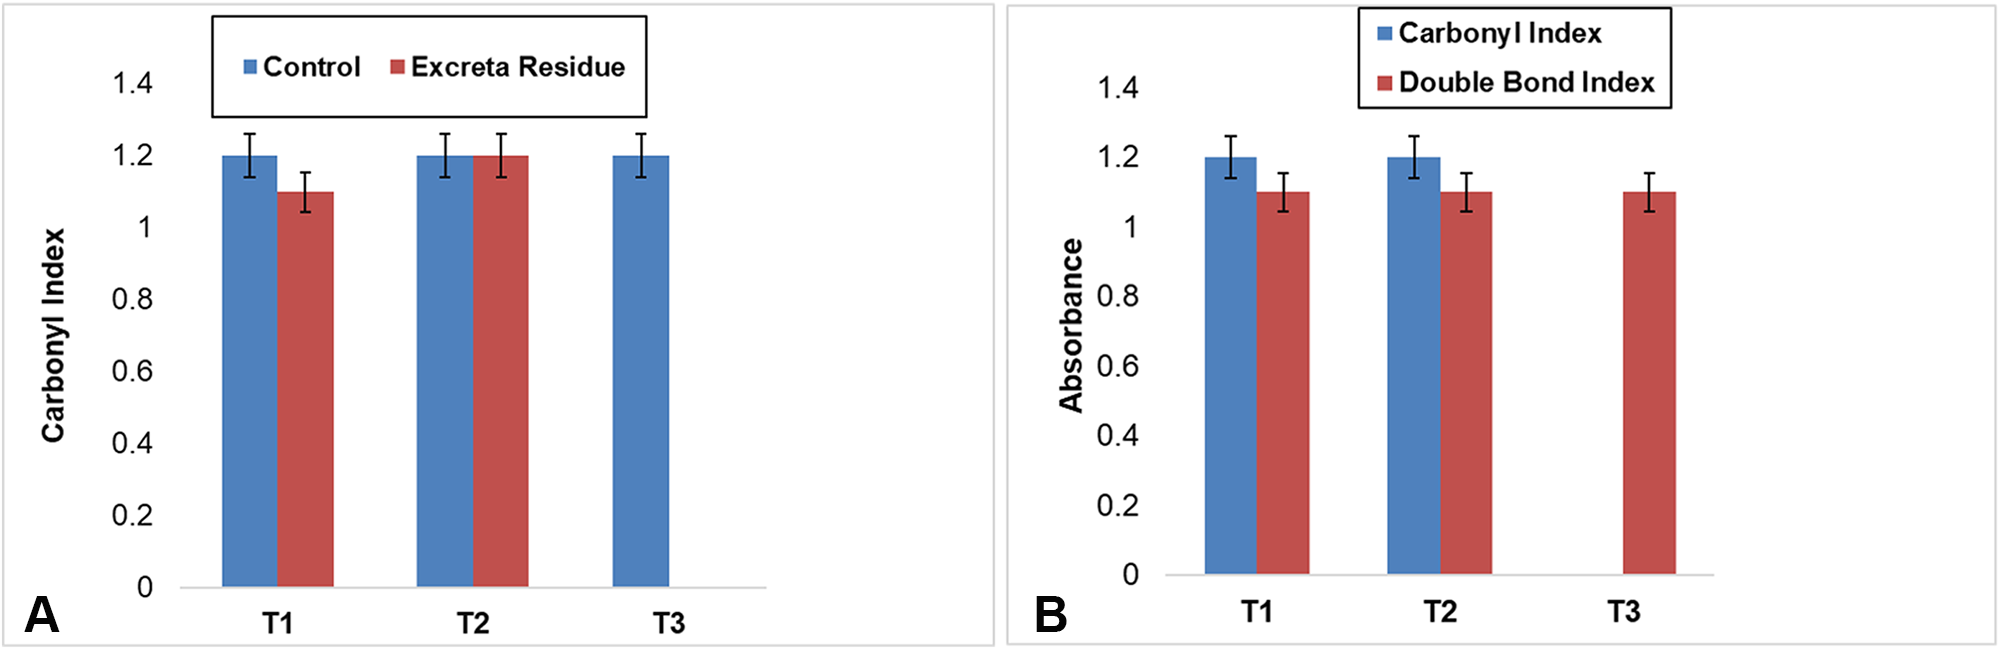
The carbonyl peak of ER from mealworms fed the diet, and LDPE + diet exhibits peaks at 1735 and 1712 cm−1. While in the case of frass of LDPE only, the keto carbonyl was completely overlapped with the new amide carbonyl peak (1662 cm−1). The formation of new broad absorption bands at 1654, 1652, and 1662 cm−1 for the ER of T1, T2, and T3, respectively, indicates the presence of a new carbonyl-containing amide group, which ensures the mineralisation of LDPE. Hence, these peaks were used to calculate the DBI. CI was calculated only for the ester group in diet (T1) and for the keto group in LDPE + diet (T2) and LDPE (T3). After biodegradation, the ester and keto CI and DBI of frass samples increase more than those of control samples (diet, LDPE + diet, and LDPE). In the case of frass from diet (fig. 8A), the increase in ester CI might be due to chain scission occurring in the gut. The IR spectrum of ER samples from diet (T1) shows a shift and decrease in band broadening, with an increase in the intensity of the peak at 1735 cm−1, as esters, and increased broadening of a new IR peak at 1654 cm−1. The broadening of the peak could be due to increased amounts of amide carbonyls. In the case of ER from T2, the keto CI also showed a similar type of result, whereas in the ER of the LDPE-fed mealworm, the keto CI was completely overlapped by raising a broad amide carbonyl peak (fig. 8A and B).
(A) Carbonyl index of wheat bran (T1), LDPE + diet (T2), and LDPE (T3); (B) comparison between keto Carbonyl index and double bond index of ER of wheat bran (T1), LDPE + diet (T2), and LDPE (T3).

Figure 8 Long description
The image A showing a grouped bar chart with the legend entries “Control” and “Excreta Residue”. The horizontal axis shows T1, T2 and T3. The vertical axis label is “Carbonyl Index” with a range from 0 to 1.4. The visible tick labels are 0, 0.2, 0.4, 0.6, 0.8, 1.0, 1.2 and 1.4. For T1, the Control bar is at 1.2 and the Excreta Residue bar is at 1.1. For T2, the Control bar is at 1.2 and the Excreta Residue bar is at 1.2. For T3, the Control bar is at 1.2. The Control bars are at 1.2 for T1, T2 and T3. The Excreta Residue bars shown are 1.1 for T1 and 1.2 for T2. The image B showing a grouped bar chart with the legend entries “Carbonyl Index” and “Double Bond Index”. The horizontal axis shows T1, T2 and T3. The vertical axis label is “Absorption” with a range from 0 to 1.4. The visible tick labels are 0, 0.2, 0.4, 0.6, 0.8, 1.0, 1.2 and 1.4. For T1, the Carbonyl Index bar is at 1.2 and the Double Bond Index bar is at 1.1. For T2, the Carbonyl Index bar is at 1.2 and the Double Bond Index bar is at 1.1. For T3, the Double Bond Index bar is at 1.1. The Carbonyl Index bars are at 1.2 for T1 and T2. The Double Bond Index bars are at 1.1 for T1, T2 and T3.
GC-MS analysis
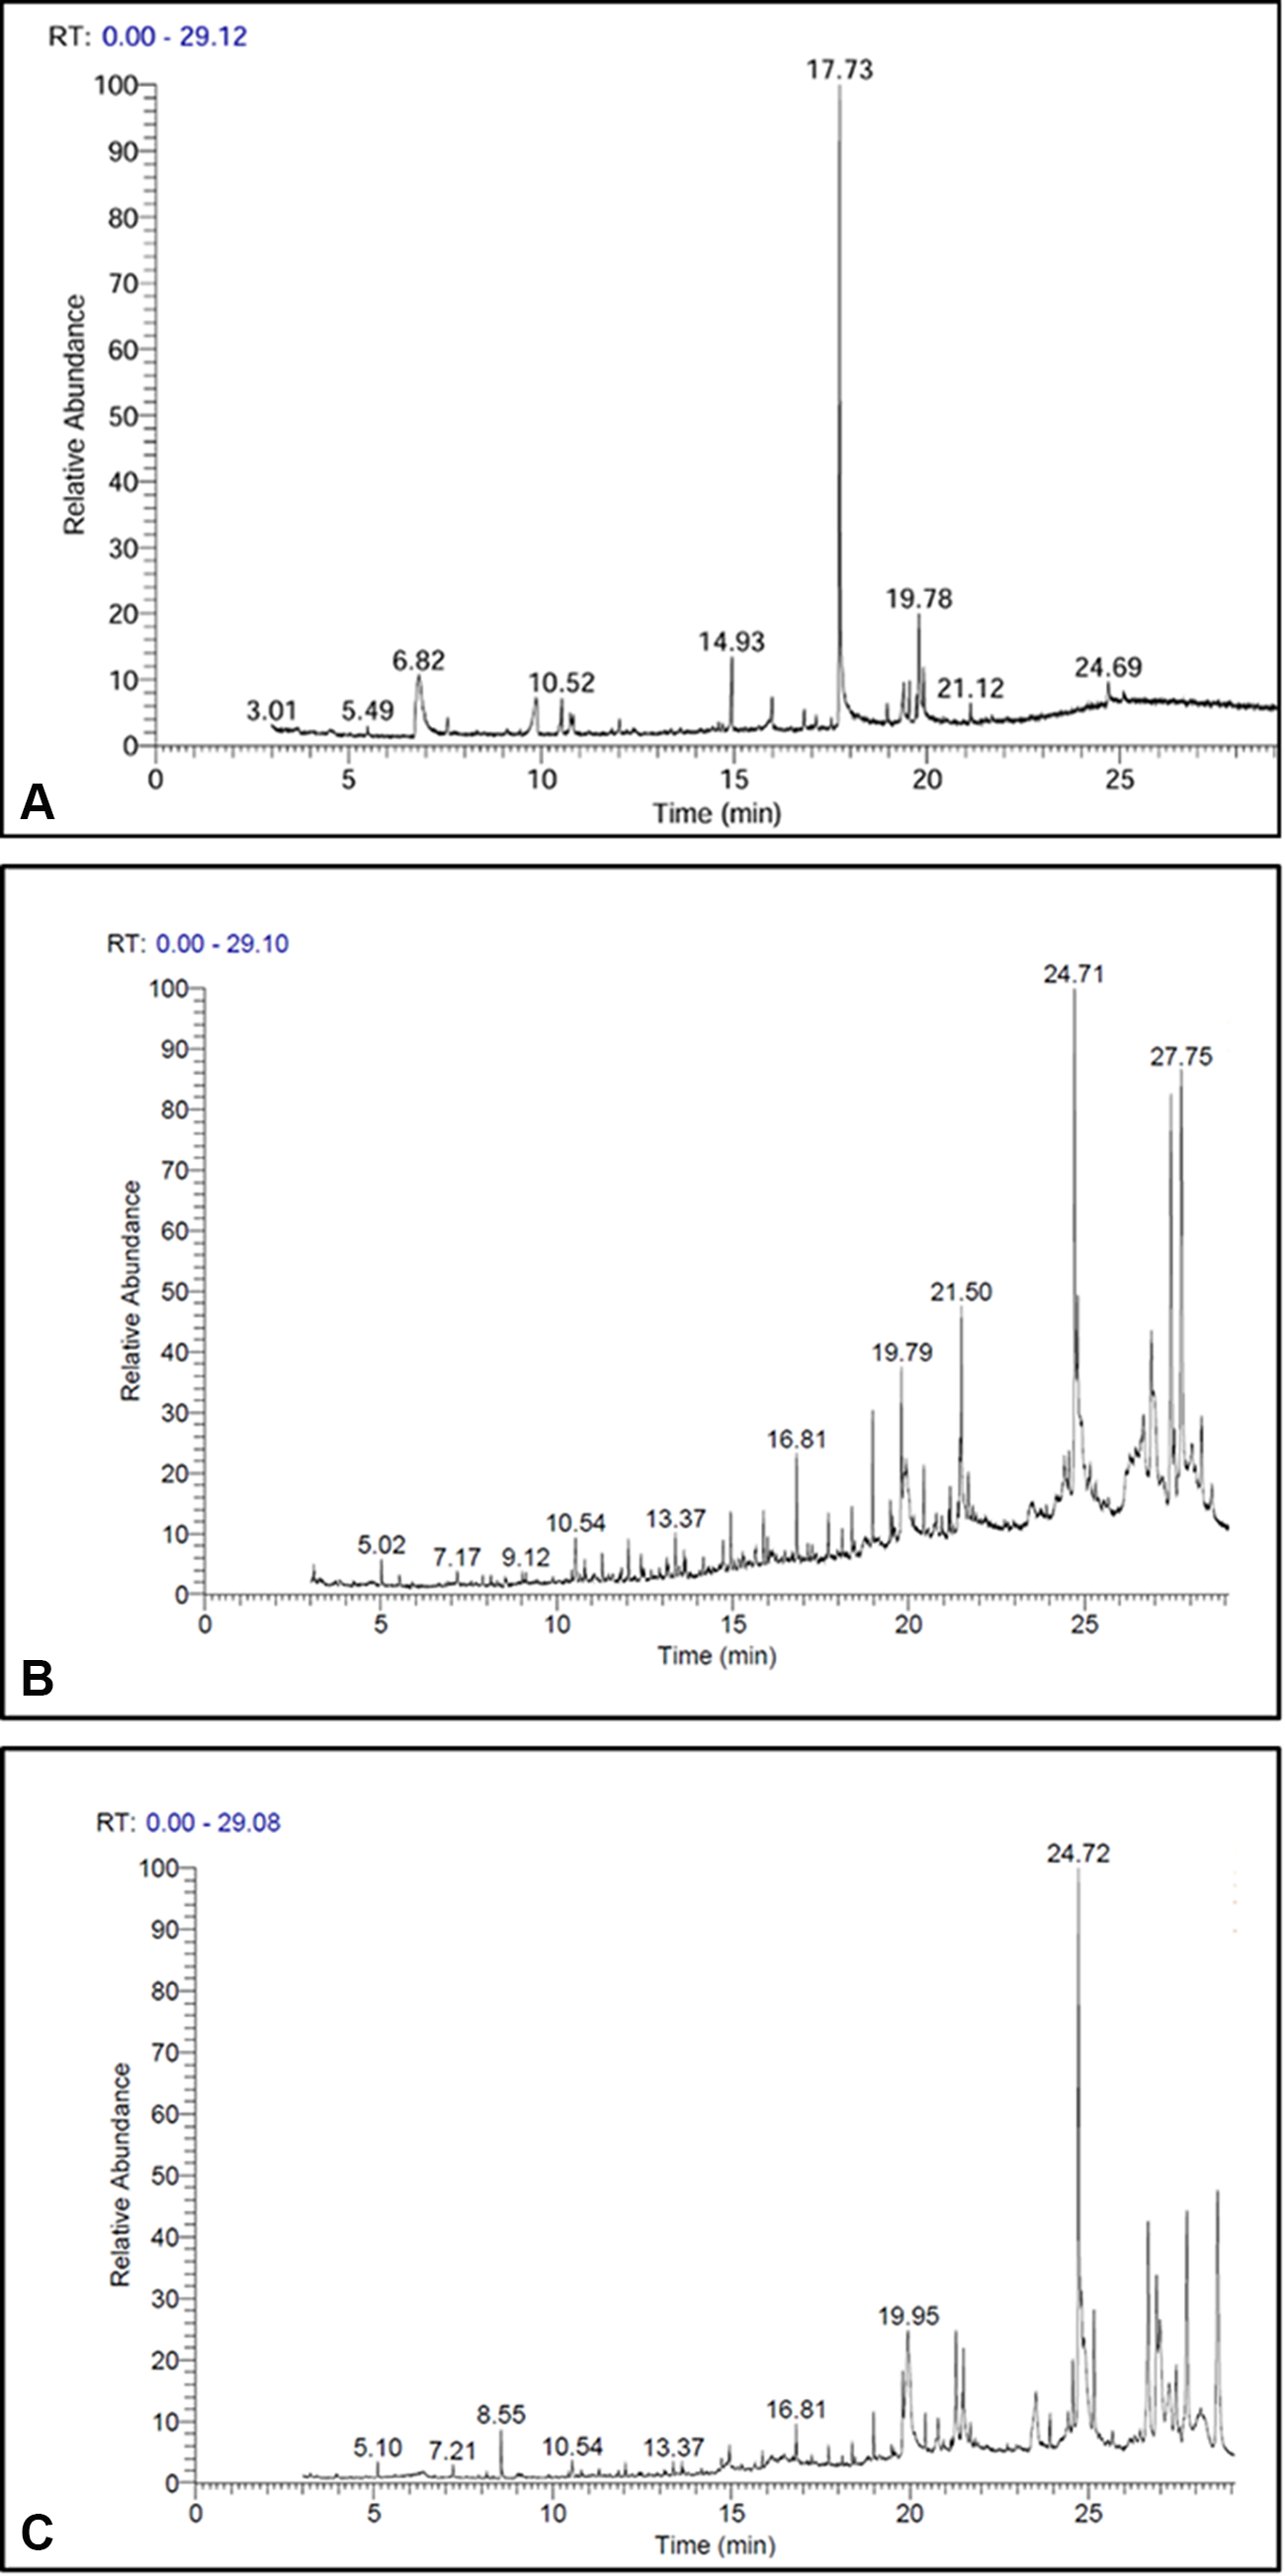
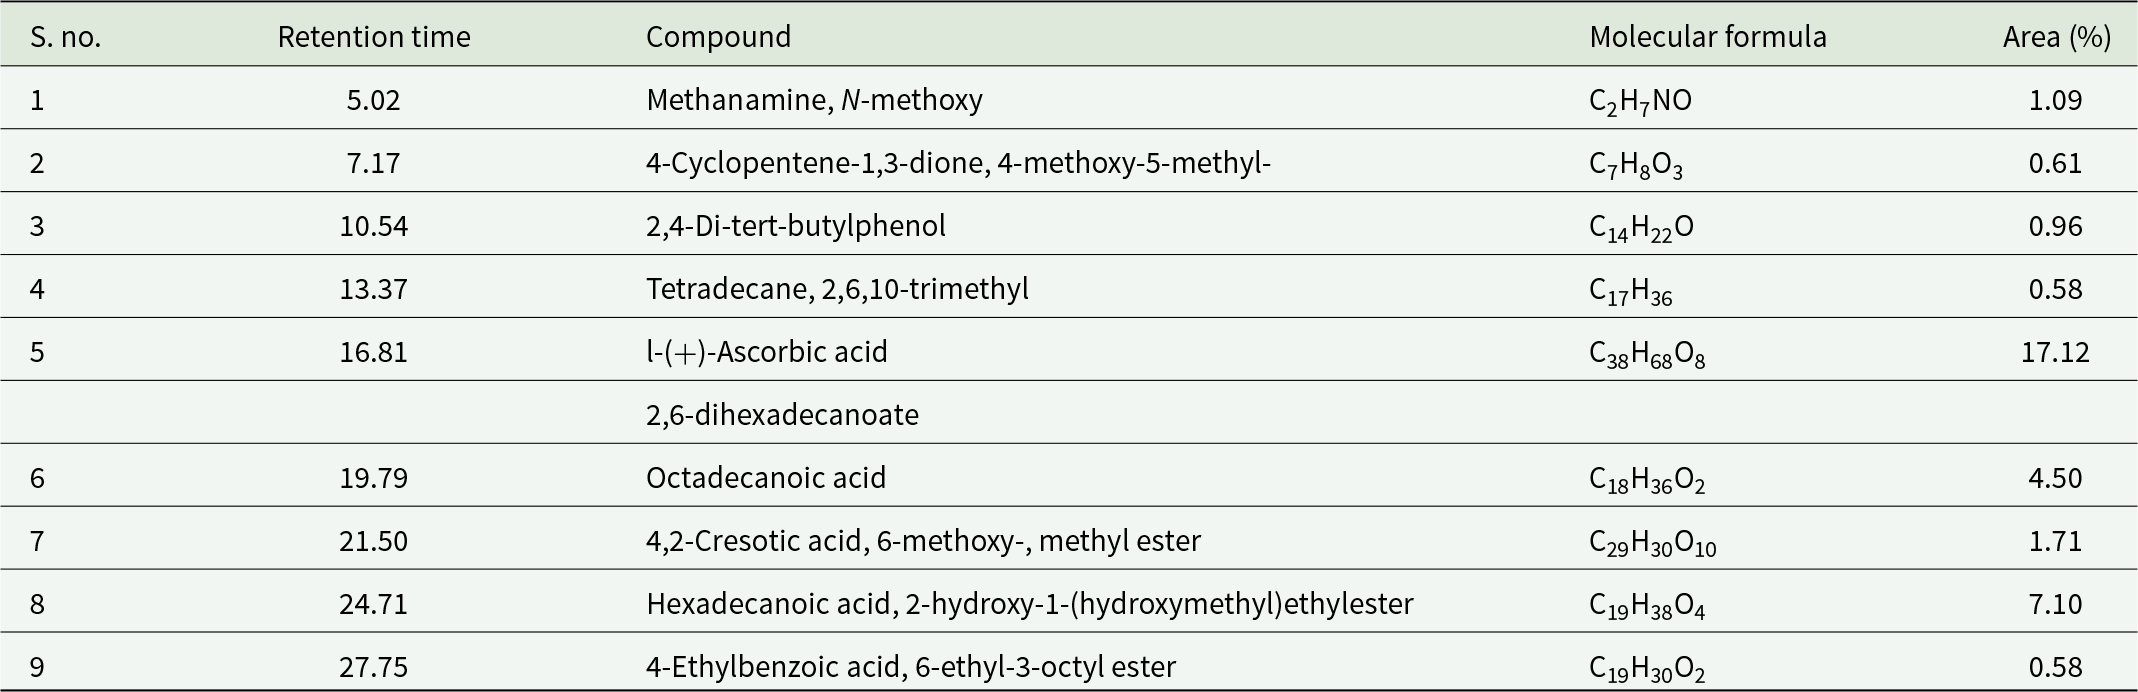
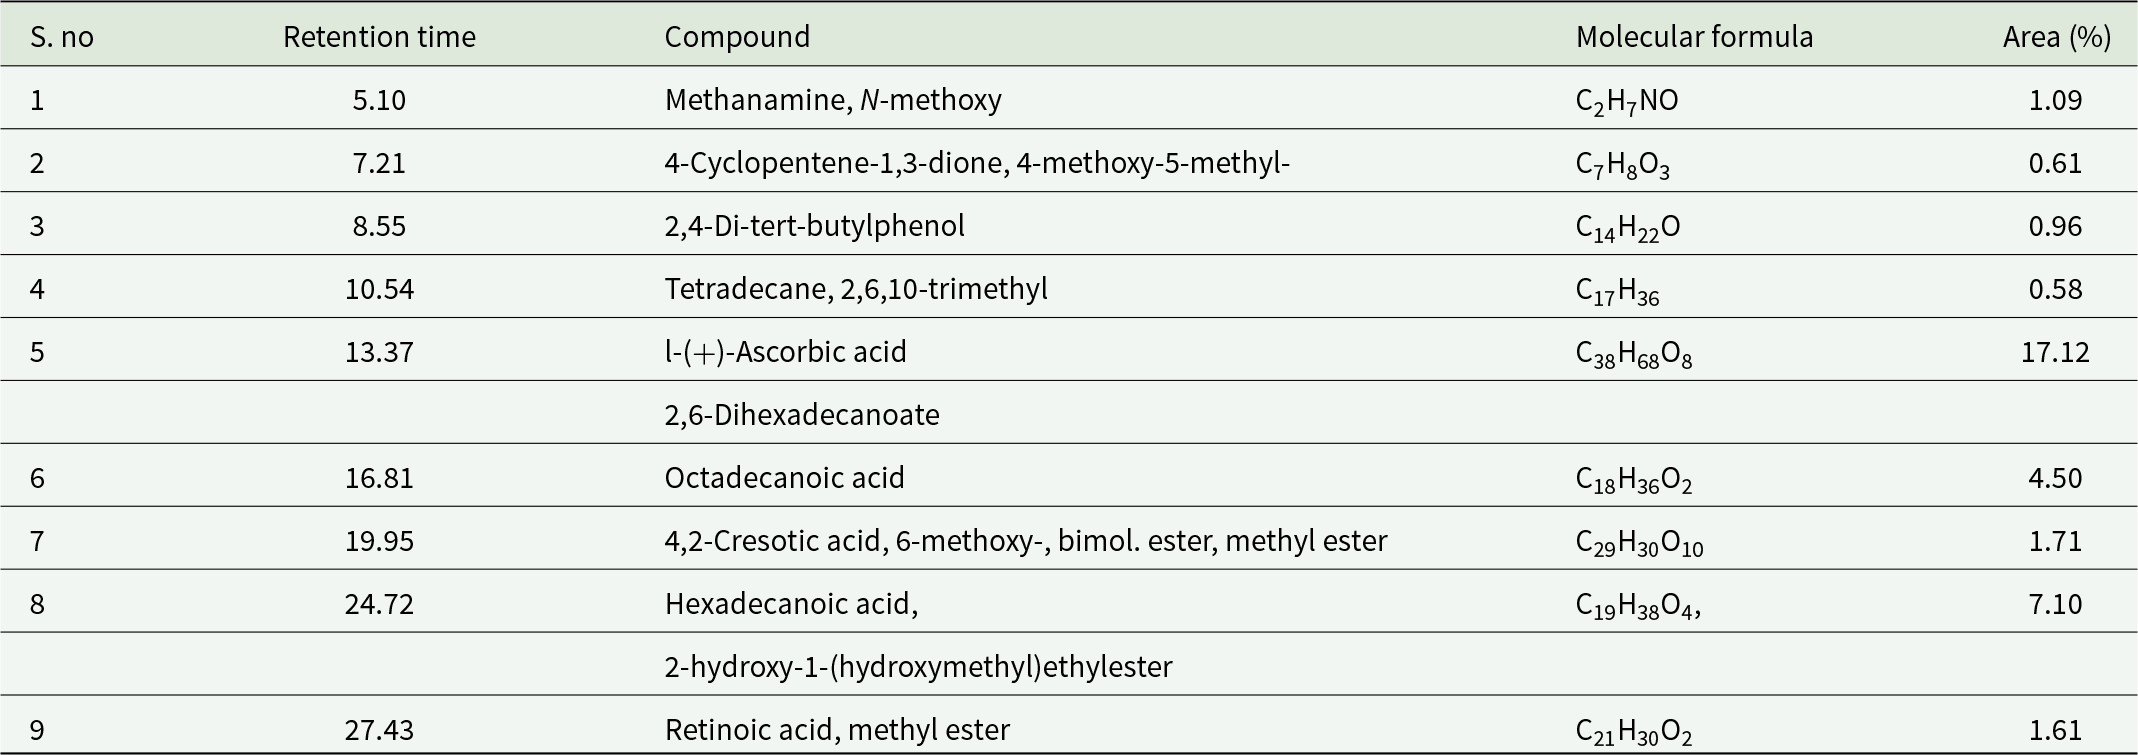
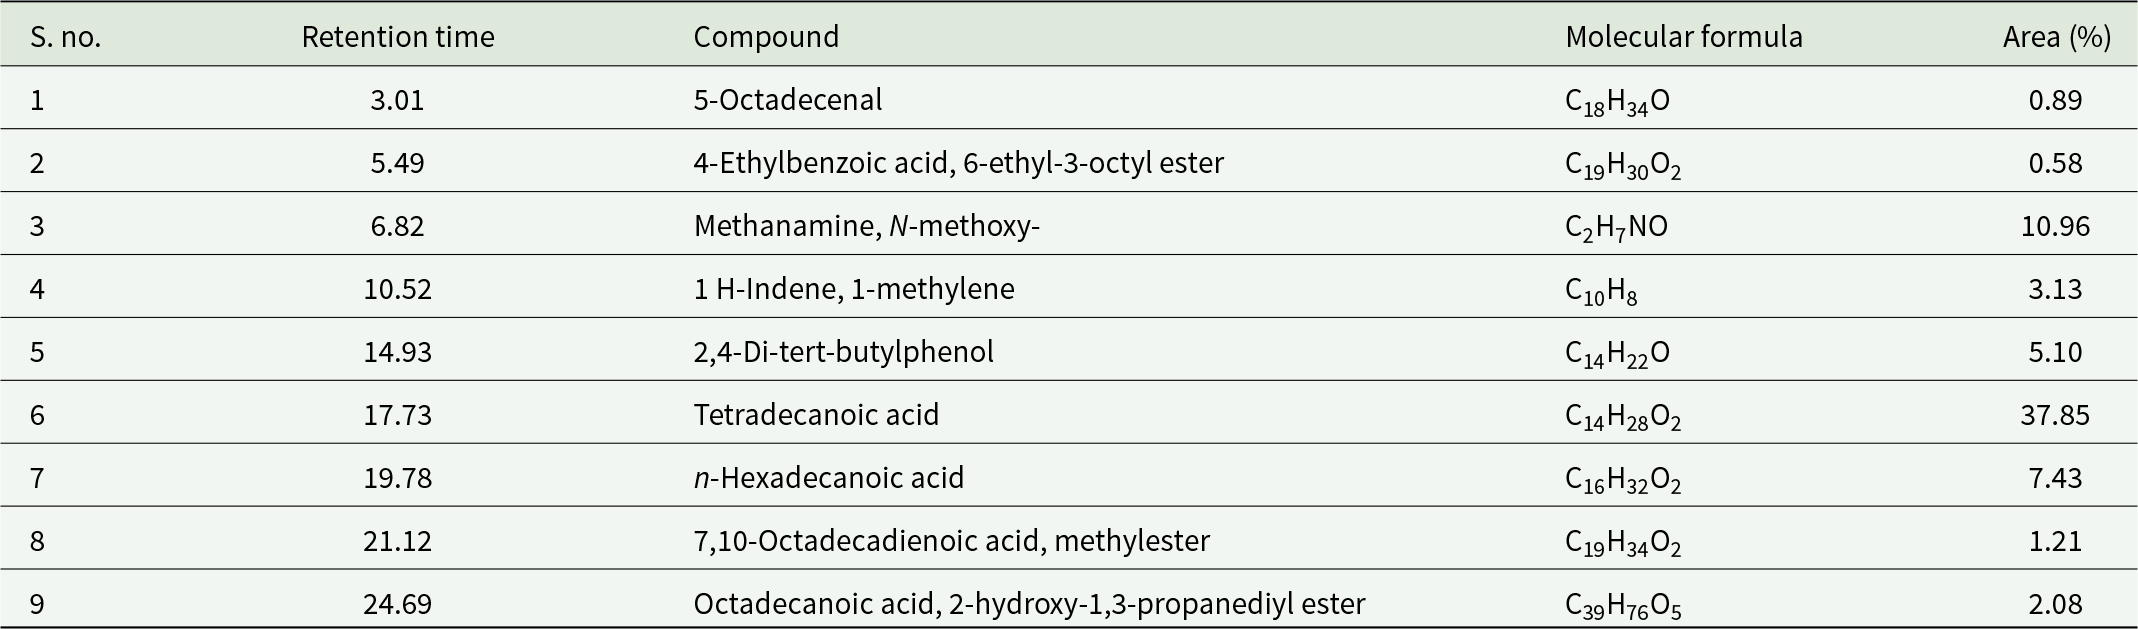
The GC-MS analysis was conducted to identify potential breakdown products resulting from the biodegradation of LDPE in all treated groups (Table 2; Table 3), and the results were compared with the egested frass of Group T1 (Table 2) to determine whether the by-products were solely due to plastic degradation or to diet degradation. No significant amount of frass was produced by starved larvae (T4) and hence not included. The most abundant compounds identified, exclusively in the treated LDPE samples (fig. 9C), included Tetradecane, 2,6,10-trimethyl; 1-(+)-Ascorbic acid 2,6-dihexadecanoate; Octadecanoic acid; 4,2-Cresotic acid, 6-methoxy, methyl ester; and 2-hydroxy-1-(hydroxymethyl) ethyl ester, Hexadecanoic acid, possessing carbon skeletons ranging from eight to sixty carbon atoms. GC-MS data for the diet-fed frass (fig. 9A) revealed compounds such as 5-Octadecenal. For the LDPE + diet treatment group (fig. 9B), compounds identified included Methenamine, N-methoxy-; 1H-Indene, 1-methylene-; 2,4-Di-tert-butylphenol; Tetradecanoic acid; n-Hexadecanoic acid and 4-Ethylbenzoic acid, 6-ethyl-3-octyl ester (similar to diet biodegradation by-products), as well as Octadecanoic acid; 4,2-Cresotic acid, 6-methoxy-, methyl ester; and Hexadecanoic acid, 2-hydroxy-1-(hydroxymethyl) ethyl ester (similar to LDPE biodegradation by-products). The Group T2 showed most of the same compounds as Group T1, indicating that larvae preferred the diet over plastic and hence formed diet by-products more than LDPE by-products. GC-MS results of biodegradation of LDPE through mealworm are also apparent in FTIR analysis, evidencing LDPE degradation and mineralisation by T. molitor.
GC-MS analysis of the extractable fraction of T. molitor larvae fed on (A) diet, (B) LDPE and diet, and (C) LDPE.

Figure 9 Long description
The image A showing RT: 0.00 - 29.12. A line plot with the y-axis labeled Relative Abundance and the x-axis labeled Time (min). The x-axis runs from 0 to 25 in increments of 5. The y-axis runs from 0 to 100 in increments of 10. Labeled peak times: 3.01, 5.49, 8.02, 10.52, 14.93, 17.73, 19.78, 21.12, 24.69. The tallest peak is at 17.73, reaching about 100. Smaller peaks appear near 19.78, 21.12 and 24.69. The image B showing RT: 0.00 - 29.10. A line plot with the y-axis labeled Relative Abundance and the x-axis labeled Time (min). The x-axis runs from 0 to 25 in increments of 5. The y-axis runs from 0 to 100 in increments of 10. Labeled peak times: 5.02, 7.17, 9.12, 10.54, 13.37, 16.81, 19.79, 21.50, 24.71, 27.76. Peaks increase in height after about 16.81. A tall peak at 24.71 rises to near 100 and another tall peak at 27.76 rises to near 100. The image C showing RT: 0.00 - 29.08. A line plot with the y-axis labeled Relative Abundance and the x-axis labeled Time (min). The x-axis runs from 0 to 25 in increments of 5. The y-axis runs from 0 to 100 in increments of 10. Labeled peak times: 5.10, 7.21, 8.55, 10.54, 13.37, 16.81, 19.95, 24.72. A tall peak at 24.72 rises to near 100. Smaller peaks appear around 19.95 and in the late time region after about 20.
List of relevant compounds produced by Tenebrio molitor larvae fed LDPE with the normal diet during GC-MS analysis

Table 2 Long description
GC-MS results list nine compounds detected from Tenebrio molitor larvae fed LDPE with a normal diet, reporting retention time, compound name, molecular formula, and peak area percent. The largest peak area is for ascorbic acid dihexadecanoate at retention time 16.81 with 17.12 percent. Next highest are hexadecanoic acid hydroxy hydroxymethyl ethyl ester at 24.71 with 7.10 percent and octadecanoic acid at 19.79 with 4.50 percent. Several minor components fall near one percent or below, including methanamine N-methoxy at 5.02 with 1.09 percent, 2,4-di-tert-butylphenol at 10.54 with 0.96 percent, and 4-cyclopentene-1,3-dione methoxy methyl at 7.17 with 0.61 percent. The smallest reported areas are 0.58 percent for tetradecane trimethyl at 13.37 and for 4-ethylbenzoic acid ethyl octyl ester at 27.75. Overall, the profile is dominated by one high-area compound with a few mid-level fatty-acid-related peaks and multiple low-abundance compounds. Peak area percent reflects relative signal in this run and does not by itself confirm absolute concentration or biological origin.
List of relevant compounds produced by Tenebrio molitor larvae fed with only LDPE as the only carbon source during GC-MS analysis

Table 3 Long description
The table lists nine GC-MS detected compounds from Tenebrio molitor larvae fed LDPE, reporting retention time and relative peak area percent. The largest peak is ascorbic acid dihexadecanoate at retention time 13.37 with 17.12 percent area. The next highest is a hexadecanoic acid derivative at 24.72 with 7.10 percent, followed by octadecanoic acid at 16.81 with 4.50 percent. Several minor components fall between about 0.58 and 1.71 percent, including methanamine N-methoxy, 2,4-di-tert-butylphenol, a trimethyl tetradecane, a cresotic acid ester, and retinoic acid methyl ester. Retention times span from 5.10 to 27.43, with higher-area fatty-acid-related compounds appearing at mid to later retention times. Area percent values are relative within this run and do not by themselves indicate absolute concentration or biological activity.
List of relevant compounds produced by Tenebrio molitor larvae fed with a normal diet during GC-MS analysis

Table 4 Long description
The table lists nine compounds identified by GC-MS from Tenebrio molitor larvae on a normal diet, reporting retention time and relative peak area percent. Tetradecanoic acid is the most abundant compound at 37.85 percent area with a retention time of 17.73. The next highest is methanamine, N-methoxy at 10.96 percent area at 6.82, followed by n-hexadecanoic acid at 7.43 percent at 19.78. Mid-level contributors include 2,4-di-tert-butylphenol at 5.10 percent and 1 H-Indene, 1-methylene at 3.13 percent. The remaining compounds are each near or below about two percent area, including octadecanoic acid, 2-hydroxy-1,3-propanediyl ester at 2.08 percent and 7,10-octadecadienoic acid, methylester at 1.21 percent. Overall, fatty acids and related lipids account for most of the signal, with one compound clearly dominating. Area percent reflects relative abundance within this run and may not represent absolute concentration across different methods or samples.
Discussion
Survival rate (SR) of T. molitor larvae fed with LDPE as the sole diet versus that fed with a normal bran diet is used as an indication to test the possibility of digestion or biodegradation of plastics (Brandon et al., Reference Brandon, Gao, Tian, Ning, Yang, Zhou and Criddle2018; Peng et al., Reference Peng, Su, Chen, Chen, Zhou, Benbow and Zhang2019), and also used for the evaluation of the effect of LDPE as a sole diet for T. molitor. In this study, all groups, including those fed LDPE exclusively (Group T3), exhibited 100% survival, indicating that LDPE is not acutely toxic to larvae. This result aligns with earlier research findings that have demonstrated the ability of T. molitor to subsist on plastic diets for extended periods (Yang et al., Reference Yang, Yang, Wu, Zhao, Song, Gao, Yang and Jiang2015; Peng et al., Reference Peng, Su, Chen, Chen, Zhou, Benbow and Zhang2019).
The observed reduction in LDPE mass as WRI for T2 (LDPE + Diet) and T3 (LDPE only) confirms its consumption by T. molitor larvae. Previous research has noted that T. molitor larvae chew and consume polyethylene, resulting in the formation of holes and a reduction in film size. Our findings regarding LDPE weight loss are consistent with published studies, which also report varying degrees of polymer degradation. For instance, Wu et al. (Reference Wu, Tao and Wong2019) observed a 24.87% reduction in LDPE weight after 30 days of feeding with T. molitor. These discrepancies in weight loss are likely influenced by factors such as polymer type and properties, plastic pretreatment methods, and experimental parameters, including study duration, temperature, and pH (Wu et al., Reference Wu, Tao and Wong2019). Furthermore, a great diversity is also present in the physiology of insects, which also alters the variations in the metabolic activities (Abbasi, Reference Abbasi2025a).
The observed morphological changes, as revealed by stereomicroscopic assessment of wrinkled and irregular edges and SEM examination of rough surfaces and microdeterioration, strongly suggest physical and potential biological degradation of LDPE by T. molitor larvae. This damage, characterised by brittle, unevenly carved structures, is consistent with the larvae’s chewing and movement behaviour. Our findings align with previous research indicating that larvae of the family Tenebrionidae can chew and consume plastics, such as LDPE (Peng et al., Reference Peng, Chen, Chen, Yu, Zhou, Criddle and Zhang2020). Furthermore, the presence of holes and pits in the surface topography, as revealed by SEM, corroborates observations from other studies on T. molitor’s biodegradation of polyethylene (Ren et al., Reference Ren, Men, Zhang, Guan, Tian, Wang, Wang, Wang and Zhang2019; Kundungal et al., Reference Kundungal, Synshiang and Devipriya2021). These microscopic features implied that the larvae facilitated the breakdown of the LDPE film, potentially through both mechanical action and microbial processes within their gut.
The FTIR analysis provides compelling evidence for the oxidative degradation of LDPE by T. molitor larvae. The substantial reduction in the intensity of characteristic LDPE peaks and the disappearance of the C–H ring peak in the frass samples indicate significant alteration of the polymer’s molecular structure. The emergence of a new peak at 1700 cm−1 (C=O stretch) is a clear signature of oxidation, demonstrating the formation of carbonyl groups within the polymer chain. This is a crucial step in the breakdown of LDPE, as it introduces polar functional groups that disrupt the non-polar polyethylene backbone. The appearance of a broad peak around 3300 cm−1, attributable to hydroxyl and carboxylic acid groups, further supports the oxidative processes. This transformation signifies a shift in the surface properties from hydrophobic to more hydrophilic (Peng et al., Reference Peng, Su, Chen, Chen, Zhou, Benbow and Zhang2019), which can facilitate further degradation. The observed presence and disappearance of these specific peaks in the FTIR spectra are consistent with previous research on the biodegradation of LDPE by T. molitor larvae (Brandon et al., Reference Brandon, Gao, Tian, Ning, Yang, Zhou and Criddle2018; Peng et al., Reference Peng, Chen, Chen, Yu, Zhou, Criddle and Zhang2020; Yang et al., Reference Yang, Gao, Liu, Zhuang, Peng, Wu and Zhuang2021), thereby reinforcing the conclusion that T. molitor larvae effectively induce chemical changes indicative of LDPE biodegradation.
The frass of mealworms fed on the diets LDPE + diet and LDPE showed that the C.I with an increase in DBI, which is due to dehydrogenation (Chiellini et al., Reference Chiellini, Corti and Swift2003). Several authors reported similar types of results for PE degradation in the biotic treatment (Mukherjee et al., Reference Mukherjee, Roy Chaudhuri and Kundu2017). The reduction in ester and keto carbonyls is probably due to the conversion of carbonyls to double bonds via Norrish type II bimolecular mechanisms. In the gut of the mealworm, the polyethylene chains break to form a vinyl group (a strong asymmetric stretch around 1220 cm−1 and a weak symmetric stretch near 890 cm−1), and an increase in DBI was observed (Manzur et al., Reference Manzur, Limón‐González and Favela‐Torres2004).
The GC-MS analysis successfully identified a diverse range of breakdown products, providing strong evidence for the degradation of LDPE by T. molitor larvae. The presence of esters, such as 1-(+)-Ascorbic acid 2,6-dihexadecanoate, Octadecanoic acid, 4,2-cresotic acid, 6-methoxy methyl ester, and 2-hydroxy-1-hydroxymethyl ethyl ester, as well as Hexadecanoic acid, in the treated LDPE samples aligns with the proposed mechanisms of PE degradation. According to these mechanisms, oxidase enzymes initiate the microbial breakdown of PE by converting the polymer into its corresponding alcohol, which is subsequently oxidised into ketones, esters, or diesters (Ghatge et al., Reference Ghatge, Yang, Ahn and Hur2020; Jin et al., Reference Jin, Arciszewski, Auclair and Jia2023). This is further supported by the identification of various alkanes, alkenes, esters, ketones, and carboxylic acids with carbon chains ranging from 2 to 54 carbons in the treated samples, as observed in other studies (Tiwari et al., Reference Tiwari, Santhiya and Sharma2023; Yun et al., Reference Yun, Lee, Kim, An, Kim, Seo, Park, Yun, Chi and Yeom2023). The detection of esters as by-products is also consistent with suggested bacterial degradation processes for LDPE (Hong et al., Reference Hong, Hang and Kim2020). Our findings resonate with earlier studies that identified methyl hexadecanoic acid and methyl 9-octadecenoate as PE metabolic intermediates (Mamoor et al., Reference Mamoor, Qamar and Farooq2011). The identification of 5-Octadecenal in the diet-fed frass also corroborates prior documentation of long-chain hydrocarbons as biodegradation by-products (Lou et al., Reference Lou, Ekaterina, Yang, Lu, Liu, Ren, Corvini and Xing2020; Tiwari et al., Reference Tiwari, Santhiya and Sharma2023). Furthermore, the presence of simpler compounds such as 6-ethyl-3-octyl ester, 4-ethylbenzoic acid, Methanamine, N-methoxy-1H-Indene, 1-methylene, 2,4-di-tert-butylphenol, Tetradecanoic acid, n-hexadecanoic acid, 7,10-octadecadienoic acid, methyl ester, and 2-hydroxy-1,3-propanediyl ester of octadecanoic acid in our samples suggests a progressive breakdown into more readily degradable units. The similarity of identified by-products in the ‘LDPE + diet’ group to those from both ‘diet’ and ‘LDPE’ treatments, including Methanamine, N-methoxy-,1H-Indene, 1-methylene, 2,4-Di-tert-butylphenol, Tetradecanoic acid, n-Hexadecanoic acid, Octadecanoic acid, 4,2-Cresotic acid, 6-methoxy-, methyl ester, Hexadecanoic acid, 2-hydroxy-1-(hydroxymethyl)ethyl ester, and Retinoic acid, methyl ester, further confirms the synergistic or concurrent degradation pathways. These results agree with investigations by Tiwari et al. (Reference Tiwari, Santhiya and Sharma2023) and Yun et al. (Reference Yun, Lee, Kim, An, Kim, Seo, Park, Yun, Chi and Yeom2023) on the formation of simpler by-products from the degradation of both dietary components and LDPE.
Conclusion
The study provides comprehensive evidence for the biodegradation of LDPE sheets by T. molitor larvae. The larvae demonstrated a 100% survival rate when fed LDPE exclusively for 21 days, resulting in a 30.34% reduction in polymer mass. Morphological analyses via SEM confirmed extensive physical degradation of the LDPE surface. Furthermore, chemical analyses using FTIR and GC-MS confirmed the polymer’s metabolic breakdown. FTIR spectroscopy revealed the oxidation of the polyethylene chains, as indicated by the formation of carbonyl and hydroxyl functional groups, leading to increased surface hydrophilicity. GC-MS analysis identified a variety of low-molecular-weight compounds, including esters and fatty acids, as metabolic intermediates. These findings collectively demonstrate that T. molitor can utilise LDPE as a carbon source, mediating its depolymerisation and mineralisation through processes occurring within its digestive system.
Author contributions
I.R. and S.S. contributed to the conception and design of the study. I.R. and S.S. performed material preparation and data collection. S.S., I.R., and P.C. performed data analysis. I.R. and S.S. wrote the first draft of the manuscript, which was subsequently modified and finalised by I.R. All the authors read and approved the final manuscript. Other statements and declarations are given on the title page.
Competing interest
The authors declare no conflicts of interest regarding this study. This includes financial interests, personal relationships, or any other affiliations that could be perceived as influencing the research outcomes or interpretations presented in this manuscript.
Availability of data and materials
All the data are provided within the manuscript. The datasets generated or analysed during this study are available from the corresponding author upon reasonable request.
Ethical compliance
Not applicable.