Introduction
Water-soluble carbohydrates (WSCs) in grasses are mainly important for ruminant nutrition and include sucrose, reducing sugars and fructans (Ding and Yang, Reference Ding and Yang2007). Fructans, polymers of fructose with some glucose units, are the predominant components of WSCs and are present in most grasses and about 15% of flowering plants (Cairns et al., Reference Cairns, Pollock, Gallagher, Harrison, Leegood, Sharkey and von Caemmerer2000). Genes involved in fructose metabolism, such as invertase genes, have been mapped using quantitative trait locus (QTL) mapping and have been found to be principally associated with linkage group 6 in Lolium perenne (Turner et al., Reference Turner, Cairns, Armstead, Ashton, Skot, Whittaker and Humphreys2006a).
WSCs are completely digestible in ruminants and are their source of readily available energy (Wilkins and Jones, Reference Wilkins and Jones2000). As well as being a source of energy, WSCs are a source of carbon for general biosynthesis (Miller et al., Reference Miller, Moorby, Davies, Humphreys, Scollan, MacRae and Theodorou2001). In addition, WSCs are a source of fermentable sugars for the growth of rumen microbes, which can then efficiently convert nitrogen sources to protein in the gut. Grasses with a high WSC content have been shown to both increase growth rates and boost milk production compared with grasses with a lower WSC content (Lee et al., Reference Lee, Merry, Davies, Moorby, Humphreys, Theodorou, MacRae and Scollan2003; Huyghe and Tabel, Reference Huyghe and Tabel2009). Consequently, increasing WSC contents in grasses is a target for perennial ryegrass, L. perenne, breeding programmes (Huyghe and Tabel, Reference Huyghe and Tabel2009). L. perenne is the principal forage used in temperate regions (Humphreys, Reference Humphreys2005), and determinations of WSC content in L. perenne have been carried out earlier in breeding populations (Jafari et al., Reference Jafari, Connolly and Walsh2003a; Fulkerson et al., Reference Fulkerson, Slack, Bryant and Wilson2003).
Crude protein (CP) and dry matter are important nutritional components in L. perenne along with WSCs. It has been shown previously that CP and dry matter contents tend to have an inverse relationship that varies seasonally (Pontes et al., Reference Pontes, Carrere, Andueza, Louault and Soussana2007). During periods of vegetative growth, the ratio of CP content to dry matter content in permanent grasslands is low, but during the flowering period, CP content increases in relation to dry matter content as the number of flowering stems increases (Pontes et al., Reference Pontes, Carrere, Andueza, Louault and Soussana2007). CP is a source of amino acids for microorganisms in the ruminant gut that participate in the digestion of WSCs, and dry matter is an important component for forage preservation. Therefore, maintaining an optimal balance between CP content and dry matter content is an important goal for grass breeders. Hence as with WSC content, it is necessary to determine CP and dry matter contents in collections of ecotypic material to gain basic information for breeding programmes.
The objectives of this study were to investigate the variation in dry matter, WSC and protein contents in Irish L. perenne ecotype accessions in comparison with commercial cultivars and to investigate the seasonal variation in these components.
Materials and methods
A total of 1320 individuals from a selection of 33 L. perenne accessions were used to determine WSC content (Table S1, available online). These 33 accessions consisted of 23 genetic resource accessions collected and held by Teagasc as part of an European Community Programme on Genetic Resources (ECGPR) collection (Connolly, Reference Connolly2000) and ten commercial cultivars. Forty individuals per accession were selected for analysis. For chemical analysis, ten individuals of an accession were pooled together. This resulted in four samples per accession per cutting time point and a total of 132 samples per cutting time point.
Seeds were grown, and plants were transferred to a field in Oak Park, Carlow, in 2003. Plants were laid out in the field as spaced plants in 2 m × 4.5 m blocks with five plants in each row and ten plants per column, 0.5 m apart. Blocks were spaced 1 m apart from each other in rows of 17 blocks. After each cutting time point, a nitrogen fertilizer at a rate of 80 kg/ha was applied to the plants.
At five time points throughout the growing season in 2004 (2nd May, 9th June, 13th July, 31st August and 26th October), four pooled samples of ten individuals each per population were collected. All the samples were collected on 1 d at the same time for each cutting time point. The samples were cutting time point at a height of 6 cm above the ground. After collection, the fresh weight of the samples was recorded, and the samples were subsequently dried for 48 h at 70°C. The dry weight of each sample was recorded. Dry matter content in percentage was calculated from fresh and dry weight measurements (percentage of dry matter in the fresh mass). Data on climatic parameters for the 2 weeks before each cutting time point were collected from the weather station at Oak Park: mean rainfall, irradiance and mean temperature (data not shown).
Dried samples were ground to pass through a 1.0 mm screen using a Retsch impeller type mill. Approximately 1 g of this material was placed overnight in a drying oven at 70°C to ensure that all moisture was removed.
WSC content was determined by a method reported by Jafari et al. (Reference Jafari, Connolly, Frolich and Walsh2003b). Ground plant material (500 mg) was extracted with distilled water (20 ml) at 90°C for 1 h. The extract was acidified (pH ≤ 2.0) with sulphuric acid (3 M) and heated at 90°C for an additional 30 min to hydrolyse the fructans. The acidified mixture was centrifuged, and about 1.5 ml of the supernatant solution were transferred to an Eppendorf centrifuge tube. The aliquot was neutralized with excess calcium carbonate, and mixed resin (50 mg, Duolite MB5113) was added to remove the dissolved salts. The mixture was centrifuged (12,000 rpm), and 0.5 ml of the supernatant was diluted with the same amount of acetonitrile and centrifuged again. After extraction, the samples were filtered through 0.45 μm filters. Fructose and glucose contents of the purified extract were determined by high-performance liquid chromatography using a two-stage pump (Waters M45, Waters Corporation, Ireland) with a refractive index detector (Shimadzu RID6-A, Shimadzu Corporation, Japan) and an amino reverse-phase column (APEX 1 Amino RP, 250 × 4.6 mm, Jones Chromatography, Glamorgan, UK) at 30°C, with degassed 80:20 v/v acetonitrile–water mobile phase at 1.5 ml/min and 10 μl injection volume. Fructose and glucose contents were quantified using 0.25 and 0.1% standards, respectively, and WSC content is expressed as the sum of fructose content (sum of free fructose, fructosyl from sucrose and fructosyl from fructans) and glucose content (sum of free glucose and glucosyl from sucrose).
Nitrogen content was estimated using a LECO 228 (Leco Corporation, St Joseph, MI, USA) nitrogen determinator by combustion at 1050°C and collection of gases, and it is expressed as a percentage. CP content was calculated as N × 6.25 (g/kg dry matter content, Jafari et al., Reference Jafari, Connolly, Frolich and Walsh2003b).
All the data analyses for basic statistics, data transformations, correlation analyses and regression analyses were carried out using the Minitab® Version 15 Statistical Software (Minitab Incorporated, 2000). All other analyses were carried out using the Statistical Analysis System (2002–2003) (version 9.1; SAS Institute, Inc., Cary, NC, USA). Arithmetic means, standard deviations and ranges of yield across the season were calculated for each trait for each population, overall, for ecotypes and for commercial varieties. Scatterplots were constructed to display the ranges at each cutting time point for each trait. The adjusted Tukey test (Tukey, Reference Tukey1953; Kramer, Reference Kramer1956) was used to test whether the means of each type (cultivar and ecotype) at each cutting time point were significantly different and to test whether the means of different types (ecotypes, cultivars, diploid cultivars and tetraploid cultivars) were significantly different from each other. Probability plots were constructed, and normality tests for each trait at each cutting time point and over all the cutting time points were carried out. Where data were not normally distributed, data transformation was performed. The following transformations were attempted: log transformation (log-transformed fructose content and log-transformed WSC content), square root transformation, reciprocal transformation and natural log transformation. For the traits that were not normally distributed after data transformation, Johnson's transformations were performed. Histograms and probability plots were constructed, and the normality of the transformed data was then analysed. Pearson's correlation coefficients were calculated for each pair of normally distributed traits and cutting time points. Spearman's rank correlations were calculated for those traits that were not normally transformed. Correlation coefficients between either fructose or glucose content and WSC content at the same cutting time point were not calculated, as the data were not independent.
Principal components analysis (PCA) was carried out at each cutting time point on the population means data using the NTSYSpc version 2.2 software (Rohlf, Reference Rohlf2005). Where a split was observed between the accessions, a canonical variates analysis was carried out on the data to determine which traits influenced the split of accessions in each dimension using the modules POOLVC and CVA.
Data for each trait (log-transformed fructose and glucose, log-transformed WSC, dry matter and CP contents) were analysed using PROC MIXED of the Statistical Analysis System (2002–2003) (version 9.1; SAS Institute Inc.) to determine the influence of the type of accession (ecotype or cultivar), cutting time point and type × cutting time point interactions on the variation in the dataset. The means of subsamples for each accession were calculated. The type of accession (ecotype or cultivar) was distributed randomly across the site. Repeated measurements of individual accessions within each type were treated as correlated observations.
An unstructured covariance model was fitted to each trait with type, cutting time point and type × cutting time point interactions as fixed effects:
 $$\begin{eqnarray} Y = \mu + C + T + C \times T + e , \end{eqnarray}$$
where Y is the trait of interest, μ is the overall mean; C is the cutting time point, T is the type (ecotype or cultivar), C× T is the cutting time point × type interaction and e is the error term.
Climatic variables (irradiance, rainfall and mean temperature) for each cutting time point were added to the model as covariates. The fit of a set of different covariance models was tested using − 2 residual log likelihood, Akaike's information criterion (Akaike, Reference Akaike1974) and Schwarz's Bayesian criterion (Schwarz, Reference Schwarz1978). The significance of the fit of the model was tested with the null model likelihood ratio test. The significance of each of the fixed effects was tested with Type 3 hypotheses. T-tests of differences of least-squares means were used to determine whether the means were significantly different from each other using the Tukey–Kramer test (Kramer, Reference Kramer1956) to adjust for multiple comparisons.
Results
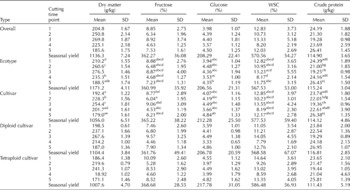
Fructose content (sum of free fructose, fructosyl from sucrose and fructosyl from fructans), glucose content (sum of free glucose and glucosyl from sucrose), WSC content, dry matter content and CP content (%) were calculated for 132 pooled samples at each of the five cutting time points. Summary statistics (mean, standard deviations and ranges of the yield) and average seasonal yields were calculated for each trait (Tables S2–S6, available online). Overall group means were calculated, and Tukey's tests were carried out to test whether group means were significantly different from each other (Table 1).
Overall and group means, standard deviations and seasonal yields for the traits: dry matter, fructose, glucose, water-soluble carbohydrate (WSC) and crude protein contents

a–jMean values with common superscript letters are not significantly different at P< 0.05.
Analysis of variance
The model given in the ‘Materials and methods’ section best fitted all the traits with a significance level of at least P< 0.01 in comparison with the null hypothesis model (Table 2). Climatic parameters did not affect the model and were therefore excluded from the analysis. Only cutting time (cut) was a significant factor for fructose content (Table 3; P< 0.0001). At cutting time point 1, 3 and 5, cultivars had high fructose contents, while at cutting time points 2 and 4, cultivars had significantly lower fructose contents.
Statistics for the fit of the mixed model for each trait and significance levels for the fit of the model

WSC, water-soluble carbohydrate; d.f.: degrees of freedom.
Significance levels for the effect of each factor in the model and the percentage variation explained by the effect of each factor

N. d.f., numerator degrees of freedom; Den d.f., denominator degrees of freedom; F, F ratio; N/S, non-significant.
Only cutting time point had a significant effect on the variation in glucose content (Table 3; P< 0.001). Glucose content increased from the early May cutting point to the mid growing season (cutting time point 3). Glucose content decreased significantly by the late growing season (cutting time point 4) and increased again by late October (cutting time point 5).
Only cutting time point had a significant effect on WSC content (Table 3; P< 0.0001). Patterns similar to those found across the growing season for fructose content were observed for WSC content, with a high WSC content being observed in cultivars at cutting time points 1, 3 and 5, a lower content at cutting time point 2, and a significantly lower content at cutting time point 4.
Cutting time point, type of accession and cutting time point × type interaction were significant factors in the model for dry matter content. All the type × cutting time point interactions were significant at P< 0.0001 (Table 3). Differences between cultivars and ecotypes at different cutting time points and between the ecotypes at different cutting time points contributed most to the significant type × cutting time point interactions. With the exception of the significant differences between cultivars at cutting time point 3 and those at cutting time points 4 and 5, differences between cultivars at different cutting time points did not contribute to the variation. Dry matter content tended to increase from cutting time point 1 to cutting time point 3 and then decreased again from cutting time point 4 to cutting time point 5.
Cutting time point and type × cutting time point interaction were significant factors in the model for CP content (Table 3). There was a significant variation between all types and cutting time points at P< 0.0001. CP content first decreased over time and then increased, in an inverse manner to dry matter content.
Principal components analysis
The first eigenvalue (Table 4) of the PCA on all data for cutting time point 1 explained 81.33% of the variation in the dataset, while the remainder of the variation was explained by the next two eigenvalues. When the eigenvectors were plotted for the first two dimensions, a split was observed between the cultivars on the right-hand side of the diagram, with the majority of the ecotypes (with the exception of IRL-OP-02 007, IRL-OP-02 011, IRL-OP-02048, IRL-OP-02 064, IRL-OP-02 068, IRL-OP-02 192, IRL-OP-02 272, IRL-OP-02 337 and IRL-OP-02 483) being found in the other quadrants (data not shown). After canonical variates analysis, the scores for each trait (data not shown) indicated that fructose and dry matter contents were the main factors influencing the split between ecotypes and cultivars. The first eigenvalue (Table 4) of the PCA on all data for cutting time point 2 explained 97.47% of the variation in the dataset and the remainder of the variation was explained by the next two eigenvalues. When the eigenvectors were plotted for the first two dimensions (data not shown), a split was observed between the tetraploid cultivars on the left-hand side of the diagram, with the majority of the ecotypes (with the exception of IRL-OP-02 337, IRL-OP-02 064, IRL-OP-02 068, IRL-OP-2272 and IRL-OP-2483) being found on the right-hand side of the diagram. Canonical variates analysis revealed that dry matter and CP contents were the main factors influencing the split between ecotypes and cultivars at the second cutting time point. The first eigenvalue (Table 4) of the PCA on all data for cutting time point 3 explained 97.98% of the variation in the dataset and the remainder of the variation was explained by the next three eigenvalues. When the eigenvectors were plotted for the first two dimensions (data not shown), a split was observed between the tetraploid cultivars on the left-hand side of the diagram, with the majority of the diploid accessions (with the exception of IRL-OP-02 064 and IRL-OP-02 480) being found on the right-hand side of the diagram. Canonical variates analysis revealed that dry matter and CP contents were the main factors influencing the split between tetraploid and diploid accessions. The first eigenvalue (Table 4) of the PCA on all data for cutting time point 4 explained 91.30% of the variation in the dataset and the remainder of the variation was explained by the next two eigenvalues. When the eigenvectors were plotted for the first two dimensions, a split was observed between the tetraploid cultivars on the bottom right-hand side of the diagram, with the rest of the accessions being found in the rest of the diagram. Canonical variates analysis indicated that dry matter content and, to a lesser extent, fructose and CP contents were the main factors influencing the split between ecotypes and cultivars. The first two eigenvalues (Table 4) of the PCA on all data for cutting time point 5 explained nearly all of the variation in the dataset, with the first eigenvalue explaining 89.09% and the second eigenvalue explaining a further 10.66% of the variation. The remainder of the variation was explained by the final eigenvalue. When the eigenvectors were plotted for the first two dimensions, no split was observed between any of the groups of accessions. Overall, there was no unifying pattern for the data in the PCA. Within the first four cutting time points, accessions with a high dry matter content had low CP contents. Cultivars (particularly tetraploids) had high dry matter contents and low CP contents at cutting time points 1, 3 and 4, and it was vice versa at cutting time point 2. Fructose and glucose contents only appeared to influence the PCA at cutting time point 1.
Eigenvalues from the principal components analysis and percentage of variation explained by each dimension for each cutting time point

Correlations between traits and cutting time points
Pearson's and Spearman's rank correlation coefficients were calculated for each pair of traits and cutting time points. At cutting time point 1, all the correlations were significant, with the single exception of the correlation of CP and dry matter contents. Fructose and glucose contents exhibited a strong positive and highly significant correlation of 0.84 (P< 0.0001). Dry matter content exhibited weak but highly significant positive correlations with fructose, glucose and WSC contents (0.29, P< 0.001; 0.19, P< 0.05; and 0.27, P< 0.001). CP content exhibited moderate negative but highly significant correlations with fructose, glucose and WSC contents ( − 0.53, − 0.31 and − 0.48; all P< 0.0001). At cutting time points 2, 3 and 4, only two correlations in each were significant, strong positive correlations between fructose and glucose contents (0.88, 0.77 and 0.76, all P< 0.0001) and moderate negative correlations between dry matter and CP contents ( − 0.49, P< 0.0001; − 0.35, P< 0.0001; and − 0.25, P< 0.001). At cutting time point 5, all the correlations were significant, with positive correlations between fructose and glucose contents (0.78, P< 0.0001) and between dry matter content and fructose, glucose and WSC contents (0.37, 0.6 and 0.47, all P< 0.0001) and negative correlations between CP content and dry matter, fructose, glucose and WSC contents ( − 0.56, P< 0.0001; − 0.35, P< 0.0001; − 0.5, P< 0.0001; and − 0.2, P< 0.05). At different cutting time points, most of the correlations were non-significant. Values recorded at cutting time point 1 at the beginning of the vegetation period and cutting time point 5 at the end of the vegetation period exhibited the most significant correlations, with positive correlations being observed between fructose, glucose, WSC and dry matter contents and negative correlations between CP content and the other traits.
Normality tests for traits at each cutting time point
To display the normal or non-normal distribution of the traits, histograms were constructed for each trait at each cutting time point, as well as over all the cutting time points (data not shown). The histograms for the majority of traits had a normal distribution. Some histograms were skewed (dry matter content, cutting time point 1; WSC content, cutting time point 2; CP content, cutting time point 4; CP content, cutting time point 5; overall fructose content and overall CP content; CP content, cutting time point 1; fructose content, cutting time point 2; fructose, glucose and WSC contents, cutting time point 3; glucose content, cutting time point 4; and fructose content, cutting time point 5). In the probability plots (constructed using the Kolmogorov–Smirnov test statistic), fructose, glucose and WSC contents (cutting time point 1); glucose, dry matter and CP contents (cutting time point 2); dry matter and CP contents (cutting time point 3); fructose, WSC and dry matter contents (cutting time point 4); glucose, WSC and dry matter contents (cutting time point 5); and glucose overall, WSC overall and dry matter content overall followed a straight line, indicating a normal distribution. The other traits deviated from a straight line in the tails of the distributions, indicating that these traits may not have been normally distributed. The indications from the histograms and probability plots were confirmed using the Kolmogorov–Smirnov test statistics (data not shown). Data from the non-normally distributed traits were log transformed. Histograms with fitted normal distributions were constructed. The histograms for CP content (cutting time point 1), glucose content (cutting time point 4), fructose content (cutting time point 5), overall fructose content and overall CP content were normally distributed. Data obtained for all the other traits were skewed to the left. Probability plots were constructed for each trait using the Kolmogorov–Smirnov test statistic. Log-transformed data for CP content (cutting time point 1), glucose content (cutting time point 4), fructose content (cutting time point 5), overall fructose content and overall CP content followed a straight line in the probability plots.
Since square root, reciprocal or natural log transformations did not transform the eight remaining traits to normality, Johnson's transformation was successfully determined for the remaining five non-normally distributed traits (dry matter content at cutting time point 1, fructose content at cutting time point 2, WSC content at cutting time point 2, CP content at cutting time point 4, and CP content at cutting time point 5).
Fructose, glucose and WSC contents
In general, cultivars had higher mean fructose contents (sum of free fructose, fructosyl from sucrose and fructosyl from fructans) than ecotypes at cutting time points 1, 2 and 4 (Table 1), but the mean fructose contents were not significantly different from each other (Table S5, available online). Cultivars had higher standard deviations than ecotypes at cutting time points 1 and 5 (Table 1). Within cultivars, tetraploids had higher mean fructose contents than diploids at cutting time points 1, 4 and 5 (Table 1), but their means were not significantly different from each other. Tetraploid cultivars had the widest range of fructose contents at cutting time points 4 and 5 (Table 1). Over the whole season, the mean seasonal yield of fructose was 72.45 g/kg (Table 1), ranging from 60.32 g/kg (in ecotype IRL-OP-02 483; Table S2, available online) to 152.47 g/kg (in ecotype IRL-OP-02 018). Ecotypes had a mean seasonal yield of fructose of 72.20 g/kg (Table 1), while the mean seasonal yield in cultivars was slightly higher at 73.04 g/kg. Within cultivars, tetraploids had higher mean seasonal yields (73.74 g/kg; Table 1) than diploids (72.35 g/kg). An individual sample with an exceptional seasonal yield of fructose was recorded from ecotype IRL-OP-02 018 (110.30 g/kg).
Within cultivars, tetraploids had higher mean glucose contents (sum of free glucose and glucosyl from sucrose) than diploids at cutting time points 1, 3 and 5 and had equal mean glucose contents at cutting time point 3 (Table 1), but again none of these differences were significant. Over the whole season, the mean seasonal yield of glucose was 41.66 g/kg (Table 1), ranging from 33.8 g/kg (in ecotype IRL-OP-02 483, Table S3, available online) to 51.4 g/kg (in cultivar Greengold; in Table S3, available online). Ecotypes had a mean seasonal yield of glucose of 41.31 g/kg (Table 1), while the mean seasonal yield in cultivars was slightly higher at 41.57 g/kg (Table 1). Within cultivars, tetraploids had a higher mean seasonal yield (43.56 g/kg; Table 1) than diploids (41.37 g/kg; Table 1). Individuals with exceptional seasonal yields of glucose were recorded from ecotype IRL-OP-02 258 (59.70 g/kg, data not shown) and cultivar Greengold (59.64 g/kg).
Cultivars had higher mean WSC contents than ecotypes at cutting time points 1, 3, 4 and 5 (Table 1); however, none of these differences were significant (Table 1). Within cultivars, tetraploids had higher mean WSC contents than diploids at cutting time points 1, 4 and 5 (Table 1), but again these differences were not significant. Tetraploid cultivars had higher standard deviations than diploid cultivars at all cutting time points, except at cutting time point 3 (Table 1). Over the whole season, the mean seasonal yield of WSC was 114.11 g/kg (Table 1), ranging from 94.16 g/kg (in ecotype IRL-OP-02 483; Table S4, available online) to 140.70 g/kg (in ecotype IRL-OP-02 018; Table S4, available online). Ecotypes had a mean seasonal yield of WSC of 113.51 g/kg (Table 1), while the mean seasonal yield in cultivars was higher at 115.51 g/kg (Table 1). Within cultivars, tetraploids had a higher mean seasonal yield (117.30 g/kg; Table 1) than diploids (113.72 g/kg; Table 1). Individuals with exceptional seasonal yields of WSC were recorded from ecotypes IRL-OP-02 018 (163.62 g/kg, data not shown) and IRL-OP-02 258 (150.45 g/kg).
Dry matter content
Cultivars had lower mean dry matter contents than ecotypes at each cutting time point (Table 1), and these differences were significant at each cutting time point, except at cutting time point 5 (Table 1). Cultivars had higher standard deviations than ecotypes at cutting time points 2, 3 and 4 (Table 1). Within cultivars, tetraploids had lower mean dry matter contents than diploids at each cutting time point (Table 1), and these differences were significant at cutting time points 3 and 4 (Table 1). Over the whole season, the mean seasonal yield of dry matter was 227.3 g/kg (Table 1), ranging from 187.8 g/kg (in cultivar Sarsfield; Table S5, available online) to 250.3 g/kg (in ecotype IRL-OP-02 258). Ecotypes had a mean seasonal yield of dry matter of 234.2 g/kg (Table 1), while the mean seasonal yield in cultivars was lower at 211.2 g/kg (Table 1). Within cultivars, tetraploids had a lower mean seasonal yield (201.5 g/kg, Table 1) than diploids (220.9 g/kg).
Crude protein content
Cultivars had lower mean CP contents than ecotypes at cutting time points 1, 4 and 5 (Table 1), but none of these differences were significant (Table S7, available online). Within cultivars, tetraploids had lower mean CP contents than diploids at each cutting time point, except at cutting time point 3 (Table 1), but none of these differences were significant (Table S7, available online). Tetraploid cultivars had higher standard deviations than diploid cultivars at all cutting time points (Table 1). Over the whole season, the mean seasonal yield of CP was 22.98 g/kg (Table 1), ranging from 21.04 g/kg (in cultivar Navan; Table S6, available online) to 24.19 g/kg (in ecotype IRL-OP-02 068). Ecotypes had a mean seasonal yield of CP of 23.05 g/kg (Table 1), while the mean seasonal yield in cultivars was lower at 22.82 g/kg (Table 1). Within cultivars, tetraploids had a lower mean seasonal yield (22.29 g/kg; Table 1) than diploids (23.36 g/kg).
Discussion
Biochemical diversity
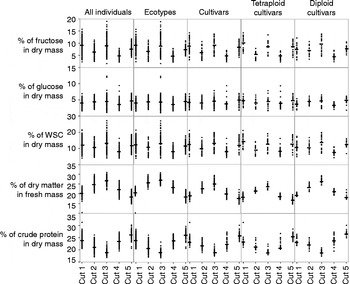
Variation within the collection of L. perenne accessions ranged widely across traits, across cutting time points and between groups of populations. Fructose contents (sum of free fructose, fructosyl from sucrose and fructosyl from fructans) and WSC contents exhibited the widest range of variation across the cutting time points (301.6–457.6 g/kg DM and 470.8–703.5 g/kg DM, respectively; Tables 2 and 3). Fructose values for ecotypes, cultivars, tetraploid cultivars and diploid cultivars varied in the same way according to the cutting time point. The values exhibited an oscillating pattern, decreasing at cutting time point 2, increasing at cutting time point 3 and decreasing at cutting time point 4 (Fig. 1). The ranges of variation in glucose, CP and dry matter contents were much lower (169.3–257.4 g/kg DM, 105.2–120.84 g/kg DM and 18.78–25.03 g, respectively; Tables 3 and 4). The mean contents of each component at each cutting time point were highly variable, with broad ranges of values being observed also at each cutting time point. The wide variability in biochemical traits within the collection is another indication of its high genetic diversity. Such a high variation in WSC, dry matter and CP contents has been recorded in other studies across cutting time points in cultivars (Gilliland et al., Reference Gilliland, Barrett, Mann, Agnew and Fearon2002; Smith et al., Reference Smith, Tamminga and Elgersma2006; Tas et al., Reference Tas, Taweel, Smit, Elgersma, Dijkstra and Tamminga2006; Yu et al., Reference Yu, Luo, Yan, Tang, Liu and Jiang2012) and across ecotypes (Skøt et al., Reference Skøt, Humphreys, Humphreys, Thorogood, Gallagher, Sanderson, Armstead and Thomas2007). A high variation was found in morphological traits and chloroplast SSR markers (McGrath et al., Reference McGrath, Hodkinson and Barth2007, Reference McGrath, Hodkinson, Charles, Zen and Barth2010), and this suggests that there is a wide potential for using the ecotypic material in breeding programmes, in general, and also for improving biochemical traits such as WSC and CP contents. While such high levels of diversity were detected in morphological traits and chloroplast SSR markers, none of the exceptional populations examined in the WSC analysis were exceptional in the other analyses. Ruminants prefer a high WSC content (Jones and Roberts, Reference Jones and Roberts1991; Smith et al., Reference Smith, Tamminga and Elgersma2006). It has been suggested that improvements in herbage quality traits have the potential to increase live weight gain by 20% (Marley et al., Reference Marley, Davies, Vale, Evans, Scollan, Moorby, MacRae and Theodorou2005) and milk production by 25% (Smith et al., Reference Smith, Reed and Foot1997). An optimal balance between sugar content and protein content is also essential to ensure efficient CP degradation and reduced urea excretion into the environment (Tas et al., Reference Tas, Taweel, Smit, Elgersma, Dijkstra and Tamminga2006). The high biochemical diversity could be due to L. perenne being an outbreeding species with high levels of genetic variation within nuclear genes responsible for such phenotypic variation. The high biochemical diversity between populations could reflect local adaptation of populations. While significant differences in the mean values of characteristics between groups of populations were observed only for dry matter content measurements (Table S5, available online), individual ecotypes exhibited higher mean seasonal yields. Ecotype IRL-OP-02 018 had a higher seasonal yield of fructose than all cultivars, and ecotype IRL-OP-02 128 had a higher mean seasonal yield than all cultivars with the exception of cultivar Portstewart. Ecotypes IRL-OP-02 173 and IRL-OP-02 018 had higher seasonal yields of glucose than all cultivars with the exception of cultivar Greengold. Again, ecotype IRL-OP-02 018 had a higher mean seasonal yield of WSC than all cultivars. So, while, in general, cultivars exhibited higher mean WSC contents than ecotypes, individual ecotypes in the collection, such as IRL-OP-02 018, IRL-OP-02 173 and IRL-OP-02 128, showed potential to be used to improve varieties in breeding programmes. Such broad ranges of WSC contents within ecotypes (as well as the superior levels of WSC in individual, locally adapted, ecotypes) could also be exploited to increase stress tolerance within new varieties. It has been shown that high-WSC genotypes maintain high plant reserves, which can be important for persistence and stress tolerance (Turner et al., Reference Turner, Donaghy, Lane and Rawnsley2006b) through membrane stabilization (Hincha et al., Reference Hincha, Zuther, Hellwege and Heyer2002; Vereyken et al., Reference Vereyken, Chupin, Islamov, Kuhlin, Hincha and Kruiff2003). Exploration and collection of Agrostis (bentgrass) from stressful environments have provided useful germplasm for the improvement of stress tolerance in this species (Casler, Reference Casler2006). So, there is a proven use of such adapted germplasm for improved variety creation. Characters such as WSC, CP and dry matter contents have already been shown to have moderate to high heritability (Jafari et al., Reference Jafari, Connolly and Walsh2003a; Turner et al., Reference Turner, Cairns, Armstead, Ashton, Skot, Whittaker and Humphreys2006a, Reference Turner, Donaghy, Lane and Rawnsleyb; Xiong et al., Reference Xiong, Fei, Brummer, Moore, Barker, Jung, Curley and Warnke2006) and so are useful for QTL analysis. QTL analysis has already revealed chromosomal linkage group locations for these traits. For example, QTLs for CP have been found on linkage groups 2 (Xiong et al., Reference Xiong, Fei, Brummer, Moore, Barker, Jung, Curley and Warnke2006), 3 and 4 (Cogan et al., Reference Cogan, Smith, Yamada, Francki, Vecchies, Jones, Spangenberg and Forster2005). QTLs for WSC have been found on linkage group 3 (Cogan et al., Reference Cogan, Smith, Yamada, Francki, Vecchies, Jones, Spangenberg and Forster2005) and a highly significant QTL (explaining 38.7% of the variation in the trait) has been found on linkage group 6 (Turner et al., Reference Turner, Cairns, Armstead, Ashton, Skot, Whittaker and Humphreys2006a). Molecular markers linked to such QTLs could then be used for marker-assisted selection (MAS), which makes targeted breeding strategies possible (Humphreys, Reference Humphreys2005) and more efficient.
Scatterplots for the traits: fructose, glucose, water-soluble carbohydrate (WSC), dry matter and crude protein contents, showing trait values (y-axis) overall for ecotypes, cultivars and tetraploid cultivars, at each cutting time point (x-axis).

Relationships between traits
Relationships between traits were determined using correlation analysis. In general, the contents of fructose and glucose exhibited strong positive correlations, which was to be expected, considering that both are the products of the hydrolysis of fructans. Significant positive correlations were observed between dry matter content and both fructose and glucose contents early in the growing season and at the end of the growing season. Early in the growing season, there are more leaves than stems; late in the growing season, all the populations would have completed flowering and so returned to vegetative growth stage with higher dry matter and sugar contents. During the flowering period, saccharides are used as an energy source to create flowering stems, which contain more CP than vegetative leaves. During most cutting time points, there were negative correlations between dry matter and CP contents. It has already been reported that increasing CP content reduces the amount of dry matter produced per unit nitrogen (Wilkins and Humphreys, Reference Wilkins and Humphreys2003). Also, CP levels decrease in late May or early June in L. perenne when much of the plant is stem (Wilkins and Humphreys, Reference Wilkins and Humphreys2003), as also indicated by this dataset. Xiong et al. (Reference Xiong, Fei, Brummer, Moore, Barker, Jung, Curley and Warnke2006) suggested that negative correlations between fibre and CP contents rely on QTLs with opposing effects, and there could be a similar relationship between gene regions causing the negative correlations. Increasing contents of either of these components could be achieved by targeting one of the gene regions, by MAS, at a time.
Relationships between accessions
In cutting points 1–4, splits in the PCA were seen for the traits fructose, glucose, dry matter content and CP between ecotypes and cultivars (cutting point one and three) or between tetraploid cultivars and the other accessions (cutting time points two and four). In general, high dry matter content was the most important trait separating the accessions in the first four cutting time points. Tetraploid varieties of L. perenne have been shown to have higher sugar contents than diploid types (Wilkins, Reference Wilkins1991). However, other studies have shown that (when comparing diploid varieties with other diploid varieties that had been bred for higher WSC content and with tetraploid varieties), tetraploid superiority depends on the genetic background of the variety in question. Diploid varieties bred for higher WSC concentrations were superior to tetraploid varieties in some cases (Smith et al., Reference Smith, Simpson, Culvenor, Humphreys, Prud'homme and Oram2001). This could explain the fact that the tetraploid varieties were not always separated from the other populations. Another factor could be the high variation between populations. Low CP contents were also important for separating the accessions in cutting time points 2–4. This is in agreement with the correlation results discussed earlier. Interestingly, fructose content was only important at cutting time point 1, while glucose content was not contributing significantly to the split at any cutting time point.
Response of groups of accessions over the growing season and to environmental influences
For all the traits, the cutting time was the most significant factor influencing the variation in the traits. In other studies, cutting time was also more of an influence over the variation than genotype, both across years (Turner et al., Reference Turner, Donaghy, Lane and Rawnsley2006b; Skøt et al., Reference Skøt, Humphreys, Humphreys, Thorogood, Gallagher, Sanderson, Armstead and Thomas2007) and across seasons (Tas et al., Reference Tas, Taweel, Smit, Elgersma, Dijkstra and Tamminga2006). This suggests that grassland management and environmental conditions may have more control over the different traits than genotype. However, in the present study, climatic conditions (rainfall, irradiance and mean temperature) had no significant effect on the model for each trait. This may be the result of several factors, i.e. the high variability within traits caused by the cutting time, which masked any small level of variation caused by the effects of weather. Additionally, plants from only one site were analysed and so environmental factors could be expected to affect all the populations in the same way.
Conclusion
WSC, CP and dry matter contents were recorded for 33 L. perenne ecotypes and cultivars at five different harvest time points across the 2004 growing season. While, in general, the cultivars had higher WSC contents than the ecotypes, individual ecotypes did show potential to be used in breeding programmes, as they exhibited higher values than all other accessions at particular cutting time points. In correlation analyses, positive relationships were observed between dry matter content and glucose content both early and late in the growing season, and this was in agreement with the amount of leaves compared with stems at these time points in the growing season. PCA allowed the split either between cultivars and ecotypes or between tetraploid cultivars and the rest of the accessions at four of the five cutting time points. In the analysis of variance, cutting time was the most significant factor influencing the variation in traits.
Supplementary material
To view supplementary material for this article, please visit http://dx.doi.org/10.1017/S1479262113000567
Acknowledgements
This project was financed by Teagasc and the Genetic Resources for Food and Agriculture Scheme of the Irish Department of Agriculture, Fisheries and the Marine. SMG received a Teagasc PhD student fellowship. The authors are grateful to Monica Francioso, Simona Lamorte, Laura Castelli, Jan Philip Jacobsen and Henry Skowski (all supported by the European Community “Leonardo da Vinci” programme) and Adeline Airault for their technical help in carbohydrate analysis.