1. Introduction
The Paris Climate Agreement signed in 2015 by 195 UNFCCC member countries recognized the importance of limiting global average temperature to 2 °C above the pre-industrial level, and then the recent Intergovernmental Panel on Climate Change (2018) report lowered it to 1.5 °C, to prevent further global warming worldwide and catastrophic damages. The COP22 Conference in Marrakesh focused on how to combat climate change and decarbonize energy supplies, combining mitigation, adaptation and financing mechanisms to reduce emissions and facilitate transition to a low-carbon economy. Since then, how to finance the sustainable transition of territories, finding feasible incentives and promoting green products to attract funds, has become a priority (High-Level Commission on Carbon Prices, 2017). This is particularly true for developing countries, which have limited access to capital to invest in water, energy, housing and transportation systems to meet the needs of growing urban populations under the negative consequences of global warming.
Financing is at the heart of energy and emission reduction projects. When it comes to green projects, it appears necessary for investors, whether private or public, to obtain sufficient capital. The government may push forward a series of policies and measurements fostering the development of cleaner technologies, including financial subsidies, special investment allowances, loans at favorable terms and interest rates, and so on. In addition to the abovementioned financing options, green bonds have been presented since their first issuance in 2007 as a new way for investors to access sustainable investments and to finance green technologies and environmental protection projects.
Green bonds are defined as any type of bonds where ‘the proceeds will be exclusively used to finance or re-finance, in part or in full, new and/or existing eligible green projects’ (ICMA, 2017: 2f), that is, environmentally or climate-friendly projects, such as renewable energy, green buildings, clean transportation, sustainable waste management, sustainable land use, biodiversity and clean water. With green bonds, the issuer gets the capital to finance green projects, while the investors receive fixed income in the form of interest. At maturity, the principal is repaid, unless the issuer goes bankrupt. In a way, green bonds are the same as any corporate bond, but they are labelled ‘green’ because the issuer pledges to use their proceeds for environmentally-friendly or climate-focused projects in accordance with sustainability standards (CBI, 2017; CBI, 2018; ICMA, 2017; ICMA, 2018).
The explosive growth of the green bond marketFootnote 1 led Morgan Stanley to describe it as a ‘green bond boom’ (Morgan Stanley, Reference Morgan2017) and the Financial Times (Street, Reference Street2014) wrote that ‘green bonds are the answer to Africa's investment need’.
In Africa, the African Development Bank (AfDB) has been active in the green bond market, issuing triple A investment grade US$500 m green bonds in 2013. Since 2013 the AfDB has issued 6 green bonds, raising US$1.5 billion that were employed for the realization of 24 projects in 14 countries.Footnote 2
Other players in the continent are mainly in South Africa and include IDC (US$700 m) and Nedbank (US$490 m). Green bonds attracted investors outside the local and traditional markets. For example, in the case of the first AfDB issuance, socially responsible investors bought 84 per cent of the bonds. Buyers were 43 per cent asset managers, 28 per cent central banks and official institutions, 28 per cent insurance companies and pension funds and 1 per cent retail and private banks; 52 per cent went to the Americas, 39 per cent to Europe, the Middle East and Africa and 9 per cent to Asia (AfDB, 2015; AfDB, 2016).
Since the birth of the green bond market, the World Bank has collected a total of more than US$10 billion through the issuance of 132 bonds and devolved their proceeds for the implementation of a total of 91 projects (of which 25 came to conclusion) in 28 countries. Some of the completed projects, as reported in the World Bank Green Bonds Impact Report (World Bank, 2017), concern energy efficiency investments in Tunisia; renewable energy projects in Turkey; hydropower plants in Rampur in India; and irrigation, electricity, water, and sanitation infrastructures in the Dominican Republic. The EIB, since the first issue of the Climate Aligned Bond in 2007, has raised around EUR20 billion for the funding of environmentally beneficial projects. Even though most projects are in Europe, there are some in developing countries as well, for example, the construction of the Wayra wind farm and the Rubí solar PV plant in Peru, for which the funding of EUR84.4 million derived from green bonds; and two other wind power plants in Kenya and Mongolia, receiving funds of EUR11.7 million and EUR14.3 million, respectively, from green bonds (EIB, 2017).
In summary, green bonds have been recognized as mechanisms for raising funds, which are parallel alternatives – or additional sources – for sustainability-driven investments that would otherwise not have access to finance. The characteristics of green bonds are not just limited to this ‘additionality’ aspect, linked to promoting and implementing green and inclusive development initiatives, but also cover other aspects, including reputation, transparency and disclosure. The development of process guidelines and voluntary initiatives such as GBPs (Green Bond PrinciplesFootnote 3) and international Green Bond Standards (e.g., Climate Bond Standards), specifying which projects are eligible for inclusion in a Certification Scheme, have further encouraged the allocation into green deals and, in fact, the green label has become crucial to attract a vast base of investors towards this segment.
But when seen in comparison to the global debt market, green bonds are still a small fraction of it – close to 1.4 per cent – indicating a massive potential for the market to grow. One drawback of green bonds is their relatively high price, and thus lower yield, if compared with conventional bonds of the same seniority and issuer, and the often perceived high-riskiness of the green investment. As a consequence, investors are wary of investing in these bonds. In view of the huge potential in accelerating climate actions and promoting sustainable goals, there is a need to build confidence in the green bond market, enhance creditworthiness and gain a better understanding of the financial characteristics of these relatively new instruments.
Overall, empirical analyses (Ehlers and Packer, Reference Ehlers and Packer2017; Zerbib, Reference Zerbib2017; Clapp, Reference Clapp2018; Flammer, Reference Flammer2018; Karpf and Mandel, Reference Karpf and Mandel2018; Reboredo, Reference Reboredo2018) have often found evidence of a ‘greenium’, that is, a discount that makes green bonds funded cheaper than other bonds from the same issuer. In Zerbib (Reference Zerbib2017) a matching method is used to calculate the yield of an equivalent synthetic conventional bond for each green bond issued on December 30, 2016. A negative premium on green bonds is detected, whose average size is related to the bond characteristics. For example, for Investment Grade bonds, the average premium to investors is significantly negative in various market segments, such as EUR bonds (−2 basis points), EUR bonds with a rating lower than AAA (−4 basis points), US$ bonds (−5 basis points), and US$ bonds with a rating lower than AAA (−9 basis points). Consistent with Zerbib's results, Ehlers and Packer (Reference Ehlers and Packer2017) confirm that green bond issuers on average borrowed at lower spreads than they did through conventional bonds. They compared the yields at issuance of a cross-section of 21 green bonds issued between 2014 and 2017 with the credit spreads at issuance of conventional bonds of the same issuer at the closest possible issue date and found a mean difference in spread of around 18 basis points, which is greater for riskier borrowers and tends to decrease in secondary markets.
Karpf and Mandel (Reference Karpf and Mandel2018) examined a much larger set of green bonds issued on the US municipal market and found that the green bond yield curve is systematically below the conventional bond one. Through an Oaxaca-Blinder decomposition of the yield spread between green and conventional bonds, they showed that the lower yield from municipal green bonds is related to their fundamental characteristics regarding creditworthiness, which may suggest that the premium can be interpreted as a measure of the reputation effects of green bonds.
This evidence of a negative premium to bond holders is counterintuitive: it is not explained through credit risk enhancement, because the green labeling and certification are not financial standards and do not imply any direct impact on the credit ratings of specific investments. On the other hand, an indirect credit quality enhancement might ultimately result from the informational advantage to investors provided by the transparent information flow regarding the assessment of conformance with a general standard, the use of proceeds and other issues included in an additional periodic reporting. On the other hand, this conundrum cannot be explained just by the presence of implicit or explicit government subsidies, or special investment allowances for green projects, if any, because a negative premium seems to appear across most issuers and bond categories.
Even though there are empirical works on green bonds, as listed above, which are mainly concerned with estimates of the ‘green bond premium’ and its relationship with bond characteristics (rating, issued amount, governmental vs non-governmental issuer, etc.), to our knowledge, a theoretical explanation of the determinants of the green bond pricing is still an open question. Our work aims at developing a structural model for green bonds to explain the formation of green bond prices and to derive policies which help to make green bonds more attractive to market players. To the best of our knowledge, this is the first paper that studies corporate green bonds from a theoretical perspective. We will try to answer questions such as: Do green bonds enhance the credit quality of the issuer? How does the issuance of green bonds affect other debt instruments (e.g., conventional bonds)? Are green bonds a relatively cheap tool to fund sustainable investment? How can policy makers attract bond holders to green investments?
In particular, in section 2 a model is presented to explain the role of the determinants of the green bond pricing dynamics. Section 3 derives a green bond pricing formula and section 4 offers some numerical computations and sensitivity analyses. Section 5 examines the asset allocation problem for a portfolio of green and conventional bonds. We model the consumer-investor's concern about environmental risk, discuss the impact of changing environmental awareness, and show how it determines the demand of green bonds. Both sections 4 and 5 discuss the ‘greenium’ puzzle. Section 6 discusses the effects of tax incentives for bond financing green projects. Finally, section 7 suggests some policy measures to expand the green bond market and concludes.
2. The model
Let us consider a firm with assets-in-place that generate uncertain earnings before interest and taxes (EBIT) described by a stochastic process of the form:
 $$dY_t =\mu Y_t dt+\sigma Y_t dW_t\comma \; $$
where W t is a standard Wiener process with respect to an assigned filtration {I t}t≥0. The size of Y t is determined by the amount of the firm's output and this random variable is affected by the demand shock for the firm's product as well.
Let r be the market risk-free interest rate and let the growth rate be such that μ < r, as is usual in the financial literature on corporate defaultable debt, where this assumption is adopted for convergence reasons. Let τ denote the corporate tax rate that the firm faces on its income after servicing possible interest payments on its debt.
The production process generates environmental damage, because the employed technology is supposed to be ‘brown’. The environmental damage caused will eventually result in a proportional reduction in the firm earnings.Footnote 4 This can take the form of a fee that is paid by the firm in relation to its carbon emissions or any other form of decrease (e.g., due to reputational issues, or allegations concerning negative impact on the ecosystem) in the firm earnings. Let D denote the damage per unit of production and let p denote the proportional reduction of the firm's income. We can set p ∈ [0, 1], where p < 1 means that not all damage is internalized by the firm, either because it cannot be wholly intercepted or because the social impact is underweighted.
The firm may decide to go ‘green’ and exercise an investment option to develop a cleaner technology. This mitigation policy will result in a smaller environmental damage and thus in a substantial reduction in the penalty on earnings. Let g > 0 denote the intensity of the investment expenditure in the greener technology and let δ be a parameter representing the effectiveness of the technology. We suppose that the green investment allows the initial damage, D 0, to be reduced by a factor e −δ g. Denote D g = e −δgD 0. Before investing in the new technology, EBIT are penalised by an amount pY t D 0, while upon exercising the green investment option the reduction is only pY t D g. A discussion on how the analysis would be affected through non-multiplicative damages is offered in remark 2, where the case of a damage that is proportional to a power of Y (Gollier, Reference Gollier2018) is addressed. Finally, one could incorporate possible random fluctuations of the variable D and specify the stochastic process, for example, as in van den Bremer and van der Ploeg (Reference van den Bremer and van der Ploeg2018). Although we assume that the exercise of the green option is irreversible, the firm has the flexibility to exercise the option at any time.
The main assumption in this model is that the firm will finance its green policy by issuing a perpetual green bond with a continuous coupon. The management chooses to exercise the green option in order to maximize the market value of equity. We do not model conflicts of interest between management and equity holders by assuming that the firm is managed by equity holders and that the equity holders also have the option to stop operations and trigger default in an optimal way. Let Y I denote the level of the fundamental variable Y at which it is optimal to issue a green bond, and let Y* denote the default threshold, i.e., default is triggered whenever Y falls below Y*. In case Y falls below Y*, then the firm goes bankrupt and the original debt holders take over and obtain the firm's unlevered assets net of proportional bankruptcy costs, α(0 ≤ α ≤ 1).The following requirements should be satisfied to have a green bond:
(i) all the proceeds from the bond issuance have to be used in the green project;
(ii) special reporting, monitoring and accounting are needed to guarantee accomplishment of a Green Standard.
We model (i) by assuming that the investment amount equals the bond value at the investment threshold, and we add a fixed cost, K, representing the extra costs related to the requirements in (ii), including the cost of setting up specific teams fully dedicated to the engagement with sustainable goals or the expenditures for external assessment of the sustainability credentials and management of the green bond.
3. Green bond pricing
Let G denote the current value of the green bond. The bond is issued at the investment time and the contractual continuous coupon, g, is tax deductible. If the value of the fundamental variable Y is above the default threshold Y*, then G(Y) satisfies the following equation:
 $$\displaystyle{{\sigma ^2}\over{2}}Y^2\partial _Y^2 G+\mu Y\partial _Y G-rG+g=0\comma \; $$
where r is the risk-free interest rate. A trivial solution of (2) is G(Y) = g/r, which represents the value of a default-free bond. If we look for a general solution of the homogeneous equation related to (2) by guessing a form Y β, then β needs to solve the following equation:
 $$\displaystyle{{\sigma ^2}\over{2}}\beta \lpar \beta -1\rpar +\mu \beta -r=0\comma \;$$
that is,
 $$\beta _\pm =\displaystyle{{1}\over{2}}-\displaystyle{{\mu }\over{\sigma ^2}}\pm \sqrt {\left({\displaystyle{{1}\over{2}}-\displaystyle{{\mu }\over{\sigma^2}}} \right)^2+\displaystyle{{2r}\over{\sigma ^2}}}.$$
Upon default, bond holders receive the value of the firm (evaluated at Y*) minus bankruptcy costs amounting to the fraction  $\alpha \lpar 0 \leq\alpha \leq1\rpar $ of firm value. Combining the default value of G with the limit (or no-bubble) condition G(∞) = g/r, which allows us to get the riskless bond value g/r for large values of Y, we get the following expression for the bond value:
 $$G\lpar Y\rpar =\displaystyle{{g}\over{r}}+\left[{\lpar 1-\alpha\rpar P_g Y^{\ast}-\displaystyle{{g}\over{r}}}\right]\left({\displaystyle{{Y}\over{Y^{\ast}}}}\right)^{\beta_{-}},$$
where P g is a short notation for 1 − τ − pD g/r − μ. Note that β − < 0, while β + > 1, and the shape of (3) is obtained by adopting the no-bubble condition above for large values of Y, as is usual in the literature on corporate bonds.
Default is triggered by equity holders; we therefore compute the default threshold as the level of Y maximizing the post-investment equity value, E(Y). The post-investment equity value solves the following equation:
 $$\displaystyle{{\sigma ^2}\over{2}}Y^2\partial _Y^2 E+\mu Y\partial _Y E-rE+\lsqb Y-g\rsqb \lpar 1-\tau\rpar -pD_g Y=0,$$
and the following boundary conditions:
 $$E\lpar {Y^\ast } \rpar =0\comma \; E'\lpar {Y^\ast } \rpar =0\comma \;$$
ensuring that the equity value equals zero at bankruptcy, due to limited liability, and that equity holders choose the bankruptcy threshold optimally. If the no-bubble condition lim Y→∞ E(Y)/Y < ∞ is adopted, then E(Y) has the following expression:
 $$E\lpar Y\rpar =P_g Y-\displaystyle{{g\lpar 1-\tau \rpar }\over{r}}+\left[{\displaystyle{{g\lpar 1-\tau \rpar }\over{r}}-P_g Y^\ast } \right]\left({\displaystyle{{Y}\over{Y^\ast}}} \right)^{\beta_{-}}\comma \; $$
where
 $$Y^\ast =\displaystyle{{\beta_{-}}\over{\beta_{-}-1}}\displaystyle{{g\lpar 1-\tau \rpar }\over{rP_g}}. $$
Remark 1: As D g < D 0, expression (6) predicts a lower default threshold for a green bond than for a conventional bond with otherwise equal indentures, that is, default is delayed with green bonds. Combining (3) and (6), one gets a higher bond value for the green issuance for fixed parameter values. This effect is confirmed through the numerical computation of section 4 where, additionally, the issue of the cost of the green labelling is addressed as well. The total firm value after investment is the sum of equity and debt values:
 $$V\lpar Y\rpar =P_g Y+\displaystyle{{g\tau}\over{r}}-\left[{\displaystyle{{g\tau}\over{r}}+\alpha P_g Y^\ast}\right]\left({\displaystyle{{Y}\over{Y^\ast}}} \right)^{\beta_{-}}. $$
Equity holders choose the investment threshold Y I to maximize the ex ante equity value, V 0 (Y). This is of the form  $P_{0} Y+\hat{A}Y^{\beta _+}$, where the latter represents the investment option.Footnote 5 By matching the ex ante and ex post values, net of the cost K, and their derivatives at the point Y I, the investment threshold and the arbitrary constant  can be determined. The extra cost K embodies the additional expenditures related to a green bond issuance, including separate accounting, additional monitoring and reporting, as requested by the GBPs. The two matching equations are solved numerically for  and Y I.
Remark 2: In Gollier (Reference Gollier2018) the damage function is assumed to be proportional to Y ξ where Y is the per-damage output. So one may wonder how our model is changed if a multiplicative damage function (ξ = 1) is replaced with a power function.Footnote 6 Extending our arguments in this new framework, we find that the equation (6) for the default threshold should be replaced with the following equation:
 $$\displaystyle{{1-\tau}\over{r-\mu}}Y^{\ast}+\displaystyle{{pD_g}\over{0.5\xi \lpar \xi -1\rpar +\mu \xi -r}}\lpar Y^{\ast}\rpar ^\xi +\displaystyle{{\beta_{-}}\over{1-\beta_{-}}}\displaystyle{{g\lpar 1-\tau\rpar }\over{r}}=0.$$
As a general result is hardly obtained, let us focus on the case ξ ≈ 1 and μ < σ 2/2. In this case, it can be shown that when  $\xi >1 \ \lpar \xi <1\rpar $ the default threshold is decreased (increased) with respect to the linear case, and the greenium is increased (decreased) relative to the linear case. Thus, our results are amplified in the case of damages proportional to Y ξ with ξ > 1.
Finally, we compute the optimal level of the coupon, g*(Y), under a ‘first-best’ scenario, that is, when a firm-value-maximizing investment policy is pursued. Specifically, one gets the optimal coupon level by solving the equation ∂g V(Y) = 0 for g, where the firm value is given by (7). The equation can be written as follows in a more explicit form:
 $$\displaystyle{{p\delta gD_0}\over{\lpar 1-\tau \rpar e^{\delta g}-pD_0}}\lsqb \lpar \beta^{-1}\rpar \tau +\alpha \lpar 1-\tau \rpar \rsqb +\lpar 1-\beta^{-}\rpar \tau -\left({\displaystyle{{Y^{\ast}}\over{Y}}}\right)^{\beta^{-}}=0. $$
Of course, the optimal coupon level can be obtained from equation (8) through numerical computation only.
4. Numerical computation
In what follows we perform numerical computation to compare the green bond value and yield at issuance to an otherwise comparable non-green bond. As an illustration, we consider a green bond (ISIN Code: XS1550149204) issued by Enel, the main Italian utility producing and distributing electricity. Enel committed to decarbonize its energy mix and to contribute to achieving four of the seventeen UN Sustainable Development Goals, in particular SDG 13. The issuance of green bonds is seen as an ideal tool to finance the transition to a low carbon economy. The bond was issued on 16 January 2017 with a coupon rate of 1 per cent and will expire on 16 September 2024. Our sample size consists of 338 observations and the parametric model by Nelson and Siegel has been used to build the yield curve for the issuer. The analysis confirms a greenium with median 6.89 basis points (bps) and a range between 0.43 and 17.96 bps.
Our theoretical model is implemented by using the following parameter values: r = 0.385 per cent is extracted from the EU yield curve at the time of our observations by interpolation, μ = −0.286 per cent and σ = 28.86 per cent are estimated from the Enel stock prices in the year before the bond issuance. The Italian corporate tax rate is 27.9 per cent including IRES (Imposta sul REddito delle Società – corporate income tax) and IRAP (Imposta Regionale sulle Attività Produttive – regional tax on production). Bankruptcy costs are assumed at the 15 per cent level, in keeping with empirical literature in corporate finance (e.g., Altman and Hotchkiss, Reference Altman and Hotchkiss2006). The parameters relating to the green projects are calibrated in order to achieve an advantage of 20 per cent to sustainable returns, as empirical estimates report that, on average, the market ascribes a valuation premium to sustainable competitive advantage that tends to be capped out at this level (Ling et al., Reference Ling, Forrest, Fox and Feilhance2007). We compute the greenium, where the greenium is defined as the difference between the yields on a conventional bond and a green bond with the same characteristics. If the issuance cost for the green bond, K, is fixed at the 2 per cent level of the earnings, we get a greenium of 4.17 bps; if the cost is larger, the green bond issuance is delayed and the greenium at issuance is slightly larger. On the other hand, if a periodic cost is subtracted from earnings, the greenium is reduced (for example, to 3.82 bps with a 1 per cent annual cost) as the negative effect on earnings materializes through a premium required by the market; in any case, whenever the costs are not too high, a significant positive premium to the issuer can be detected. Note that the greenium we get in the base case is included in the range of the greenium we found in the empirical analysis, but it is slightly smaller than the estimated mean and median values. An improvement might come from a more precise estimation of the costs and other considerations that are not modelled in this framework, for example, possible special investment allowances or guarantees to bond holders.Footnote 7 On the other hand, it is known that structural models usually generate lower credit spreads than those estimated from empirical data, which comes from the implicit assumption of complete information available to market players. A better fit of market data could be obtained by adopting an incomplete knowledge of the firm's fundamentals, as suggested in the financial literature on incomplete information.
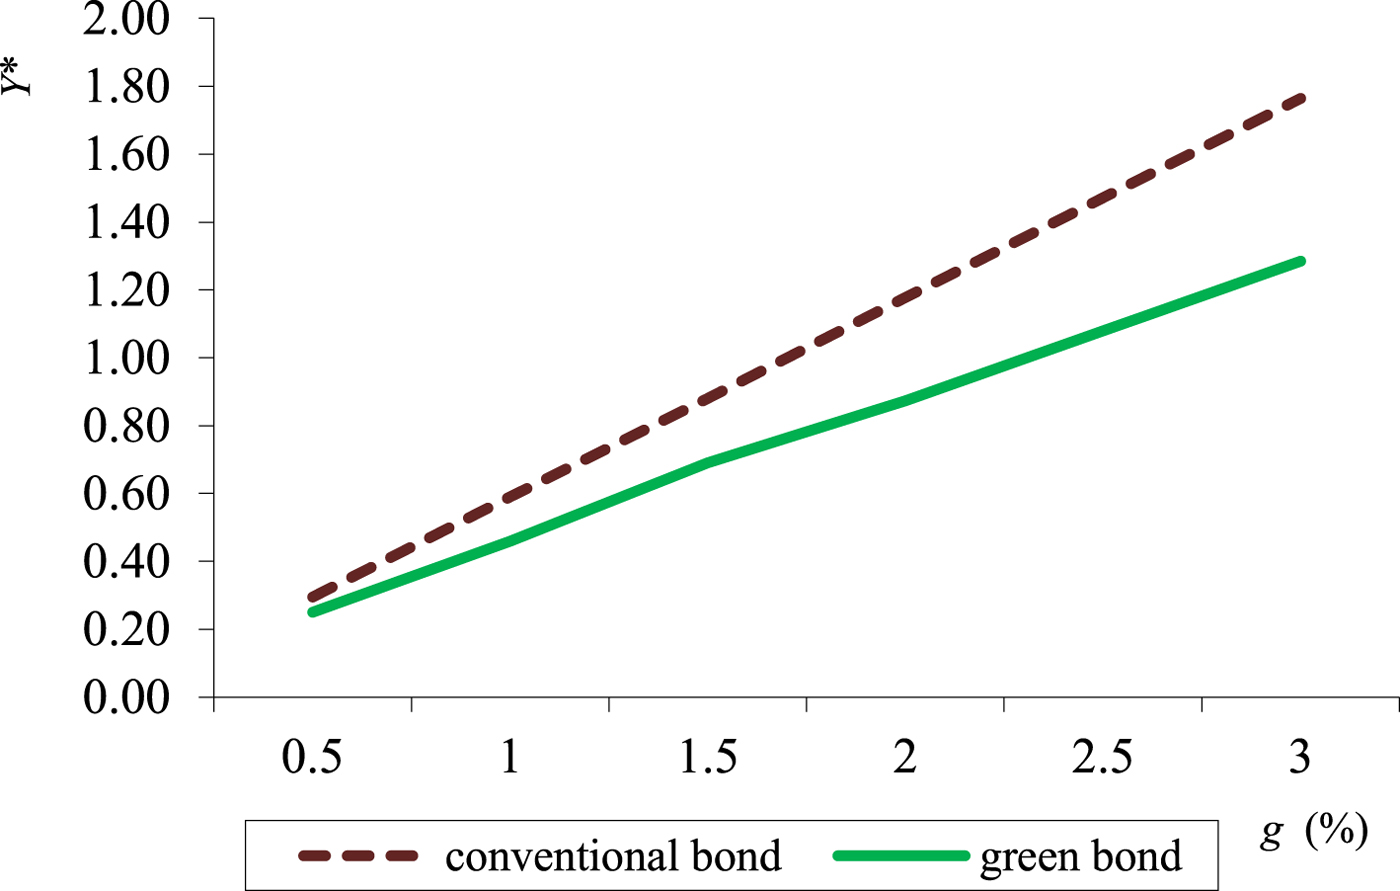
Incidentally, we can compute that with these parameter values the default threshold for the green bond is decreased relative to the default threshold of a comparable conventional bond. Figure 1 depicts the default trigger for a green and a conventional bond as functions of the coupon level. As expected, default occurs earlier for higher values of the interest payment, but the default threshold is lower if the bond proceeds contribute to better sustainable returns for the firm, as is the case with green investments. An improvement in credit quality could ultimately lead to a lower cost of capital for green bond issuers.
Default thresholds as a function of the coupon level

Let us perform sensitivity analysis with respect to the relevant parameters, while keeping the other parameters the same as in the base case. As table 1a shows, a higher asset volatility increases the greenium as the default threshold is lowered. The effect of asset volatility on the default trigger is a common feature in many structural models in corporate finance and, as a result of the shift in the default threshold, a higher volatility decreases the risk premium on a bond yield. However, the impact on the greenium is not straightforward. As for the parameters governing the green technology, an improvement related to a more effective technology widens the greenium, as expected. Similarly, the higher the penalty is for not investing in a green project, and therefore the larger the sustainability advantage, the wider the greenium becomes. On the other hand, a decrease in the corporate tax rate increases earnings, but reduces the tax benefit of the debt service, and the net effect shrinks the green premium to the issuer.
Sensitivity of the greenium to asset volatility (σ)

Sensitivity of the greenium to the effectiveness of the green technology (δ)

Sensitivity of the greenium to the sustainability advantage/disadvantage (p)

Sensitivity of the greenium to the corporate tax rate (τ)

5. Why do investors choose green bonds?
In this section we model the demand side of a green bond by solving the problem of a prototypical (representative) consumer-investor who can invest both in a green bond and in a conventional bond issued by the same company. Following a stream of economic literature on environmental risk, we assume that damages affect future consumption multiplicatively (see Lemoine, Reference Lemoine2017); that is, the instantaneous utility, U, is a function of c/F(D), where c is the consumption rate and F is a function of the damage. In the models of climate change, F(D) is eventually expressed as a function of global warming. Here we adopt a simple expression to keep the setting very generic and assume that F(D) = 1 + εD, where ε…0 is a measure of the consumer's concern about environmental risk, for example, the case ε = 0 represents an environmentally neutral individual.
Let N g denote the number of green bonds and N b the number of conventional bonds in the investor's portfolio. Let R(t) denote the total wealth at time t. Then the consumer-investor's budget equation is:
 $$dR=N_g \lpar t\rpar dG\lpar t\rpar +N_b \lpar t\rpar dB\lpar t\rpar -c\lpar t\rpar dt\comma \; $$
where G (respectively, B) is the green (respectively, conventional) bond value that has been obtained in section 3 in explicit form. Let x = N g G/R denote the share of wealth in the green bond and thus 1 − x = N b B/R is the share of wealth invested in the conventional bond. In view of expression (3) for the green bond value G and a similar expression for B, the budget equation can be rewritten as:
 $$dR=\displaystyle{{\beta^{-}R}\over{r}}\left[{r-\displaystyle{{b}\over{B}}+x\left({\displaystyle{{b}\over{B}}-\displaystyle{{g}\over{G}}}\right)}\right]\displaystyle{{dY}\over{Y}}-cdt. $$
For notational convenience let us denote b/B by  $\hat{b}$ and g/G by ĝ, that is,
 $\hat{b}$ and ĝ are the yields on the two bonds. In what follows, the yields will be evaluated at the issuance, although a more general case can be handled within this framework. Finally, as dY t = μY t dt + σY t dW t, we get the following budget equation:
 $$dR=\left[{\displaystyle{{\beta^{-}\mu R}\over{r}}\lpar r-x{\hat g}+\lpar x-1\rpar {\hat b}\rpar -c} \right]dt+\left[{\displaystyle{{\beta^{-}\sigma R}\over{r}}\lpar r-x{\hat g}+\lpar x-1\rpar {\hat b}\rpar } \right]dW_t. $$
The consumer-investor's problem is:
 $$\hbox{max}_{x\comma c} \; E=\left[{\vint_0^\infty {e^{-rt}U\left({\displaystyle{{c_t}\over{1+\varepsilon D}}} \right)dt}} \right]\comma \; $$
such that the state variable R follows (11) and Ro is given. Denote the current value of the value function by J(R). Then the Bellman equation is:
 $$\eqalign{&\hbox{max}_{{\rm x\comma c}} \left[U\left({\displaystyle{{c}\over{1+\varepsilon D}}} \right)-rJ\lpar R\rpar +\left[{\displaystyle{{\beta^{-}\mu R}\over{r}}\lpar r-x{\hat g}+\lpar x-1\rpar {\hat b}\rpar -c} \right]J^{\prime}\lpar R\rpar \right. \cr & \quad +\left. \displaystyle{{\sigma^2}\over{2}}\left[{\displaystyle{{\beta^{-}R}\over{r}}\lpar r-x{\hat g}+\lpar x-1\rpar {\hat b}\rpar }\right]^2J{\prime\prime}\lpar R\rpar \right]=0.}$$
The first-order conditions yield:
 $$U{\prime} \left({\displaystyle{{c}\over{1+\varepsilon D}}}\right)=\lpar 1+\varepsilon D\rpar J{\prime} \lpar R\rpar \comma \; $$
 $$x=\displaystyle{{r-{\hat b}}\over{{\hat g}-{\hat b}}}+\displaystyle{{\mu r}\over{o^{2}\beta ^{-}\lpar {\hat g}-{\hat b}\rpar }}\displaystyle{{J{\prime}\lpar R\rpar }\over{RJ^{\prime\prime}\lpar R\rpar }}. $$
Note that the values of  $\beta^{-}\comma \; {\hat b}\comma \; {\hat g}$ depend on the parameters r, μ, σ, τ, α and therefore the behaviour of x with respect to the relevant parameter is hard to guess. In order to gain insight, we explicitly solve the problem in the case of an exponential utility function, U(C) = −exp( − γC)/γ, where γ embodies risk aversion. Note that this utility function does not separate risk aversion and intertemporal substitution, as, for example, Epstein-Zin preferences.
To obtain an explicit expression for the value function, we look for a solution such that  $J' \lpar R\rpar =A\cdot \exp \lpar a\sqrt R\rpar $, with A and a to be determined. Solving (13) for c and plugging the expression obtained for c and (14) into the Bellman equation above, we get
 $a=-\sqrt {4\gamma \varphi /\lpar 1+\varepsilon D\rpar } $ and A = 1/1 + εDexp(1 − r/2φ) with φ = r/2 + (μ/2σ) 2. Thus, the optimal share of green bonds in the portfolio, when the wealth R is normalized to 1, becomes:
 $$x=\displaystyle{{{\hat b}-r}\over{{\hat b}-{\hat g}}}+\displaystyle{{\mu r}\over{o^2\beta ^-\lpar {\hat b}-{\hat g}\rpar }}\displaystyle{{\sqrt {1+\varepsilon D} }\over{\sqrt {\gamma \varphi}}}. $$
Expression (15) specifies the optimal allocation between green bonds (x) and conventional bonds (1 − x). Note that the share of green bonds is at least as large as the share of conventional bonds whenever
 $${\hat b}-{\hat g} \lt {\hat g}-r+\displaystyle{{\mu r}\over{o^{2}\beta^{-}}}\displaystyle{{\sqrt {1+\varepsilon D} }\over{\sqrt {\gamma \varphi } }}\comma \; $$
that is, the ‘greenium’  $\lpar {\hat b}-{\hat g}\rpar $ should not exceed the credit spread on the green bond
 $\lpar {\hat g}-r\rpar $ augmented by a premium that increases with ε and decreases with the risk aversion parameter γ.
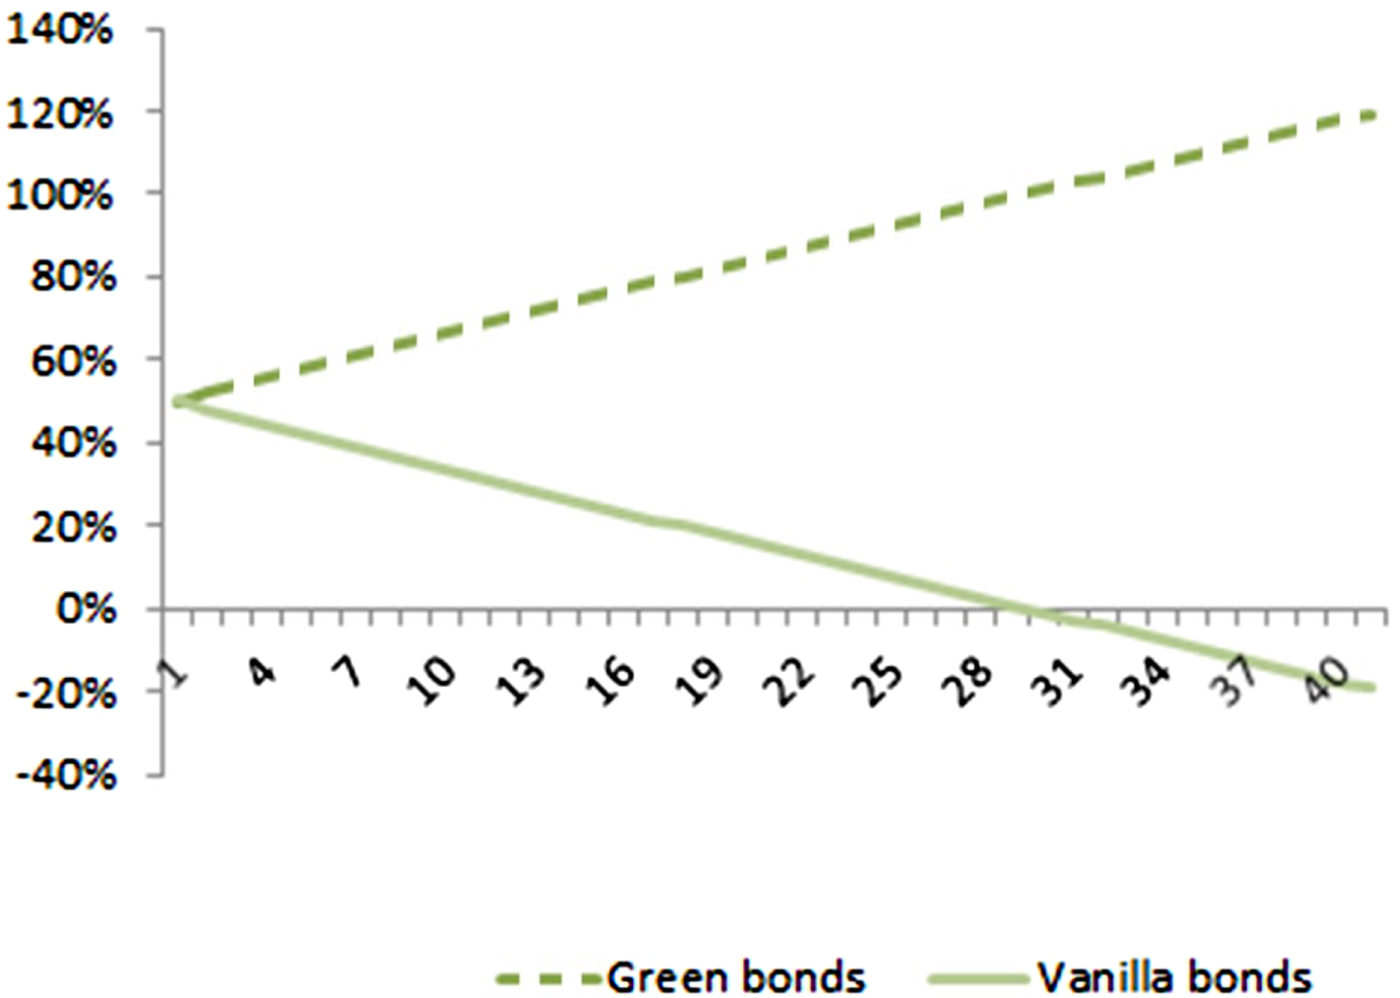
As an exemplification, in figure 2 we show how the portfolio allocation can be affected by the degree of a bond holder's concern about environmental damage (embodied by ε). We use annualized returns on the S&P Dow Jones Green Bond Index (DJ-GB) and Aggregate Bond Index as of 31 October 2018. Green bond indices are a good indicator to analyze the secondary market performance of green bonds from an investor's perspective, as suggested by Ehlers and Packer (Reference Ehlers and Packer2017). In fact, they contain a diversified broader portfolio of bonds and therefore provide a good means of comparison with the performance of other bond indices for a wide range of investors. Also Reboredo (Reference Reboredo2018) uses the S&P Dow Jones Green Bond Index to track the financial performance of green bonds. Figure 2 shows the sensitivity of the two shares x and (1 − x) to the parameter ε. We set both portfolio weights at 50 per cent for ε = 0 by selecting the risk-aversion parameter γ, that is, we start with environmentally ‘neutral’ investors who allocate their wealth between the two bonds to diversify financial risk. ε is then increased to represent a higher degree of green commitment. For very large values of ε, the bond holder overinvests in the green bond, even by taking a short position in the other financial security.
Asset allocation as a function of environmental preferences
As a consequence, a widespread environmental awareness will lead to an increased demand for green bonds and to issuing oversubscriptions, which would provide a cheaper way to fund environmentally- sustainable projects.
This analysis complements the stream of research on the effect of green investing on the corporate behavior of firms (see, e.g., Heinkel et al., Reference Heinkel, Kraus and Zechner2001), where the cost of capital is obtained from the relative proportion of green versus non-green investors. However, in our paper the focus is on bond investors and the dynamics refers to the firm policy instead of market equilibria.
The value consumers-investors attach to environmentally-sustainable products, and thus a measure of their green mandate, could be extracted by some empirical analyses, or field experiments. A few recent papers (Hainmuller et al., Reference Hainmuller, Hiscox and Sequiera2015; Becchetti et al., Reference Becchetti, Salustri and Scaramozzino2018) provide evidence about the values consumers attach to ethical sourcing. They applied various treatments to a wide range of green products and tested the impact of a simple form of advertising on environmentally responsible products with and without increase in prices, to show that public information on corporate environmental goals generates significant changes in demand for these products.
In order to provide evidence of a link between asset allocation and an investors' green mandate, one needs data on the percentage of the total green debt that is sold to green investors. Some 2017 joint reporting by the Climate Bonds Initiative and the International Finance Corporation provides evidence of a significant portion allocated to those labeling themselves as socially responsible, or green investors, with an average allocation of 62 per cent in the developed markets and of 25 per cent for emerging markets. Overall, the percentage of green bonds allocated to buyers who identify themselves as green investors is increasing and is expected to increase for emerging markets as well.
Finally, we stress that the disclosure of investors' preferences toward environmental sustainability has been recently integrated into the suitability obligations arising from EU Directive 2014/65 (MiFID II) and EU Directive 2016/97 (IDD). The proposal, released on 24 May 2018, recommends the introduction of questions that would help investment firms and insurance intermediaries identify the clients' investment objectives, including environmental preferences. Therefore, each client's individual environmental, social and governance (ESG) concern will be collected and considered in the design of the financial products offered and aggregate information regarding the investors' preferences for environmentally responsible investing might soon be disclosed.
6. Tax advantage
The promotion of green lending sometimes takes the form of tax-based incentives. Central and local governments can take measures to attract capital from investors and expand the green bond market. These forms of supporting policies can be helpful especially in the earliest stage, when investors need to gain confidence in the new financial tools and the issuers are developing a credit history in the green sector. Tax incentives for bonds financing renewable energy and green buildings are present in the US and have been proposed for labeled green bonds in various countries. In India, some concessions in the form of tax exemptions were introduced to stimulate the domestic demand for green bonds. The tax-free bond issued by the Indian Renewable Energy Development Agency Limited (IREDA) in 2016 was oversubscribed by more than five times.
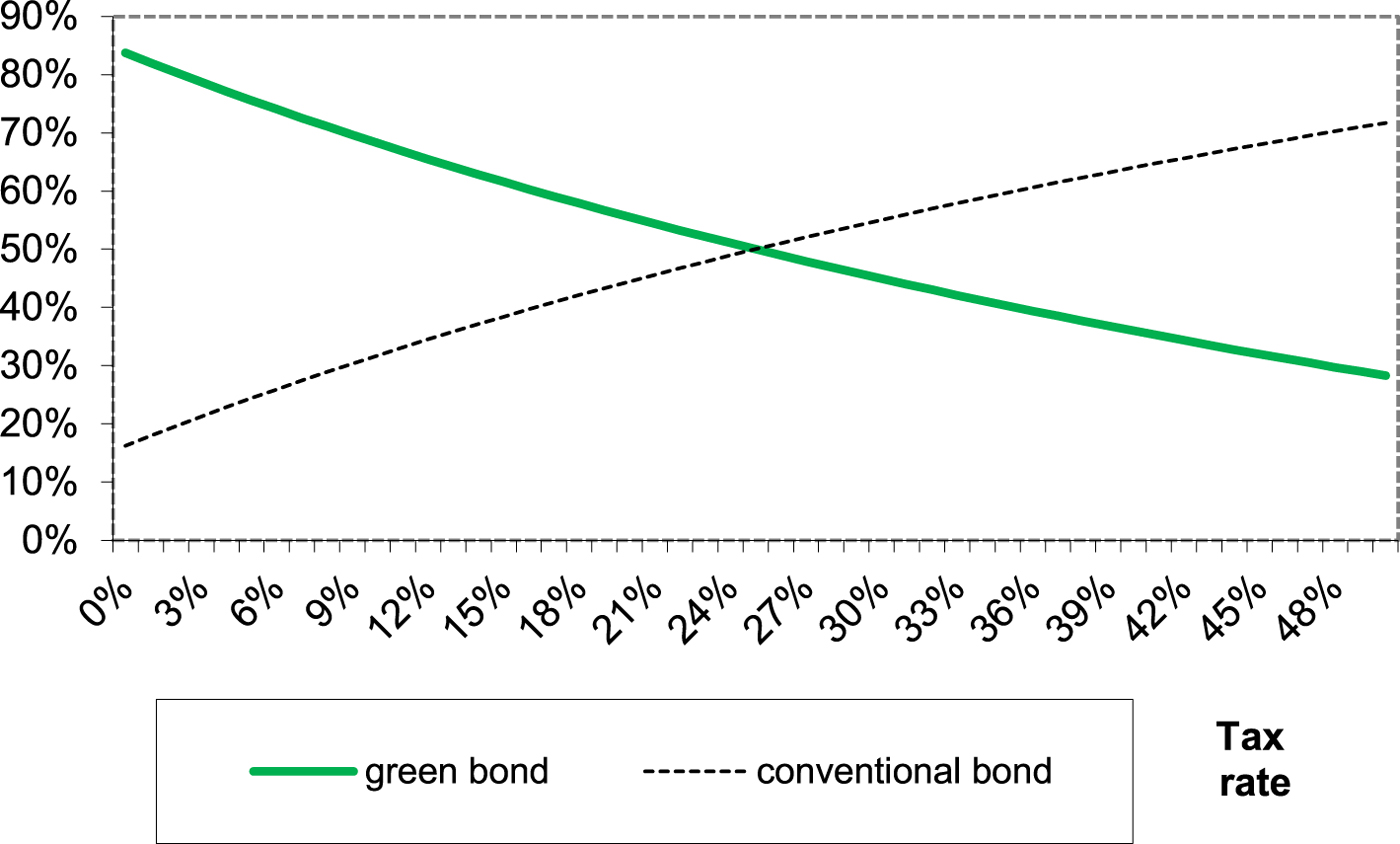
In this section we study the impact of a favorable tax rate on the proceeds from a green bond in comparison to a conventional bond. We fix the tax rate for conventional bonds at 25 per cent, which is a common percentage across Europe, while varying the tax rate that bondholders have to pay on the coupons of a green bond. We assume that the bond holder equally splits his/her portfolio between green and non-green bonds when the tax rate is the same (25 per cent) for both bonds.
As figure 3 shows, the tax rate on the coupon has a significant impact on the investors' decision. Thus governmental tax-based incentives play a significant role in scaling up green bond markets.
Bond portfolio vs tax rate on green bonds
7. Conclusions
This paper contributes to the growing literature on impact investing, which is the new set of financial instruments that aim to generate ‘environmental impact alongside financial return’ (Global Impact Investing Network, 2018). In fact, corporate green bonds contribute to both environmental and financial performance. Our paper fills the gap in the existing literature concerning the lack of a theory regarding the main drivers of the specific nature of green bonds. A structural model for green bonds is introduced here to explain the formation of green bond prices and to address the issue of the so-called ‘greenium’, that is, a discount that makes green bonds funded cheaper than other bonds from the same issuer. Despite the rapid growth and evolution of the green bond market, a theoretical model for these financial instruments is still lacking. Our paper is the first, to our knowledge, to take an analytical approach in this field. By adapting the structural model of corporate bonds, we are able to provide some analytical formulas and to investigate the role of several relevant factors for the green bond pricing dynamics. In particular, we provide an answer to the following questions: What are the determinants of the green bond value? Do green bonds enhance the credit quality of the issuer? Are green bonds a relatively cheap tool to fund sustainable investments?
In particular, we derive an expression for the green bond value depending on several factors, including asset volatility, tax rates, effectiveness of the green technology and a parameter measuring the sustainability advantage, and show that the greenium is increased if asset volatility increases, the parameters governing the green technology and the sustainability advantage increase, and corporate tax rates are decreased. We also show how an improvement in credit quality induced by the green label ultimately leads to a lower cost of capital for green bond issuers. Finally, we study the effect of investors' environmental concern on portfolio allocation.
Our results could have direct implications in terms of policy and suggest that in order to accelerate the green bond market: (i) green bonds should be made tax-exempt, or at least with lower taxes than conventional bonds; (ii) policy-makers should invest in environmentally responsible education, providing proper information and elicitation of consumers' green preferences, so as to affect consumers-investors' demand and increase investors' green mandate; (iii) transparency should be increased on green projects, so as to improve the issuer's creditworthiness; (iv) the cost of obtaining and monitoring the green label should be reduced. These measures could be especially necessary in the case of developing economies, where the debt markets have not matured enough to be able to properly leverage this innovative instrument.
Our paper has addressed these questions, but as the market for green bonds is still developing, further evidence is needed to expand the model and draw more consistent conclusions.