Various scientific modeling approaches exist to forecast elections. Historical (or vote-function) models predict election outcomes based on past patterns of voter behavior and rely on the use of aggregate-level historical data about political and economic factors (Bélanger and Trotter Reference Bélanger, Trotter, Arzheimer, Evans and Lewis-Beck2017).
Although the first electoral forecasting models were about American presidential elections, they inspired the so-called “modèle de l’Iowa,” which relies on a historical approach to estimate the vote for presidential left-wing candidates in elections of the French Fifth Republic (Fauvelle-Aymar and Lewis-Beck Reference Fauvelle-Aymar and Lewis-Beck1997, Reference Fauvelle-Aymar and Lewis-Beck2002; Lewis-Beck Reference Lewis-Beck1995; Lewis-Beck, Bélanger, and Fauvelle-Aymar Reference Lewis-Beck, Bélanger and Fauvelle-Aymar2008). Following the political-economy tradition, the Iowa model is parsimonious in that it includes only two independent variables: the national unemployment rate and the popularity of the sitting president. Because both predictor variables are lagged by six months, it also has considerable lead time, which allows for a forecast in late autumn of election rounds held in the spring as is typical in France. From this perspective, the Iowa model incorporates the two key features of electoral forecasting models—namely, parsimony and lead time (Lewis-Beck Reference Lewis-Beck2005).
With the development of the forecasting literature in France, a variant of the Iowa model was proposed (Nadeau, Lewis-Beck, and Bélanger Reference Nadeau, Lewis-Beck and Bélanger2010, Reference Bélanger, Lewis-Beck and Nadeau2012). This so-called “proxy model” relies on the use of a single predictor, the executive popularity index (EPI), which acts as a proxy of electoral support. Although the proxy model relies on only one predictor, previous work has shown that the EPI is closely related to three factors commonly used in French electoral-forecasting models: unemployment, cohabitation, and the cost of ruling. With these characteristics, the proxy model may well represent an improvement over the Iowa model while keeping within its original spirit. Yet, is the proxy model indeed better than the Iowa model when it comes to predicting the result of presidential elections?
Is the proxy model indeed better than the Iowa model when it comes to predicting the result of presidential elections?
This article answers this question by exploring the relative efficiency of the Iowa and proxy models in predicting the vote for all left-wing candidates in the 1965–2017 presidential elections. The results indicate that the difference between the predicted and the actual vote is lower for the proxy model than the Iowa model in six of 10 presidential elections, which implies that the proxy model may be a better forecasting tool than the Iowa model. Leveraging the proximity of the 2022 French presidential election, we then used the proxy model to make a forecast for the 2022 election. The resulting forecast suggested that the odds appeared good, although not overly so, for outgoing President Emmanuel Macron to be reelected.
COMPARING THE IOWA AND THE PROXY MODELS
The Iowa model represents a natural first candidate to turn to when attempting to predict the winner of a French presidential election. This model is attractive for two main reasons: its parsimony (i.e., it includes only two independent variables) and its lead time (i.e., the two predictor variables are lagged by six months). In turn, the proxy model relies on the use of a single predictor, the EPI, which acts as a proxy of electoral support. Both historical models rely on the theory of responsibility attribution (Key Reference Key1966). They predict the support to be received by the incumbent based on its past record in office as measured by the “fundamentals” of the economy and popularity, with voters expected to reward (or sanction) an incumbent who has a good (or bad) governing record.
It is important that although the proxy model includes only a single predictor, it is somewhat more complex than the Iowa model. More precisely, the coding of the EPI variable depends on the type of presidential contest analyzed because the responsibility target must be identified but can vary depending on the competition context (see Nadeau, Lewis-Beck, and Bélanger Reference Nadeau, Lewis-Beck and Bélanger2010). Four types are possible. The first type is a presidential incumbent election in which the sitting president is running for reelection. For this first type, the EPI assumes the value of the president’s job-approval rate as recorded six months before the election. The second type is a quasi-presidential incumbent election in which the president is not on the ballot but a candidate from his or her party is widely considered as his or her dauphin (i.e., the person most likely to succeed), as was the case in 1969. In such a case, the EPI still assumes the value of the president’s approval rate. The third type is a prime-ministerial election in which a prime minister is running in the absence of an incumbent president or a clear presidential dauphin, as was the case in 1974 and 1995. For this type of election, the appropriate EPI value should be the prime minister’s job-approval rate six months before the election. The fourth type is an “open” election, which does not conform to any of the other three types. These are elections in which the retiring president’s approval rate should not affect the outcome as much as for quasi-presidential incumbent elections, and in which the current government’s approval rate should not have as much a role as for prime-ministerial contests. In this situation, as in 2007, the attribution of responsibility is more diffuse than in any other type of election. We can presume that the EPI is best measured by the second-round vote intentions for the main candidate of the outgoing administration, also with a six-month lead.
Correctly classifying each presidential-election contest of the Fifth Republic into one of these four types was a relatively straightforward exercise for the 1965–2012 period; we relied on Nadeau, Lewis-Beck, and Bélanger’s (Reference Nadeau, Lewis-Beck and Bélanger2012) classification for that period. How best to classify the 2017 election and add it to the data pool? If we turn back the clock to six months before the 2017 presidential election (i.e., November 2016), sitting President François Hollande was heavily rumored not to be running again (he officially announced it in early December). Then–Prime Minister Manuel Valls was widely considered as the person most likely to win the Parti Socialiste (PS) presidential nomination (he ultimately lost the nomination to Benoît Hamon in the January 2017 PS primary). Emmanuel Macron, a former minister in the Valls government, also was believed to be interested in running for president. That said, Macron, like Valls, took pains to distance himself from Hollande and the PS, creating his own political party, En Marche!, in August 2016.
Therefore, with Hollande seemingly out of the running and Valls deemed the most viable candidate to run for the PS, the 2017 presidential election should be considered as a prime-ministerial election. Valls was not viewed as Hollande’s dauphin and, in any case, did not want to be perceived as such. His campaign bid relied more on his own record as prime minister, in which case the EPI would be equal to Valls’s Institut Français d’Opinion Publique (IFOP) job-approval rate of November (i.e., 26%).
Considering the 2017 election as a prime-ministerial type provided a close prediction of the level of votes obtained by the Left in the first round of that contest. The forecast was 26.1% of support for the Left in the first round—only 1.8 percentage points lower than the actual support that the Left received in 2017. In accordance with responsibility-attribution theory (Key Reference Key1966), the low support for the Left in the first round suggests that French voters sanctioned the executive’s poor record while in office, despite the absence of Valls (and even Hollande) on the presidential ballot. The proxy model’s mean absolute forecast error was 4.3 percentage points when the 2017 election was added to the pool (i.e., 1965–2017).
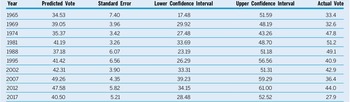
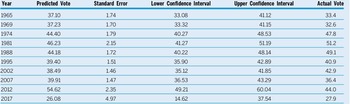
For comparison purposes, figure 1 shows the track records for the Iowa model and the proxy model related to forecasting the vote for all left-wing candidates in the 1965–2017 period.Footnote 1 We observed that in six of the 10 presidential elections held between 1965 and 2017, the proxy model performed better than the Iowa model. More precisely, whereas in 1965, 1995, 2002, and 2012, the Iowa model provided an estimate that more closely resembled the actual vote, in 1969, 1974, 1981, 1988, 2007, and 2017, the proxy model performed better. Also, the mean absolute error (MAE) was lower with the proxy model (4.3) as compared to the Iowa model (7.2). Based on these results, we therefore conclude that the proxy model may represent, on average, a better forecast model than the Iowa model. However, we focused here on first-order (presidential) elections only. Therefore, it is possible that the proxy model may perform less well on other types of elections than the Iowa model.
…in six of the 10 presidential elections held between 1965 and 2017, the proxy model performed better than the Iowa model.
Out-of-Sample Forecasts from Iowa Model (Left Panel) and Proxy Model (Right Panel)
Notes: Solid and hollow dots are actual and predicted total left vote shares (in percentage), respectively, in the first round. See tables 1 and 2 for an estimation of the forecasts’ 95% confidence intervals.

FORECASTING THE 2022 PRESIDENTIAL ELECTION
Given the better performance of the proxy model than the Iowa model, we leveraged the proximity of the 2022 presidential election and forecasted the vote for all left-wing candidates in this election. In historical perspective, Macron’s approval rate (i.e., 40% in the November 2021 IFOP poll) was relatively low, and it may have represented the reason why our forecast was not overly optimistic for his reelection. More precisely, our prediction—with Macron classified as a Centrist candidate (and, consequently, on the Right in both historical modelsFootnote 2)—was for the Left to receive less than majority support in the first round (47.3% with CI [42.8, 51.7]). These results suggested that Macron may make it to the second round and be supported by moderate right-wing citizens, as well as left-wing citizens who would vote strategically to have a representative of the Center with chances of winning the second round of the French presidential election (Blais Reference Blais, Cautrès and Mayer2004).
The proxy model also can be used to forecast the second-round vote (see Bélanger, Lewis-Beck, and Nadeau Reference Bélanger, Lewis-Beck and Nadeau2012). Indeed, changing the dependent variable, from first to second round, while keeping the EPI as the predictor variable actually yielded good forecast results, with an out-of-sample MAE of only 1.8 points.Footnote 3 That said, doing so assumes that no factor can modify the relationship between the EPI and the incumbent vote between the two rounds, which can be seen as a potential limitation. For the second round of 2022, the proxy model predicted a close race between the Left and the Right. In many ways, this may have been favorable to a more centrist candidate such as Macron. More precisely, our second-round forecast was that the left-wing candidate would receive 51.6% of the vote (with CI [49.3, 53.8]), meaning that Macron would win the election when competing with another candidate from the Right. In this sense, in the absence of a Left candidate on the second-round ballot, Macron would rally enough votes from the Left to repeat his feat of 2017. In contrast, our model predicted that Macron would lose the election if a candidate from the Left competed against him in the second round.
Among potential other candidates that could join Macron in the second round, we counted Éric Zemmour, Marine Le Pen, and Valérie Pécresse. Thus, unless Jean-Luc Mélenchon from La France insoumise managed to rally the Left, no candidate from the Left would reach the second round. Zemmour and Le Pen are both from the Far Right whereas Pécresse represents the more Traditional Right under Les Républicains (LR), although she is more extreme than LR’s median party member. Zemmour and Le Pen would have a difficult time defeating Macron in the second round for being too extreme. Pécresse, however, would represent a real threat to Macron’s reelection bid. In a second-round scenario, Pécresse potentially could attract some of Zemmour’s and Le Pen’s voters who would want to see Macron gone. To be sure, few or none of the Extreme-Right voters would prefer to cast a vote for Macron. A second round between Pécresse and Macron would be a tight race and its outcome would depend, in part, on what the disaffected Left voters would do. In theory, they would be more attracted to the Centrist candidate, Macron. Many, however, were unhappy with his government and, in particular, his handling of the COVID-19 crisis. If many of them also had decided to sit out in the second round, Macron might well have lost his reelection.
DISCUSSION AND CONCLUSION
This article examines the relative efficiency of the Iowa model—a commonly used forecasting model in France—and the proxy model—a variant of the Iowa model—to predict the vote for all left-wing candidates in the 1965–2017 French presidential elections. We show that the proxy model may perform better than the Iowa model in predicting the vote for left-wing candidates in these elections. In additional tests, we used the proxy model to forecast the vote for left-wing candidates in the 2022 presidential election. The proxy model predicted that Macron would pass to the second round and that he would win the election if competing with a more extreme right-wing candidate such as Le Pen or Zemmour. However, the forecast suggested that a Macron victory was less certain against a more moderate right-wing candidate such as Pécresse.
The proxy model predicted that Macron may pass to the second round, and that he may win the election if competing with a more extreme right-wing candidate such as Le Pen or Zemmour.
The greater flexibility of the proxy model was desirable but also had certain drawbacks. Most important, in comparison with the Iowa model, the proxy model added a significant layer of complexity that relates to the identification of the type of different elections. Furthermore, as was the Iowa model, the proxy model was limited in that it predicted the vote for the Left; therefore, it could not determine who was likely to win when two right- or left-wing candidates were competing in the second round of an election. Given the growing tendency of the Left to be excluded from the second round of French presidential elections, this represents an important limitation of both the Iowa and the proxy models.
In conclusion, a key takeaway from this study is that although the classic Iowa model has been used often to estimate the vote for left-wing candidates in France, it actually performed less well than its variant—the proxy model—when we investigated its relative performance during the last 10 French presidential elections (tables 1 and 2). Given the remaining error from the proxy model, we hope that future research builds on this study and tests ways to improve its forecasts. One could use a measure of social unrest in the year preceding the election (e.g., Turgeon and Bélanger Reference Turgeon and Bélanger2017), or an indicator of the overall balance of Left–Right ideology in the electorate prior to the campaign (e.g., Bélanger and Lewis-Beck Reference Bélanger and Lewis-Beck2010), or rely on data disaggregated at the regional level (e.g., Foucault and Nadeau Reference Foucault and Nadeau2012). Future research also may examine second-order elections to obtain a better understanding of the extent to which the proxy model represents a more useful forecasting tool than the Iowa model.
Uncertainty Estimates and Confidence Intervals for the Iowa Model

Uncertainty Estimates and Confidence Intervals for the Proxy Model

DATA AVAILABILITY STATEMENT
Research documentation and data that support the findings of this study are openly available at the PS: Political Science & Politics Harvard Dataverse at https://doi.org/10.7910/DVN/ITAY0K.
CONFLICTS OF INTEREST
The authors declare that there are no ethical issues or conflicts of interest in this research.