Introduction
Violence has been considered in the past decades as a major and growing global public health problem (Rutherford et al., Reference Rutherford, Zwi, Grove and Butchart2007). Violence can be divided into three categories according to the identity of the perpetrator (i.e. self-directed, interpersonal, or collective) and into four categories according to its nature (i.e. physical, sexual, psychological, or involving deprivation or neglect) (Rutherford et al., Reference Rutherford, Zwi, Grove and Butchart2007). Violence may have a major impact not only on the perpetrator but also the victim. For example, in the case of domestic violence, victims are known to have a higher rate of psychiatric disorders (Afifi et al., Reference Afifi, MacMillan, Cox, Asmundson, Stein and Sareen2009) and physical chronic conditions (Ruiz-Pérez et al., Reference Ruiz-Pérez, Plazaola-Castaño and del Río-Lozano2007). Therefore, there is a need to identify risk factors for violence perpetration to mitigate the impact of violence at a societal level.
There has recently been a growing interest on intelligence or cognitive ability as a risk factor for violence perpetration. For example, individuals with low cognitive ability are at a particularly high risk for crime perpetration (Stattin and Klackenberg-Larsson, Reference Stattin and Klackenberg-Larsson1993; Fergusson et al., Reference Fergusson, Horwood and Ridder2005; Guay et al., Reference Guay, Ouimet and Proulx2005; Bartels et al., Reference Bartels, Ryan, Urban and Glass2010; Bellair and McNulty, Reference Bellair and McNulty2010; Diamond et al., Reference Diamond, Morris and Barnes2012; Frisell et al., Reference Frisell, Pawitan and Långström2012; Yun and Lee, Reference Yun and Lee2013; de Tribolet-Hardy et al., Reference de Tribolet-Hardy, Vohs, Mokros and Habermeyer2014; Gower et al., Reference Gower, Shlafer, Polan, McRee, McMorris, Pettingell and Sieving2014). Low cognitive ability may be associated with violence perpetration via low school performance, low job performance, lack of anticipation, and lack of empathy. Cognitive performance is often measured in terms of the intelligence quotient (IQ) (Deary and Batty, Reference Deary and Batty2007), a score which assesses different components of intelligence (i.e. verbal, numerical, spatial, or logical) (Lagerström et al., Reference Lagerström, Bremme, Eneroth and Janson1991). Previous studies have shown, for example, that violent crime is less frequent in regions with higher IQ (Bartels et al., Reference Bartels, Ryan, Urban and Glass2010; Beaver and Wright, Reference Beaver and Wright2011), or that adolescents with lower IQ are at higher risk for violent behavior, and that this association is particularly strong in non-disadvantaged neighborhoods, underlying the important role played by sociodemographic factors in this relationship (Bellair and McNulty, Reference Bellair and McNulty2010). Other authors have further reported that low IQ test scores in early adulthood are associated with an increased risk of death by homicide (Batty et al., Reference Batty, Deary, Tengstrom and Rasmussen2008), and that lower IQ has a significant impact on both suicide and suicide attempt (Gunnell et al., Reference Gunnell, Magnusson and Rasmussen2005; Sörberg et al., Reference Sörberg, Allebeck, Melin, Gunnell and Hemmingsson2013). On the other hand, serious fighting-related injuries are known to produce a significant reduction in IQ over time (Schwartz and Beaver, Reference Schwartz and Beaver2013).
Although previous studies focusing on the relationship between IQ and violence perpetration have advanced the field, there are some major limitations that should be mentioned. First, most of them only included small numbers of participants (Guay et al., Reference Guay, Ouimet and Proulx2005; de Tribolet-Hardy et al., Reference de Tribolet-Hardy, Vohs, Mokros and Habermeyer2014; Gower et al., Reference Gower, Shlafer, Polan, McRee, McMorris, Pettingell and Sieving2014) and were conducted among adolescents (Bellair and McNulty, Reference Bellair and McNulty2010; Gower et al., Reference Gower, Shlafer, Polan, McRee, McMorris, Pettingell and Sieving2014) or inmates (Guay et al., Reference Guay, Ouimet and Proulx2005; Diamond et al., Reference Diamond, Morris and Barnes2012), and only a few used nationally representative data (Bellair and McNulty, Reference Bellair and McNulty2010; Frisell et al., Reference Frisell, Pawitan and Långström2012). Second, previous studies have rarely adjusted for key factors such as psychiatric morbidity leaving room for residual confounding. Thus, the generalizability of the results of these studies is limited and the previously reported IQ–violence perpetration association may be potentially biased. Therefore, the goal of the present work was to examine the relationship between IQ and violence perpetration using nationally representative community-based data from the UK while adjusting for key confounders such as sociodemographic factors, childhood abuse, bullying, substance abuse, and common mental disorders. Given that there were 1.3 million violent crime incidents in this country in 2016 (Office for National Statistics, 2017), gaining a better understanding of potential risk factors for violence perpetration is needed to identify high-risk groups and to design preventive approaches and targeted interventions.
Methods
Study participants
This study used data from 7403 people who participated in the 2007 Adult Psychiatric Morbidity Survey (APMS). Full details of the survey have been published elsewhere (Jenkins et al., Reference Jenkins, Meltzer, Bebbington, Brugha, Farrell, McManus and Singleton2009; McManus et al., Reference McManus, Meltzer, Brugha, Bebbington and Jenkins2009). Briefly, this was a nationally representative survey of the English adult population (aged ⩾16 years) living in private households. The National Center for Social Research and Leicester University undertook the survey fieldwork in October 2006 to December 2007 using a multistage stratified probability sampling design where the sampling frame consisted of the small user postcode address file, while the primary sampling units were postcode sectors. Participant information was obtained through face-to-face interviews where some of the questionnaire items were self-completed (with the use of a computer). Sampling weights were constructed to account for non-response and the probability of being selected so that the sample was representative of the English adult household population. The survey response rate was 57%. Ethical permission for the study was obtained from the Royal Free Hospital and Medical School Research Ethics Committee. All participants provided informed consent before their inclusion.
Measures
Intelligence quotient
Verbal IQ was estimated using the National Adult Reading Test (NART). The NART, a brief measure administered only to native English speakers and widely used in the world, consists of a list of 50 words and is scored by counting the number of errors made in reading out the words (Ali et al., Reference Ali, Ambler, Strydom, Rai, Cooper, McManus, Weich, Meltzer, Dein and Hassiotis2013). The reliability of the NART has been assessed by a split-half technique (Cronbach α) which gave a reliability coefficient of 0.93 compared with the Wechsler Adult Intelligence Scale (WAIS) (Nelson and Willison, Reference Nelson and Willison1991). Previous research has also shown that NART scores are largely unaffected by psychiatric and neurological disorders, underlying the interest of this test in the context of the 2007 APMS (Rai et al., Reference Rai, Hall, Bebbington, Skapinakis, Hassiotis, Weich, Meltzer, Moran, Brugha, Strydom and Farrell2014). There were 531 participants who were not administered the test (e.g. English not their first language, eyesight problems, dyslexia, or refusal). The scores ranged from 70 to 130 and this variable was analyzed as a continuous variable (scores based on standard deviations) or as a categorical variable (six-category: 70–79, 80–89, 90–99, 100–109, 110–119, and 120–129) in line with previous publications using the same dataset (Ali et al., Reference Ali, Ambler, Strydom, Rai, Cooper, McManus, Weich, Meltzer, Dein and Hassiotis2013; Rai et al., Reference Rai, Hall, Bebbington, Skapinakis, Hassiotis, Weich, Meltzer, Moran, Brugha, Strydom and Farrell2014). Verbal IQ is referred to as IQ in this manuscript for the sake of brevity.
Violence perpetration
Participants were asked ‘Have you been in a physical fight or deliberately hit anyone in the past 5 years?’ with ‘yes’ and ‘no’ answer options, and the number of violence episodes per individual was measured. For those who replied affirmatively, additional questions were asked regarding potential intoxication during the violent episode, persons who were involved in the violent episode (spouse or partner, girlfriend or boyfriend, children, other family member, friend, other known person, stranger, police, or others), the location where the violent episode took place (home, someone else's home, street or outdoors, bar or pub, workplace, hospital, or anywhere else), and the consequences of the violent episode (self-injury, self-injury with general practitioner involved, self-injury with hospital involved, other injured, or police involved). These questions have already been used to assess violence in previous APMS studies (González et al., Reference González, Kallis and Coid2013, Reference González, Igoumenou, Kallis and Coid2016; Davoren et al., Reference Davoren, Kallis, González, Freestone and Coid2017).
Control variables
The control variables were selected based on past literature (Stattin and Klackenberg-Larsson, Reference Stattin and Klackenberg-Larsson1993; Fergusson et al., Reference Fergusson, Horwood and Ridder2005; Guay et al., Reference Guay, Ouimet and Proulx2005; Bartels et al., Reference Bartels, Ryan, Urban and Glass2010; Bellair and McNulty, Reference Bellair and McNulty2010; Diamond et al., Reference Diamond, Morris and Barnes2012; Frisell et al., Reference Frisell, Pawitan and Långström2012; Yun and Lee, Reference Yun and Lee2013; de Tribolet-Hardy et al., Reference de Tribolet-Hardy, Vohs, Mokros and Habermeyer2014; Gower et al., Reference Gower, Shlafer, Polan, McRee, McMorris, Pettingell and Sieving2014).
Sociodemographic variables. These included sex, age, British white (yes and no), and marital status (married/cohabiting or single/widowed/divorced/separated) (Jacob et al., Reference Jacob, Haro and Koyanagi2018a, Reference Jacob, Haro and Koyanagi2018b).
Lifetime bullying. Those who claimed to have been bullied at any time in life were considered to have experienced bullying (Bentall et al., Reference Bentall, Wickham, Shevlin and Varese2012).
Childhood sexual abuse. This was assessed with the question ‘Before the age of 16, did anyone have sexual intercourse with you without your consent?’ with ‘yes’ or ‘no’ answer options.
Childhood physical abuse. This was assessed with the question ‘Before the age of 16, were you ever severely beaten by a parent, step-parent, or carer?’ with ‘yes’ or ‘no’ answer options.
Smoking status. Participants were asked about their smoking status and were classified as never smokers (never) and past or current smokers (quit/current) (Jacob et al., Reference Jacob, Haro and Koyanagi2018c).
Alcohol dependence. Excessive alcohol consumption was screened using the Alcohol Use Disorders Identification Test (AUDIT) (Saunders et al., Reference Saunders, Aasland, Babor, de la Fuente and Grant1993). Alcohol dependence was assessed with the Severity of Alcohol Dependence Questionnaire (SADQ-C) in participants with an AUDIT score of 10 or above (Stockwell et al., Reference Stockwell, Sitharthan, McGrath and Lang1994). Scores of four or above indicated alcohol dependence in the past 6 months.
Drug use. Each individual was asked if he/she had used in the past year one of the following drugs: cannabis, amphetamines, cocaine, crack, ecstasy, heroin, acid or LSD, magic mushrooms, methadone or physeptone, tranquilizers, amyl nitrate, anabolic steroids, and glues. Those who claimed to have used at least one of these drugs were considered to be drug users.
Common mental disorders. Common mental disorders were assessed using the Clinical Interview Schedule Revised (CIS-R), and referred to depressive episode and/or anxiety disorders (generalized anxiety disorder, panic disorder, phobia, and obsessive–compulsive disorder) in the prior week (Stickley and Koyanagi, Reference Stickley and Koyanagi2016).
Statistical analyses
Sample characteristics by IQ scores categorized in six groups using the overall sample are presented. In addition, the characteristics of violence by IQ scores (three groups) only among perpetrators of violence are illustrated. In the latter, we only used three IQ score groups to obtain more stable estimates as the sample size was smaller. Trends in the sample characteristics by IQ scores were tested with Cochran–Armitage tests for categorical variables and Jonckheere–Terpstra tests for continuous variables. We conducted a logistic regression analysis to assess the association between IQ [exposure variable: continuous (scores based on standard deviations) and six-category variable] and violence perpetration (outcome variable). Using the six-category IQ variable, we constructed two models to assess the influence of the inclusion of different variables in the models: model 1 – adjusted for sex, age, and ethnicity; model 2 (fully adjusted model) – adjusted for factors in model 1 and marital status, lifetime bullying, childhood sexual abuse, childhood physical abuse, smoking status, alcohol dependence, drug use, and common mental disorders. We also used the standardized continuous IQ variable to assess the association between a −1s.d. decrease in IQ and violence perpetration after full adjustment. Interaction by sex, age, and ethnicity was also assessed by including interaction terms of ‘IQ × sex’, ‘IQ × age’, and ‘IQ × ethnicity’ in the fully adjusted models. All variables in the regression analyses were categorical variables with the exception of the IQ variable when used as a continuous variable and age. The sample weighting and the complex study design were taken into account in all analyses. The level of statistical significance was set at p < 0.05. All analyses were performed with Stata version 14.1 (Stata Corp LP, College Station, Texas, USA).
Results
Sample characteristics
There were 6872 participants aged ⩾16 years included in the current analysis. The mean (s.d.) age was 46.3 (18.6) years and 48.2% were men (Table 1). The prevalence [95% confidence interval (CI)] of violence was 8.8% (8.0–9.6%), and 8.7, 12.3, 21.1, 19.4, 25.4, and 13.1% of the individuals had an IQ of 70–79, 80–89, 90–99, 100–109, 110–119, and 120–129, respectively. The mean (s.d.) of the IQ score was 102 (15). Trends in the sample characteristics by IQ scores were significant for all variables except lifetime bullying and smoking status.
Sample characteristics [overall and by intelligence quotient (IQ) scores]

IQ was assessed using the National Adult Reading Test (NART).
a The p-trends were based on Cochran–Armitage tests for categorical variables and Jonckheere–Terpstra tests for continuous variables.
Prevalence of violence perpetration, mean number of violent episodes, and characteristics of violence by IQ score
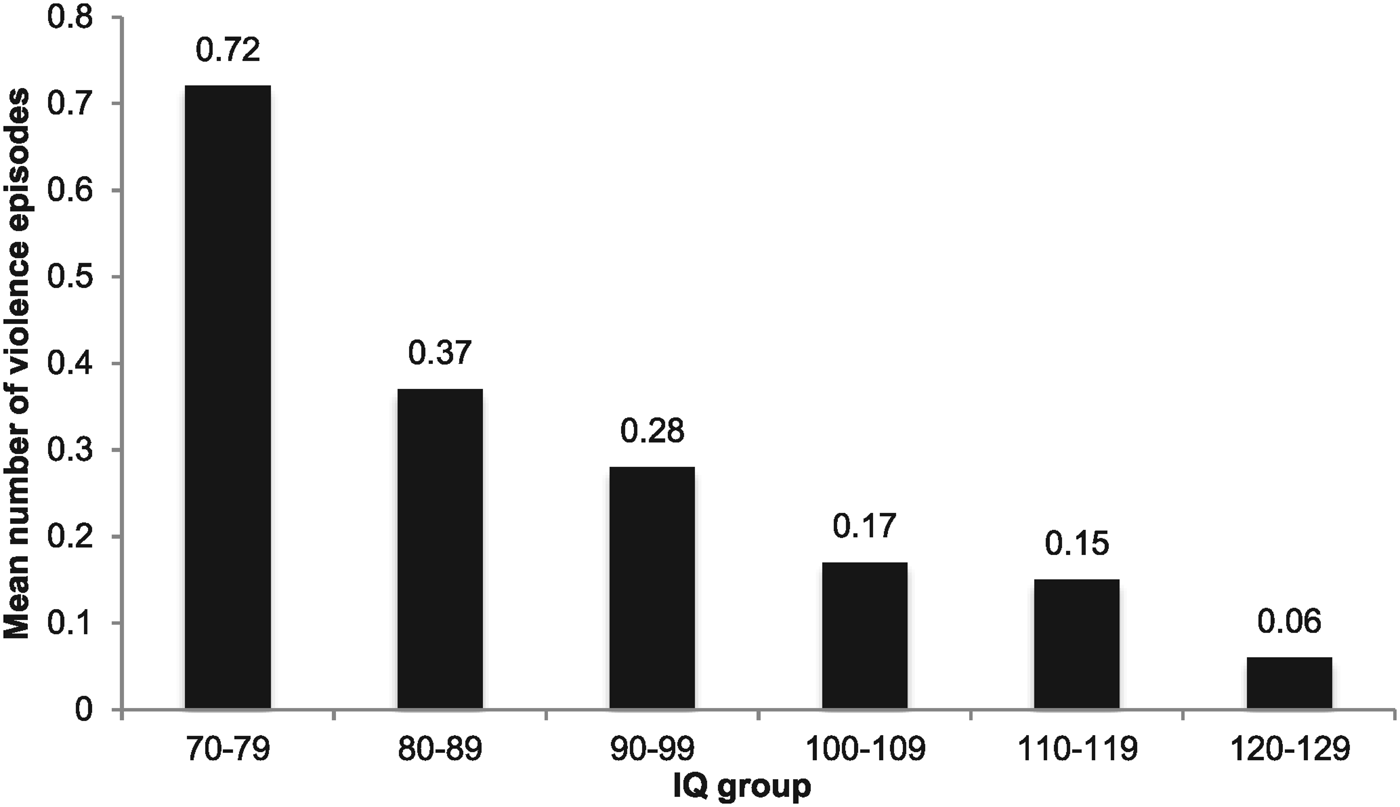
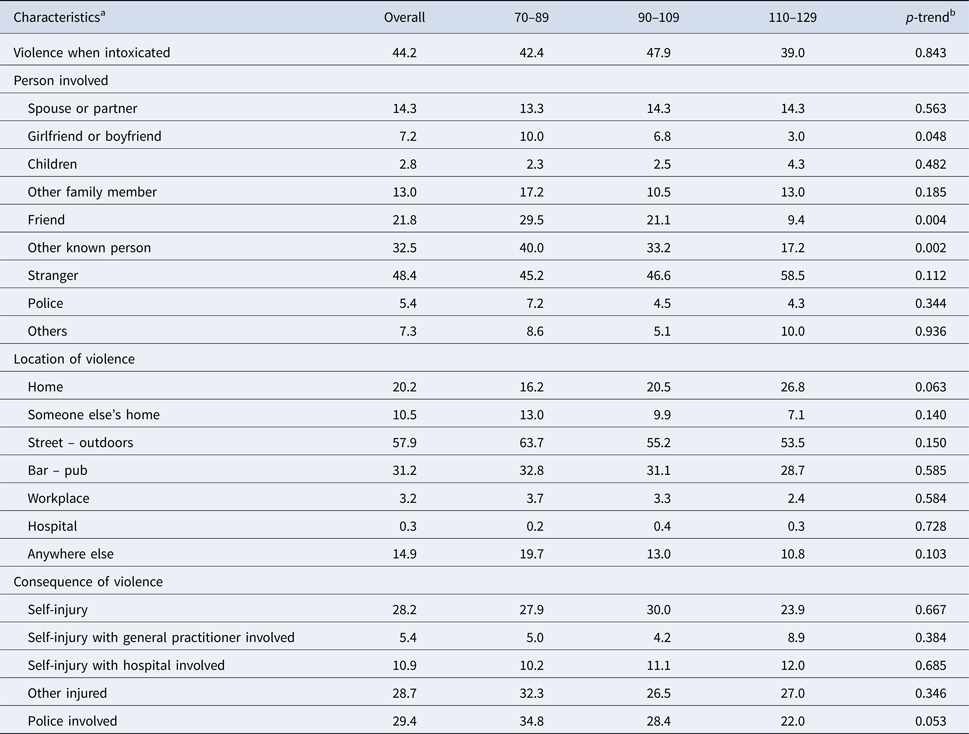
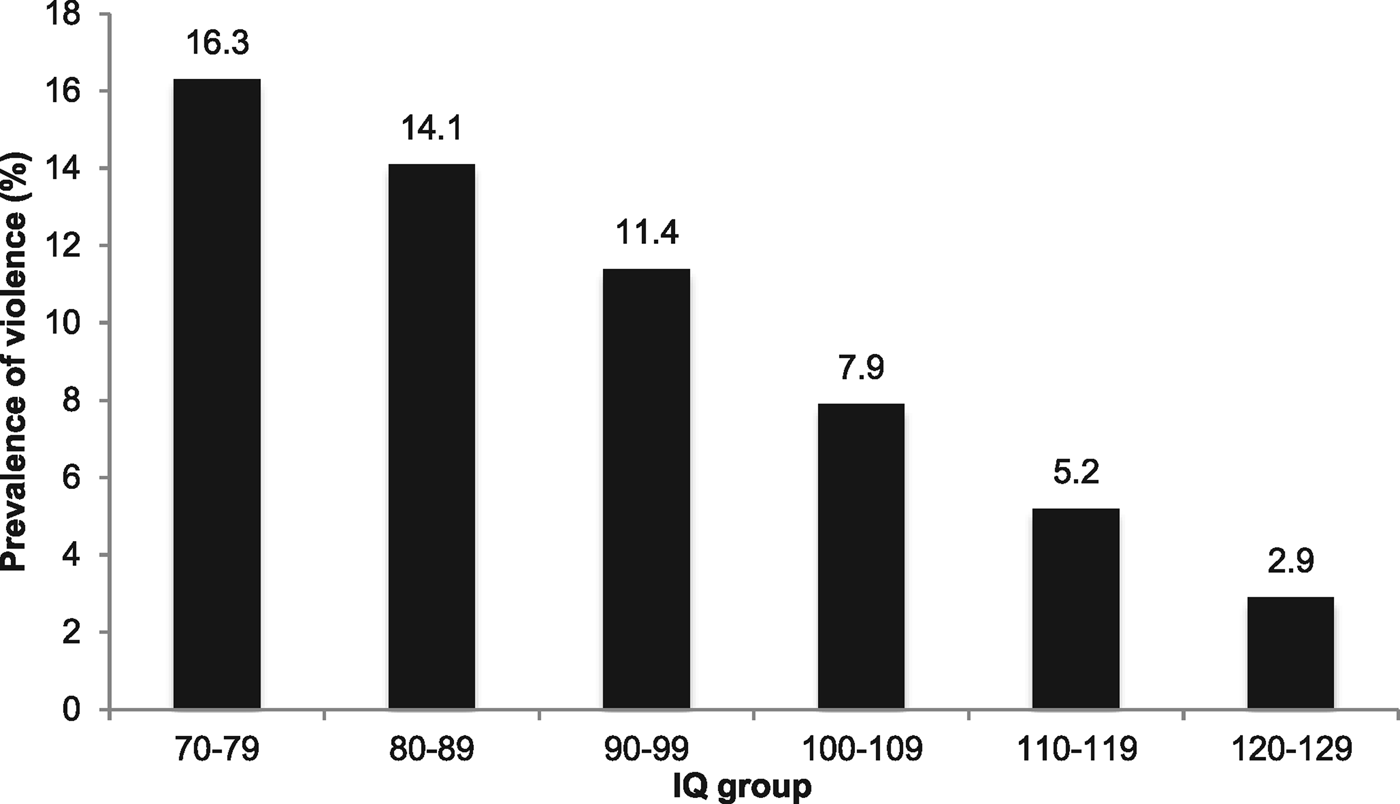
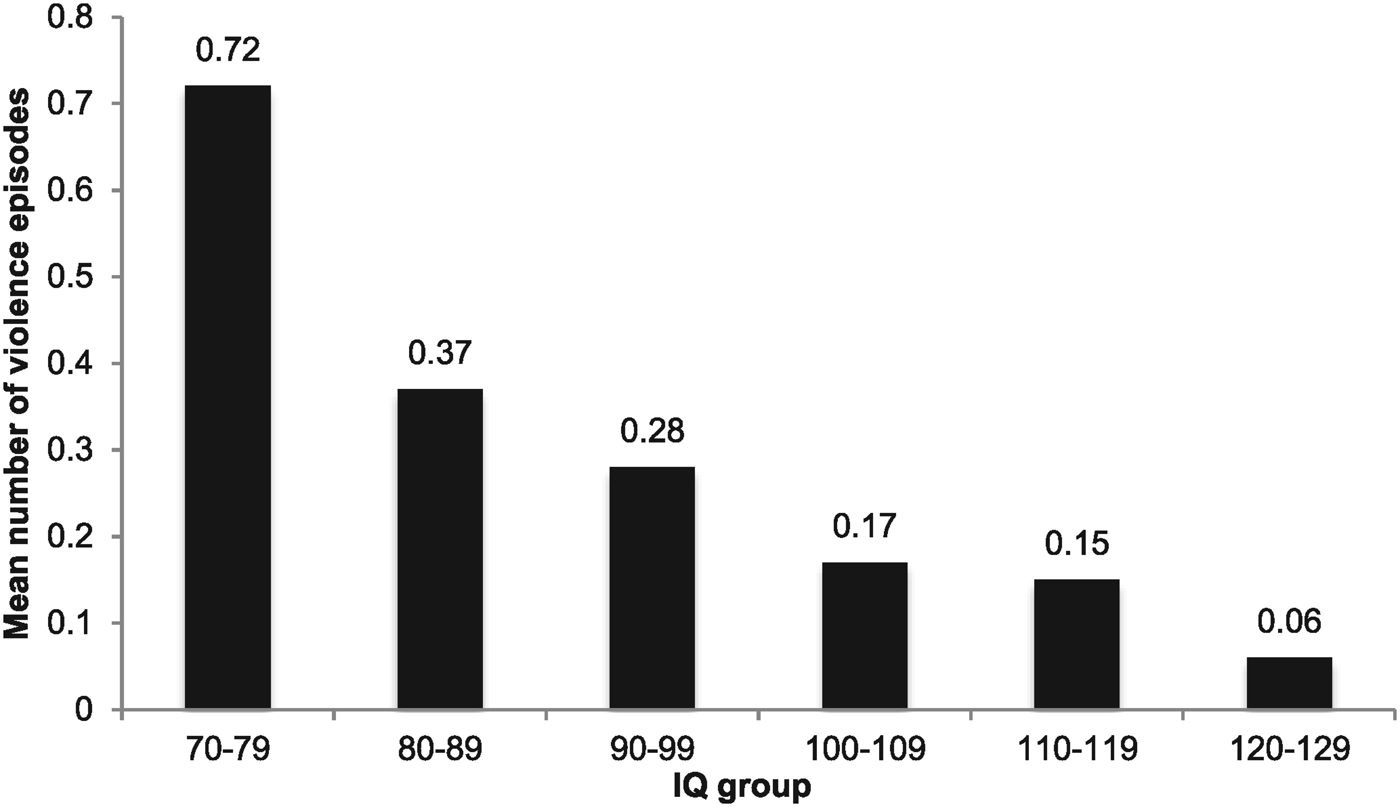
The prevalence of violence perpetration decreased from 16.3% in the IQ 70–79 group to 2.9% in the IQ 120–129 group (Fig. 1), while the mean number of violent episodes decreased from 0.72 (IQ 70–79) to 0.06 (IQ 120–129) (Fig. 2). The characteristics of violence by IQ scores are displayed in Table 2. There was a significant trend for those with lower IQ scores to be more likely to be violence perpetrators when the person involved was a girlfriend or boyfriend, friend, and other known person.
Prevalence of violence perpetration by intelligence quotient (IQ) score. IQ was assessed using the National Adult Reading Test (NART). Violence perpetration was assessed with the following question: ‘Have you been in a physical fight or deliberately hit anyone in the past 5 years?’.
Mean number of violence episodes by intelligence quotient (IQ) status. IQ was assessed using the National Adult Reading Test (NART). Violence perpetration was assessed with the following question: ‘Have you been in a physical fight or deliberately hit anyone in the past 5 years?’. The number of violence episodes was assessed over the past 5 years.
Characteristics of violence [overall and by intelligence quotient (IQ) scores]

IQ was assessed using the National Adult Reading Test (NART).
Violence was assessed with the following question: ‘Have you been in a physical fight or deliberately hit anyone in the past 5 years?’.
a The analysis was restricted to participants who were perpetrators of violence.
b The p-trends were based on Cochran–Armitage tests.
Association between IQ score and violence perpetration
The results of the multivariable regression model are shown in Fig. 3. After adjusting for age, sex, and ethnicity, compared with those with IQ scores of 120–129, scores of 110–119, 100–109, 90–99, 80–89, and 70–79 were associated with 1.12 (95% CI 0.65–1.92), 1.77 (95% CI 1.05–2.97), 1.84 (95% CI 1.09–3.10), 2.34 (95% CI 1.35–4.01), and 2.29 (95% CI 1.31–4.01) times higher odds for violence perpetration, respectively (model 1). Similar findings were obtained in the model further adjusted for marital status, behavioral factors, childhood adversity, and psychiatric morbidity (model 2) with the corresponding figures being 1.07 (95% CI 0.63–1.84), 1.90 (95% CI 1.12–3.22), 1.80 (95% CI 1.05–3.13), 2.36 (95% CI 1.32–4.22), and 2.25 (95% CI 1.26–4.01). A 1s.d. decrease in IQ was associated with a 1.32 (95% CI 1.17–1.49) times higher odds for violence perpetration based on the fully adjusted model (data shown only in text). Furthermore, there were no significant interactions by sex, age, and ethnicity in the association between IQ and violence perpetration (data not shown).
Association between intelligence quotient (IQ) and violence perpetration estimated by multivariate logistic regression. OR, odds ratio; CI, confidence interval. Reference category is IQ 120–129. (a) Model 1: adjusted for sex, age, and ethnicity. (b) Model 2: adjusted for sex, age, ethnicity, marital status, lifetime bullying, childhood sexual abuse, childhood physical abuse, smoking status, alcohol dependence, drug use, and common mental disorders.

Discussion
Main findings
We found that both the prevalence of violence perpetration and the mean number of violent episodes decreased with increasing IQ scores among individuals aged ⩾16 years in the UK. In addition, even after adjusting for demographic and behavioral factors, childhood adversity, and psychiatric morbidity, low IQ was associated with significantly higher odds for violence perpetration with an IQ <90 being associated with more than a two times higher odds for violence perpetration compared with those with IQ 120–129. The strength of the study includes the large sample size, the use of nationally representative data, and the inclusion of a variety of potential confounders in the analysis. To the best of our knowledge, this is the first study to investigate the relationship between cognitive ability and violent behavior with nationally representative data in the UK population.
Interpretation of the findings
The IQ–violence perpetration association has been the center of attention for many years, and the causal relationship between cognitive ability and violent behavior has been a subject of debate (Frisell et al., Reference Frisell, Pawitan and Långström2012). Some authors have suggested that this association is spurious and that it is unlikely that IQ is a causal factor for violence, since IQ itself can be a potential consequence of conduct disorders, low education, or poor motivation during the evaluation of IQ (Frisell et al., Reference Frisell, Pawitan and Långström2012). Nonetheless, this hypothesis has recently been invalidated by several studies especially of longitudinal design. For example, researchers from Sweden found in 122 boys followed between the age of 3 and 17 that intelligence at a very young age had an impact on future criminal behavior (Stattin and Klackenberg-Larsson, Reference Stattin and Klackenberg-Larsson1993). It was further highlighted in the same study that early language retardation played a major role in the future risk of violence. Later, Fergusson et al. corroborated these findings, showing that IQ at age 8–9 years was related to a wide range of outcomes (i.e. crime, substance use disorders, mental health, or sexual adjustment), with these associations being mediated by childhood conduct problems and family social circumstances (Fergusson et al., Reference Fergusson, Horwood and Ridder2005). Interestingly, Gower et al. conducted similar analyses in a sample of 253 adolescent girls, and discovered that the odds of violence perpetration might be reduced in participants with social emotional intelligence and stress management skills (Gower et al., Reference Gower, Shlafer, Polan, McRee, McMorris, Pettingell and Sieving2014). Taking these results together, it is likely that there is a causal relationship between cognitive ability and violence.
There are two main hypotheses to explain how low IQ may lead to violence perpetration. First, IQ is significantly associated with school performance, job performance, adaptation, and integration in the society (Frisell et al., Reference Frisell, Pawitan and Långström2012). In line with this hypothesis, a longitudinal study of 1919 Estonian schoolboys found that the contribution of cognitive ability to antisocial behavior was significantly accounted for by school grades (Mõttus et al., Reference Mõttus, Guljajev, Allik, Laidra and Pullmann2012). Another work conducted by McGloin et al. further estimated that school performance is involved in the IQ–violence perpetration relation, but also suggested that peer pressure and self-control might be two major additional mediators (McGloin et al., Reference McGloin, Pratt and Maahs2004). Second, a lack of anticipation and a lack of empathy are frequently described in individuals with low IQ (Frisell et al., Reference Frisell, Pawitan and Långström2012). Of particular interest is the meta-analysis by Jolliffe and Farrington showing that the relationship between low empathy and offending did not remain significant after adjusting for intelligence (Jolliffe and Farrington, Reference Jolliffe and Farrington2004). Other works have also highlighted the importance of high-quality programs aiming at the increase of offenders’ ability to understand and express empathy toward victims in order to reduce their risk of recidivism (Freeman, Reference Freeman2012).
Clinical implications and directions for future research
Before going further, one has to bear in mind that intelligence is not frequently assessed in the general population, while IQ is generally considered to be a non-modifiable risk factor. Thus, preventive programs in this setting are very difficult to implement. That being said, in some settings, IQ is often measured in children with abnormal development or difficulties at school, or individuals with psychiatric disorders. Based on the findings of the present study, it is important to note that people with low IQ may be at high risk of violence perpetration in the future or that low IQ may be an underlying factor in individuals who frequently engage in violence. Therefore, individuals with low cognitive ability should be regularly followed and several actions should be proposed throughout their life. For example, an education development program might be interesting at young age in order to improve the performance of children with low IQ at school. Academic alternatives might further be proposed to adolescents who failed at school or repeated school years multiple times, and professionalizing training could help them find their path. Follow-up of these individuals may not only help reduce violence but also other adverse outcomes which are known to be associated with low IQ such as obesity (Chandola et al., Reference Chandola, Deary, Blane and Batty2006), alcohol consumption (Sjölund et al., Reference Sjölund, Hemmingsson and Allebeck2015), and common mental disorders (Koenen et al., Reference Koenen, Moffitt, Roberts, Martin, Kubzansky, Harrington, Poulton and Caspi2009). In addition, we believe that the development of recreational activities is important for the societal integration of individuals with low IQ. Programs favoring the development of empathy and sensitivity might also help reduce the risk of recidivism in individuals who have already committed violent crimes. Further research is necessary to evaluate the impact of these different actions on the risk of violence perpetration in people with low cognitive abilities. Our study also highlights the importance of interventions across the lifespan given that the mean age of our sample was around 46 years, and that there was no significant interaction by age, while violence is also frequent in older individuals (Warmling et al., Reference Warmling, Lindner and Coelho2017).
Strength and limitations
The large sample size and the use of nationally representative data are the two major strengths of this study. In addition, the use of a single question to measure violence is likely to have facilitated the identification of this act even in individuals with low IQ and may have been more ideal than complex questionnaires. However, since the NART was used to assess IQ, and since it requires good understanding of English, we might have underestimated IQ in people with low education. Furthermore, the NART allows the investigation of verbal IQ only and lacks other aspects such as numerical, spatial, or logical components (Lagerström et al., Reference Lagerström, Bremme, Eneroth and Janson1991). Another limitation is that we only had access to violence in the past 5 years. Therefore, our estimates of violence might have been biased. One has to also bear in mind that, even if the assessment of violence was appropriate for individuals with low IQ, it remains possible that they overestimated violence. Finally, although we believe that recent violent behavior is unlikely to affect IQ, the cross-sectional design of this analysis prevents us from drawing conclusions about causality of the IQ–violence perpetration relationship.
Conclusion
Overall, lower IQ was associated with violence perpetration in the UK general population. Future studies are warranted to understand the mechanisms that link low IQ and violence perpetration, and to assess whether implementation of interventions are possible for this high-risk group.
Acknowledgements
The authors would like to thank the National Center for Social Research and the University of Leicester who were the Principal Investigators of this survey. In addition, the authors would also like to thank the UK Data Archive, the National Center for Social Research, and other relevant bodies for making these data publically available. They bear no responsibility for this analysis or interpretation of this publically available dataset.
Author contributions
Louis Jacob and Ai Koyanagi designed the study, managed the literature searches and analyses, undertook the statistical analysis, and wrote the first draft of the manuscript. Josep Maria Haro contributed to the design of the study and the correction of the manuscript. All authors contributed to and have approved the final manuscript.
Financial support
Ai Koyanagi's work is supported by the Miguel Servet contract financed by the CP13/00150 and PI15/00862 projects, integrated into the National R + D + I and funded by the ISCIII – General Branch Evaluation and Promotion of Health Research – and the European Regional Development Fund (ERDF-FEDER). These funders had no role in: the study design, collection, analysis, and interpretation of the data; writing of the report; and the decision to submit the article for publication.
Conflict of interest
None.