

Using interest inventories is an inseparable part of the career counselling process (Zunker, Reference Zunker1990) and is considered one of the most important and durable contributions to counselling psychology (Betz & Borgen, Reference Betz and Borgen2000); this may be because occupational entry can be better predicted from interests than from aptitudes (Sharf, Reference Sharf2002). According to Holland (Reference Holland1997, Reference Holland, Savickas and Spokane1999), interest inventories are personality inventories as well, since he believed that vocational interests reflect the expression of personality in work, school subjects, hobbies, recreational activities, and preferences. Interest inventories are generally used for the exploration of career interests, abilities and values, and integrate this information with desirable characteristics within the world of work (Hansen, Reference Hansen, Brown and Lent2005). One advantage of using an interest inventory is that it is a tool that enables clients to expand their interests by channelling and encouraging them into activities related to expressed interests that are based on limited past experience (Krumboltz, Reference Krumboltz, Savickas and Walsh1996).
Previous research on the effectiveness of interest inventory interpretation has shown that students who participated in an interpretation process increased their social cognitive career beliefs and their understanding that they are personally responsible for their career development and that working hard at career decision-making is an essential component of career-related satisfaction and success (Luzzo & Day, Reference Luzzo and Day1999), as well as their efficacy in their self-knowledge of personality and cognitive functioning (Krieshok, Ulven, Hecox, & Wettersten, Reference Krieshok, Ulven, Hecox and Wettersten2000), specificity and certainty of career goals (Katz, Joyner, & Seaman, Reference Katz, Joyner and Seaman1999), and efficacy in career decision-making tasks (Breeding, Reference Breeding2008; Luzzo & Day, Reference Luzzo and Day1999; Uffelman, Subich, Diegelman, Wagner, & Bardash, Reference Uffelman, Subich, Diegelman, Wagner and Bardash2004).
Despite research and theory demonstrating interest inventory feedback to be effective in increasing career-related variables, there has been little work examining its effectiveness on specific career constructs such as career indecision, career decision difficulties, or career decision self-efficacy. In one notable exception, Luzzo and Day (Reference Luzzo and Day1999) evaluated the effectiveness of group feedback on the Strong Interest Inventory by comparing a feedback group, an only-inventory-completion group, and a no-treatment control group. As part of the group feedback, the participants were distributed their interest profile reports and given time to look over them. The participants then watched a 19-minute video that included the definitions and examples of six of Holland's (Reference Holland1997) codes (Realistic, Investigative, Artistic, Social, Enterprising, and Conventional) and related occupational themes. The participants had the opportunity to ask questions about the video and their own profile reports during the video presentation. Even though their intervention was very brief, Luzzo and Day (Reference Luzzo and Day1999) concluded that the use of a group interpretation strategy on an interest inventory was effective in increasing participants’ career decision self-efficacy, as well as their beliefs that they were personally responsible for their career success and that they could achieve this success by working hard.
In another example, Uffelman et al. (Reference Uffelman, Subich, Diegelman, Wagner and Bardash2004) used four groups (Self-Directed Search completion and one session interpretation, Self-Directed Search completion and two sessions of process-oriented interpretation, Strong Interest Inventory completion and one session interpretation, and a no-treatment control group) to assess the effect of mode of interest assessment on career decision self-efficacy. The results of this study indicated that all three active treatment groups exhibited significant increases in career decision self-efficacy, showing that interpretation sessions were effective in general, whereas no significant gains were seen for the no-treatment control group. However, contrary to their expectations that greater counsellor contact within the process-oriented interpretation group would lead to greater increases, gains in career decision self-efficacy did not differ significantly among the three active treatment groups. In the light of their findings, Uffelman et al. (Reference Uffelman, Subich, Diegelman, Wagner and Bardash2004) suggested that further research would be needed to compare groups receiving counsellor interaction and interpretation with a truly counsellor-free assessment.
Self-efficacy — specifically, career decision self-efficacy — is one the most studied constructs in the career development and counselling literature (Choi et al., Reference Choi, Park, Yang, Lee, Lee and Lee2012). This stems from the general social cognitive theory of Bandura (Reference Bandura1977, Reference Bandura1986, Reference Bandura1997). According to Bandura (Reference Bandura1995), self-efficacy can influence an individual's decisions, emotions, level of effort, and persistence over obstacles, and consequently, the individual's performance. It is therefore a significant construct to consider and understand, and has received much attention from many researchers. These beliefs also play a crucial role in a person's life, since they predict career interests, career goals, career choices and performance (Lent, Brown, & Hackett, Reference Lent, Brown and Hackett1994, Reference Lent, Brown, Hackett and Brown2002).
Taylor and Betz (Reference Taylor and Betz1983) further defined the term career decision self-efficacy as a belief that people can successfully complete various tasks necessary to making career decisions. These tasks are accurate self-appraisal, gathering occupational information, goal selection, planning for the future, and problem solving, as highlighted by Crites's (Reference Crites1961, Reference Crites1976) model of vocational maturity. Completing these tasks successfully, therefore, leads to higher levels of career decision self-efficacy.
Previous research has indicated that higher career decision self-efficacy is associated with higher levels of career adjustment (Betz & Luzzo, Reference Betz and Luzzo1996; Chung, Reference Chung2002), career maturity (Patton & Creed, Reference Patton and Creed2001), career exploration behaviour (Blustein, Reference Blustein1989; Rogers, Creed, & Glendon, Reference Rogers, Creed and Glendon2008), college satisfaction (DeWitz & Walsh, Reference DeWitz and Walsh2002), self-esteem (Betz & Klein, Reference Betz and Klein1996; Creed, Muller, & Patton, Reference Creed, Muller and Patton2003; Creed, Patton, & Bartrum, Reference Creed, Patton and Bartrum2004), lower levels of career indecision (Bergeron & Romano, Reference Bergeron and Romano1994; Betz, Hammond, & Multon, Reference Betz, Hammond and Multon2005; Betz, Klein, & Taylor, Reference Betz, Klein and Taylor1996; Srsic & Walsh, Reference Srsic and Walsh2001), and trait anxiety (Gati et al., Reference Gati, Gadassi, Saka, Hadadi, Ansenberg, Friedman and Asulin-Peretz2011; Gloria & Hird, Reference Gloria and Hird1999; Işık, Reference Işık2012). Most experimental research aimed at increasing career decision self-efficacy has examined long-term interventions, lasting at least 6 to 10 weeks or one semester (Di Fabio & Maree, Reference Di Fabio and Maree2012; Fouad, Cotter, & Kantamneni, Reference Fouad, Cotter and Kantamneni2009; Koivisto, Vinokur, & Vuori, Reference Koivisto, Vinokur and Vuori2011; Reese & Miller, Reference Reese and Miller2006; Scott & Ciani, Reference Scott and Ciani2008; Sullivan & Mahalik, Reference Sullivan and Mahalik2000). Although brief career interventions have been found effective in many studies (Brown & Krane, Reference Brown, Krane, Brown and Lent2000; Bullock-Yowell et al., Reference Bullock-Yowell, McConnell, Rushing, Andrews, Campbell and Osborne2014; Chronister, Linville, & Kaag, Reference Chronister, Linville and Kaag2008; Chronister & McWhirter, Reference Chronister and McWhirter2006) and are less time consuming and may allow career counselling resources to reach more people, little research has been documented (Bullock-Yowell et al., Reference Bullock-Yowell, McConnell, Rushing, Andrews, Campbell and Osborne2014). Thus, this study would provide significant evidence for the existing literature on brief interventions in career counselling and development.
In their meta-analytic work, Brown and Krane (Reference Brown, Krane, Brown and Lent2000) concluded that career interventions are more effective if participants: (a) clarify their goals in writing; (b) receive individual interpretation reports and feedback; (c) obtain current career information; (d) are exposed to role models; and (e) develop support networks that ease their pursuit of career goals. According to these results, clarifying career goals and receiving individual interpretations and feedback are the most essential parts of effective career programs. In another meta-analysis, Ryan (Reference Ryan1999) found that all career interventions were effective and that the most effective methods of improving career development of clients were through group counselling, followed by career interventions and individual counselling.
In response to Uffelman et al.'s (2004) call for further research to compare groups (including counsellor interaction and interpretation with a truly counsellor-free assessment), as well as previous studies’ suggestions that replication of career interventions is critical to a confident generalisation to other populations and cultures (Gainor, Reference Gainor2006), and in order to expand the literature on brief career interventions, the aim of this study was to explore the effect of a brief interest inventory intervention on career decision self-efficacy in a sample of undergraduate students. With this aim, the current study used an experimental design to test that the completion of an interest inventory and the provision of feedback after the completion increases undergraduate students’ career decision self-efficacy. Based on previous studies (Luzzo & Day, Reference Luzzo and Day1999; Uffelman et al., Reference Uffelman, Subich, Diegelman, Wagner and Bardash2004), it was hypothesised that both treatment conditions would be effective in increasing career decision self-efficacy when compared with a no-treatment control group, but that the feedback group would show greater gains in career decision self-efficacy.
Method
Participants and Procedure
The participants were 60 undergraduate freshmen (27 male, 33 female) from a large state university in the central Anatolia region. They ranged in age from 17 to 21 years (mean age = 18.71 years, SD = 1.02). Participants for both treatment and control groups were recruited in three steps: First, a total of 243 students completed the Career Decision Self-Efficacy Scale–Short Form (CDSE–SF) and were asked to declare their career decision status. Next, an interview with the group facilitator (the author) was arranged with students who reported being undecided about career and had similar career decision self-efficacy scores; informed consent was obtained during this interview. Finally, volunteer participants were randomly and equally assigned (n = 20 for each group) to either an experimental group (inventory with feedback or inventory-only) or the control group (no inventory or feedback) using a random numbers table. The age and sex distributions of each group were similar. All participants assigned to the feedback group were met in three different small groups and followed the interest inventory intervention protocol described next. All participants in the inventory-only group met with the counsellor for one 60-minute group session and discussed their future career goals, but did not receive any feedback on their interest inventory results. Participants in the control group met the counsellor for one 60-minute session of group activity and discussed their adjustment to university life.
Participants received no incentives but were informed that their participation would help them make a better career plan and decrease their uncertainty about what career they would pursue. The CDSE–SF scores taken for the inclusion criteria were assessed as the pretest and all the groups were separately appointed and completed the CDSE–SF as the posttest 1 week after the completion of the treatment.
Intervention
The intervention consisted of two 90-minute small-group sessions (consisting of six or seven students each) and required only an interest inventory package, paper, and pencils. The intervention incorporated guidelines by Zytowski (Reference Zytowski, Savickas and Spokane1999), Uffelman et al. (Reference Uffelman, Subich, Diegelman, Wagner and Bardash2004), and Özyürek (Reference Özyürek2006), which highlighted the steps and principles for successfully interpreting interest inventory profile scores. Prior to the sessions, all participants in the feedback group were given their profiles and told to look over them.
In the first session, participants and the counsellor worked on the profile reports, their meaning, and categorisation. The counsellor tried to build rapport by asking students how they felt about being in the session and initiating a discussion on students’ career-related interests, abilities, and values. After the participants expressed their feelings, they started to work on their profiles. First, the counsellor explained the meaning of the scale scores and percentages and made sure that all the participants understood these. Next, the meanings of low-flat, high-flat, and well-differentiated profiles were discussed and participants were asked to share their profile types and their possible explanations of their profiles with other group members. Within the group discussions, the counsellor asked the participants what their results meant to them, and if these results were consistent with their self-perceived interests, abilities, values, and their prior academic or work experiences. Consistencies and inconsistencies were clarified through group discussions, in which participants outlined a brief academic and vocational history by indicating their task mastery experiences. They also shared their personal strengths and weaknesses, perceived career barriers (e.g., sex stereotypes, socioeconomic status), and similarities and differences in their interests, skills or career choices with other group members. The first session ended with the counsellor's explanation of an out-of-group homework assignment, for which participants were asked to generate five career alternatives relative to their test results.
In the second session, the counsellor began with a brief review of what had been done in the previous session and a small discussion on the homework assignment. After having the participants share their feelings with the group, the counsellor gave some information about Holland's (Reference Holland1997) theory of vocational personalities and work environments, six personality types, the hexagonal relationships of these types, the type coding system, and the consistency levels of these codes. The counsellor then asked the participants to rank order their top three types. The counsellor and participants together discussed the consistency levels of these codes, their correspondence with the categorisation of the Interest Inventory used, and whether there were more congruent alternatives. Finally, participants were asked what they planned to do next, and what immediate and intermediate steps they would take in order to reach their career goals. The session ended with a round-table exercise where participants each expressed their feelings about the interpretation process and the counsellor's explanations about how they could use the information from the sessions in their career decision-making process. Throughout the sessions, participants were given positive and constructive feedback and encouraged to ask questions when they needed help, as well as to comment on their results in their own words in order to help them understand their views of themselves.
Instruments
Career Decision Self Efficacy Scale — Short Form (CDSES–SF)
The CDSES–SF (Betz et al., Reference Betz, Hammond and Multon2005) contains 25 items. Participants indicate how confident they feel to handle five tasks necessary to making career decisions (engaging in accurate self-appraisal, gathering occupational information, engaging in goal selection, planning for the future, and engaging in problem solving) using a 5-point Likert scale ranging from no confidence at all (1) to complete confidence (5). Coefficient alpha reliability for the total score is .94 (Betz et al., Reference Betz, Klein and Taylor1996). This study administered a Turkish version of the CDSES-SF, which was found to be a valid and reliable measure with a Cronbach's alpha of .88 and correlated in expected directions with measures of vocational outcome expectations and locus of control (Işık, Reference Işık2010).
Self-Evaluation Inventory (SEI)
The SEI (Kuzgun, Reference Kuzgun1988) is a 230-item measure of an individual's vocational interests, abilities, and values. The interest section consists of 11 subscales (10 items each), which are: basic sciences, social sciences, living being, mechanic, persuasion, commerce, job details, literature, fine arts, music, and social service. In the current study, only the interest subscales (110 items) were used as the consideration measure. After the completion of SEI, a respondent would have the chance to compare his/her interest profile percentages with a norm group of 1,902 students. The Cronbach's alpha coefficient ranged from .58 to .92 for subscales.
Results
Prior to analysis, both pretest and posttest CDSES-SF scores were examined for assumptions of normal distribution and variance analysis. Skewness and kurtosis values ranged from .15 to .19 and −.08 to −.36 respectively, suggesting they were in the acceptable range for appropriate distribution. Assumptions of variance analysis were met as Box's test of equality of covariance matrices, F = 1.14, p > .05, and Levene's test of equality of error variances, F = 1.29, p > .05, of the dependent variables across groups were not significant.
An analysis of variance (ANOVA) was conducted to compare the three groups for their pretest scores. The results revealed that the three groups did not differ significantly in their pretest CDSES-SF scores, F(2,57) = 0.38, p > .05.
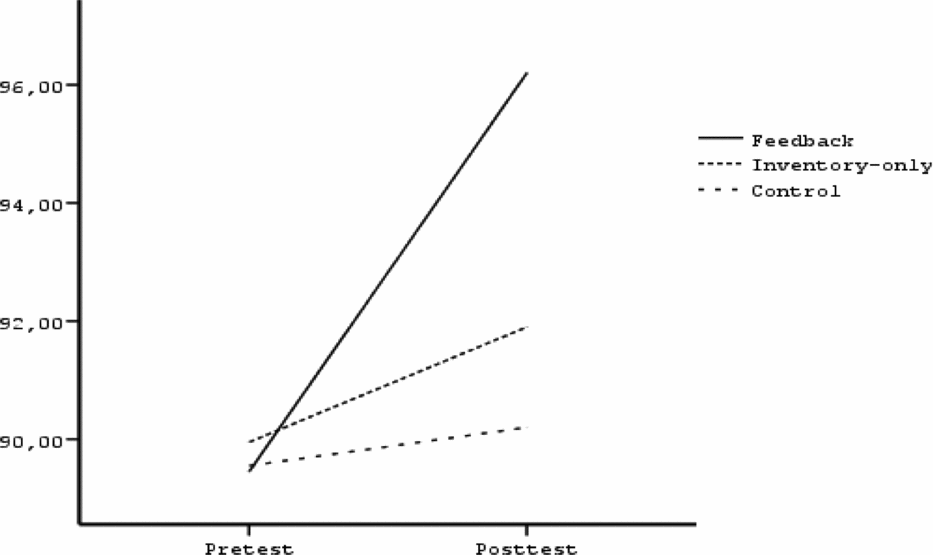
To determine whether the treatment was effective at increasing career decision self-efficacy an analysis of covariance (ANCOVA) was chosen because of the small sample sizes in both experimental and control groups (Porter & Raudenbush, Reference Porter and Raudenbush1987). The independent variable was the treatment condition, the dependent variable the posttest CDSES-SF, and the covariate was the pretest CDSES-SF. As shown in Table 1, the results of the ANCOVA yielded a significant effect of treatment on career decision self-efficacy of the participants, F(2,56) = 8.26, p < .01. A medium to large effect size (η2 = .23) was calculated on the basis of classification of small (η2 = .01), medium (η2 = .09), and large (η2 = .25) effects for the experimental research in psychology (Tabachnik & Fidel, Reference Tabachnik and Fidel1996). Subsequent LSD post hoc between-group comparisons indicated that the posttest CDSES-SF scores of the feedback group differed significantly from the posttest CDSES-SF scores of both the inventory-only group (p < .05) and the no-treatment control group (p < .01), whereas the posttest CDSES-SF scores of the inventory-only group did not differ significantly from the posttest CDSES-SF scores of the control group (p > .05). Post hoc within-group pretest–posttest comparisons using paired t tests revealed that the posttest was significantly different from the pretest for both the feedback group (p < .001) and the inventory-only group (p < .05), but not for the control group (p > .05).
Pretest and posttest total scores on the CDSES-SF of the three groups.

Means, Standard Deviations, and Differences between Pretest and Posttest Scores across Treatment Conditions on the CDSES-SF

Discussion
This study sought to expand the literature on the effectiveness of brief interventions of an interest inventory on a specific outcome measure of the career decision-making process by testing whether the feedback given after the completion of an interest inventory would increase undergraduate students’ career decision self-efficacy. As expected, the results indicated that both the completion of an interest inventory and participation in a feedback group after the inventory completion were effective at increasing career decision self-efficacy whereas no gains were observed in the control group that did not participate in any of the career activities. These results support previous findings (Luzzo & Day, Reference Luzzo and Day1999; Uffelman et al., Reference Uffelman, Subich, Diegelman, Wagner and Bardash2004) that participation in the interest assessment process was effective in increasing career decision self-efficacy. One possible explanation for this result is that personal accomplishment is a significant predictor of self-efficacy (Bandura, Reference Bandura1995) and that students in both the feedback group and the inventory-only group had the chance personally to focus and work on their career interests and to clarify those interests. With the help of this participation and personal assignment, they may have developed a sense of control and efficacy over their career plan, which in turn would have helped to increase their career decision-making self-efficacy.
As hypothesised, although both treatment conditions were effective, the feedback group appeared to be more powerful in increasing career decision self-efficacy. In parallel with previous findings (Breeding, Reference Breeding2008; Krieshok et al., Reference Krieshok, Ulven, Hecox and Wettersten2000; Luzzo & Day, Reference Luzzo and Day1999; Uffelman et al., Reference Uffelman, Subich, Diegelman, Wagner and Bardash2004), this result supports the idea that verbal persuasion is an important learning source of self-efficacy (Bandura, Reference Bandura1977, Reference Bandura1986, Reference Bandura1997) and that a career intervention targeted to increase a domain-specific self-efficacy should include at least one of these learning sources (Betz & Voyten, Reference Betz and Voyten1997). As discussed previously, verbal persuasion offered during feedback sessions is thought to have bolstered the strength of personal accomplishment gained by involving activities focusing on personal career interests and plans. A very recent study by Di Fabio and Maree (Reference Di Fabio and Maree2013) documented that group-based career counselling using the Career Interest Profile was effective in decreasing career decision-making difficulties and increasing career decision-making self-efficacy, whereas no gains were observed in a control group, supporting the current findings. Di Fabio and Maree also found that students in the experimental group developed more specific life and career goals.
Almost all career interventions include an interest inventory completion. However, completion of these inventories in isolation may not be satisfactory in reaching the desirable targets of career interventions. Clients should play an active role in the assessment process because the assessment results can help them clarify their personal self-concept (Hirschi & Läge, Reference Hirschi and Läge2008). For instance, Foltz and Luzzo (Reference Foltz and Luzzo1998) proposed that for a more complete evaluation of career development, counsellors need to move beyond mere assessment of interest. Counsellors would try to help their clients identify interest areas they may wish to develop in the future by encouraging them to try out new activities that they had little opportunity of engaging in (Krumboltz, Reference Krumboltz, Savickas and Walsh1996).
This study and its findings had several limitations. First, the students participating in experimental or control groups were all freshmen, suggesting that the results observed in the study might only be relevant to this particular group. Further research that includes students from all undergraduate years is needed for the generalisability of the results to other grade levels. Second, since the interest inventory feedback intervention was brief, the time lapse between the pre- and postevaluations was short (3 weeks). Thus, future research might also examine the longer-term effects of small-group feedback intervention on interest inventories. Finally, the outcome instrument used in this study is limited to career decision self-efficacy. The effect of the intervention should be assessed with other career-related outcome measures, such as career decision-making difficulties, career adaptability, career decidedness, and future career plans.
Overall, the results of this study point to the critical role of feedback given after the completion of an interest inventory. By participating in a feedback group and completing the activities on their interest profiles, clients had the opportunity to be actively involved in their own career process instead of passively completing an inventory and receiving no feedback. Moreover, clients had the chance to check the interpretations of their profiles and share their results with other clients having similar career difficulties. Through other group members’ feedback, participants can also benefit from each group member's past experience. Thus, counsellors can help their clients to increase their career decision self-efficacy by working deeply on their interest profile, discussing the consistencies and inconsistencies within their profile, and making the associations between their profile and their possible career goals within small groups.
Acknowledgments
I would like to thank Prof. Dr Yıldız Kuzgun for her advices on the design and initiation of the study and students who willingly participated in the study.