Introduction
Broadcast spawners, such as most species of patellogastropod limpets, have two-phase life cycles: planktonic larvae, and benthic juveniles and adults. The transition from the planktonic to the benthic habitat is one of the most important and less known events in the life cycle of most marine organisms (Jenkins et al., Reference Jenkins, Marshall, Fraschetti and Wahl2009). Linking these two phases is crucial for the persistence of marine populations and requires a series of processes to be overcome, each with its own characteristics and subject to different limiting factors (Cowen & Sponaugle, Reference Cowen and Sponaugle2009). The factors that influence this process include adult density (stock size) and fecundity, mass-spawning events, degree of synchrony in spawning, fertilization success and larval production, planktonic larval phase (dispersion, survival/mortality), larval competence, larval supply, metamorphosis, pre-settlement behaviour, settlement, post-settlement events and recruitment. The success of each of these steps, which occur in different habitats, affects the demography, dynamics and genetic structure of populations, and the composition of communities (Cowen & Sponaugle, Reference Cowen and Sponaugle2009). Recruitment is the end result of all these steps and both its magnitude and variability will have strong effects on adult population size and persistence. While it is difficult to measure fertilization rates, larval pools or true settlement rates in the field, especially when larvae and settlers are small and/or settle in cryptic habitats, recruitment is easier to observe and quantify. Thus, recruitment often becomes one of the measurable parts of the life cycle of many marine species.
Although settlement is a concrete and well-defined process (i.e. the passage from a planktonic way of life to the benthic environment, concurrent with metamorphosis), the concept of recruitment continues to be somewhat ambiguous and imprecise (see Keough & Downes, Reference Keough and Downes1982; Rodríguez et al., Reference Rodríguez, Ojeda and Inestrosa1993; Jenkins et al., Reference Jenkins, Marshall, Fraschetti and Wahl2009; Mandal et al., Reference Mandal, Tamaki, Ohashi, Takeuchi, Agata, Takahara, Harada and Yamada2010). In fact, the terms settlement and recruitment are often used interchangeably. Recruitment, in the broadest sense, is the addition of new individuals to populations or to successive life-cycle stages within populations (Caley et al., Reference Caley, Carr, Hixon, Hughes, Jones and Menge1996). However, recruitment is arbitrarily and operationally defined as the number of individuals recorded at some predefined stage after settlement, thereby incorporating post-settlement mortality (Carr & Syms, Reference Carr, Syms, Allen, Pondella and Horn2006), or as the entry into the benthic population of individuals that have survived up to a specified size after settlement, but are not yet adults (Booth & Brosnan, Reference Booth and Brosnan1995). Usually, recruitment is measured some time following settlement (i.e. when the juveniles can be observed). However, because the period immediately following settlement is typically a time of high mortality, the magnitude of recruitment under this definition is strongly influenced by the time interval between settlement and the evaluation of postlarval survivorship. Sometimes recruitment describes the interannual variation in the number of individuals that have settled and persisted at the end of each annual reproductive season.
The ferruginous limpet (Patella ferruginea Gmelin, 1791), endemic to the western Mediterranean, is one of the most endangered marine invertebrates in the Mediterranean. It is currently considered at risk of extinction as its distribution has progressively reduced in recent decades and many populations have declined or vanished (Laborel-Deguen & Laborel, Reference Laborel-Deguen, Laborel, Boudouresque, Avon and Gravez1991a; Boudouresque et al., Reference Boudouresque, Beaubrun, Relini, Templado, Van Klaveren, Van Klaveren, Walmsley and Zotier1996). Consequently, it was included in the European List of species for which specific conservation strategies should be implemented (Annex II of the Berna Convention, Annex II of Barcelona Convention) and surveillance of the conservation status undertaken (Annex IV of the Habitats Directive). For this reason, this limpet has been the subject of intense research during the last three decades (compiled by Luque et al., Reference Luque, Guallart, Templado and Pola2018). Research has mainly focused on the status of local populations and the benthic phase of its life cycle (e.g. Pascal, Reference Pascal2002; Paracuellos et al., Reference Paracuellos, Nevado, Moreno, Giménez and Alesina2003; Espinosa et al., Reference Espinosa, González, Maestre, Fa, Guerra-García and García Gómez2008, Reference Espinosa, Rivera-Ingraham and García-Gómez2011, Reference Espinosa, Rivera-Ingraham, Maestre, González, Bazairi and García-Gómez2013; Moreno & Arroyo, Reference Moreno, Arroyo, Barea-Azcón, Ballesteros-Duperón and Moreno2008; Espinosa, Reference Espinosa2009; Rivera-Ingraham et al., Reference Rivera-Ingraham, Espinosa and García-Gómez2011a, Reference Rivera-Ingraham, Espinosa and García-Gómez2015a; Coppa et al., Reference Coppa, de Lucia, Massaro and Magni2012; Guallart et al., Reference Guallart, Luque, Acevedo and Calvo2013b; González-García et al., Reference González-García, Paredes Ruiz, Enrique Mirón, Calzado Liarte and Bueno del Campo2015; Guallart & Templado, Reference Guallart and Templado2016; Kallouche et al., Reference Kallouche, Benaissa, Rouane-Hacene, Soufi, Bouderbala, Bouras and Mouffok2020). The link between adults and the production of cohorts of recruits has however, received much less attention. Guallart & Templado (Reference Guallart and Templado2016) described the local population of P. ferruginea in the Chafarinas Islands (N Africa) and commented on the variability in annual recruitment. The sequence of changes in shell morphology and colour pattern of settlers and recruits until they reach 20 mm in maximum shell diameter (MD hereinafter) was described by Guallart et al. (Reference Guallart, Peña, Luque and Templado2017). This allows juveniles of P. ferruginea to be differentiated from small specimens of other local limpet species. Advances in laboratory rearing allowed for a detailed description of larval development up to earliest benthic stages (i.e. postlarvae and very small recruits) (Guallart et al., Reference Guallart, Peña, Pérez-Larruscaín, Luque and Templado2020; Ferranti et al., Reference Ferranti, Guallart, Fanciulli, Panzalis and Chiantore2022). Patella ferruginea has a long lifespan that can exceed 12 years, and a slow growth rate but may reach lengths of up to 10 cm (Laborel-Deguen & Laborel, Reference Laborel-Deguen, Laborel, Boudouresque, Avon and Gravez1991b), although growth parameters show high variability (Espinosa et al., Reference Espinosa, González, Maestre, Fa, Guerra-García and García Gómez2008; Guallart et al., Reference Guallart, Acevedo and Calvo2012).
Patella ferruginea inhabits the upper midlittoral fringe of rocky shores (Templado et al., Reference Templado, Calvo, Garvía, Luque, Maldonado and Moro2004; Guallart & Templado, Reference Guallart and Templado2016; Luque et al., Reference Luque, Guallart, Templado and Pola2018), and is a sequential protandrous hermaphrodite capable of a two-way sex change (Guallart et al., Reference Guallart, Calvo, Acevedo and Templado2013a). It first matures as a male from ~30 mm MD, and the minimum MD that females can be found is 40 mm (Luque et al., Reference Luque, Guallart, Templado and Pola2018). Individuals less than 30 mm MD are usually considered juveniles, as they have not yet reached their first sexual maturity. The first data on the reproductive cycle of P. ferruginea were provided by Frenkiel (Reference Frenkiel1975), who found that it spawns once a year in the SW Alboran Sea (Algeria). Gonadal maturation begins at the end of August or in September, and spawning occurs in November, possibly triggered by a decrease in seawater temperatures and the first strong marine storms (Frenkiel, Reference Frenkiel1975; Guallart et al., Reference Guallart, Calvo and Cabezas2006). From the end of January to July, it has a reproductive resting period in the SW Alboran Sea, although Rivera-Ingraham et al. (Reference Rivera-Ingraham, Espinosa and García-Gómez2011b) found sexually mature individuals from September to early February towards the western range of its distribution, in the Strait of Gibraltar (Ceuta). It has been assumed that this species has a low fecundity and a short planktonic larval phase with limited dispersal ability (Laborel-Deguen & Laborel, Reference Laborel-Deguen, Laborel, Boudouresque, Avon and Gravez1991b). However, it has been proven that the main reproductive traits of P. ferruginea (i.e. fecundity, larval development and duration of pelagic phase) hardly differ from those of other European limpet species (Guallart et al., Reference Guallart, Peña, Pérez-Larruscaín, Luque and Templado2020). Therefore, the latter authors concluded that decline of P. ferruginea cannot be mainly attributed to constraints of these traits as previously suggested, but to human impact.
Additionally, the presence of small-sized specimens of P. ferruginea on the shell of adults has been observed by some authors (Laborel-Deguen & Laborel, Reference Laborel-Deguen and Laborel1990, Reference Laborel-Deguen, Laborel, Boudouresque, Avon and Gravez1991b; Porcheddu & Milella, Reference Porcheddu, Milella, Boudouresque, Avon and Gravez1991; Casu et al., Reference Casu, Sanna, Cristo, Lai, Dedola and Curini-Galletti2010), and the term ‘phoresy’ has been used in reference to these observations. Several hypotheses, such as a selective settlement of larvae on adult shells (Laborel-Deguen & Laborel, Reference Laborel-Deguen and Laborel1990, Reference Laborel-Deguen, Laborel, Boudouresque, Avon and Gravez1991b) are proposed to explain why phoresy occurs, however, to date, little is known about this phenomenon.
The study of life-history traits and population dynamics of endangered species is critical to accurately assess their status and develop appropriate protection measures (Powles et al., Reference Powles, Bradford, Bradford, Doubleday and Lewings2000). At present, information on the recruitment of P. ferruginea is scattered in studies that mainly focus on other aspects (e.g. Espinosa, Reference Espinosa2009; Espinosa et al., Reference Espinosa, Rivera-Ingraham, Fa and García-Gómez2009b; Arroyo et al., Reference Arroyo, Moreno, Barrajón, de la Linde, Remón, de la Rosa, Fernández-Casado, Gómez, Ruiz-Giráldez, Vivas and Fernández2011; Rivera-Ingraham et al., Reference Rivera-Ingraham, Espinosa and García-Gómez2011a, Reference Rivera-Ingraham, Espinosa and García-Gómez2011b, Reference Rivera-Ingraham, Espinosa and García-Gómez2011c, Reference Rivera-Ingraham, Espinosa and García-Gómez2015a; Meinesz & Dominici, Reference Meinesz and Dominici2015; Zarrouk et al., Reference Zarrouk, Romdhane and Espinosa2016). Here we use long-term monitoring data collected over a 17-year period to provide an in-depth understanding of the recruitment of P. ferruginea in the Chafarinas Islands alongside new information on phoresy.
Materials and methods
Study area
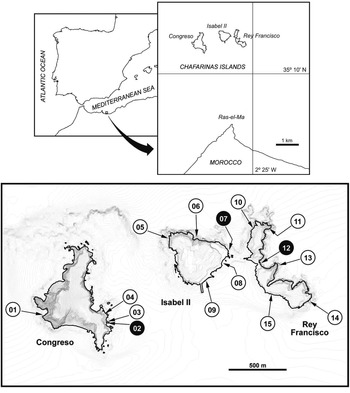
The Chafarinas Islands is a small Spanish archipelago (35°10′N 2°25′W) located in the south-eastern Alboran Sea (SW Mediterranean), 1.9 nautical miles (3.52 km) off the North African coast of Morocco (Figure 1). The archipelago is formed by three islands from west to east: Congreso, Isabel II and Rey Francisco. The islands have been a protected area of the Natura 2000 Network since 1998 (Special Protected Area), then in 2006 were declared a Site of Community Importance (SCI ES6300001), and in 2018, a Special Area of Conservation (SAC). Currently, Isabel II is the only inhabited island (by personnel of the military garrison and the Biological Station dependent on the Spanish Organismo Autónomo Parques Nacionales, Ministerio para la Transición Ecológica y el Reto Demográfico). Public access is strictly prohibited except for logistic and scientific purposes.
Geographic location of the Chafarinas Islands. Transects studied in 2005 are indicated by numbered circles; the three transects subject to continuous monitoring throughout the study are highlighted with a black background.

The archipelago houses one of the most important and healthy populations of P. ferruginea, estimated to be more than 42,000 adults (specimens larger than 30 mm in MD), distributed on most (86.4%) of the coastline with suitable habitat, and with an average density of 4.82 adults m−1 and a maximum density of 21.5 adults m−1 (Guallart & Templado, Reference Guallart and Templado2016). The entire population, including juvenile specimens, is considered to vary depending on interannual variability in recruitment and seasonal changes. However, recruitment, although variable, seems to be regular in this archipelago over the last 17 years, and has been, at times, exceptionally successful (Guallart et al., Reference Guallart, Acevedo and Templado2011), which facilitated observations of recruits of different sizes (Guallart et al., Reference Guallart, Peña, Luque and Templado2017).
Census for recruitment estimate
The data presented here were generated as part of fieldwork undertaken on the Chafarinas Islands between 1999 and 2015 for a variety of research studies on Patella ferruginea. The first monitoring censuses were carried out in 1999 along 10 transects of 25 m length (according to the pioneering work of Aparici-Seguer et al., Reference Aparici-Seguer, Guallart-Furió and Vicent-Rubert1995), three of these (02, 07 and 12, one in each island, Figure 1 and Table 1) were chosen for regular monitoring between 1999 and 2003. In March 2005, a total of 15 transects were censused (Figure 1), but the length of the transects was shortened to about 10 m in order to reduce sampling effort given the high abundance of P. ferruginea initially recorded, and because abundance in shorter transects was sufficient for size‒frequency distribution representativeness. The length of the transects used for regular monitoring (02, 07 and 12) was also reduced in 2005 and ranged between 10.0 and 11.8 m in length, taking into account the topography of the coastline to define their limits (Table 1). These shorter transects were monitored from 2005 until 2015. Thus, results of the monitoring censuses 1999‒2003 and 2005‒2015 are not strictly comparable. Most censuses were carried out in spring (from the end of March to the end of June), with additional censuses conducted at the end of summer on transect 07 for seven years to study recruit mortality.
Transects where regular monitoring of recruitment has been carried out in the Chafarinas Islands, indicating the island where each transect is located, its length in the periods 1999‒2003 and 2005‒2015, and the UTM coordinates (zone 30, datum WGS84) of the central point of each transect (see Figure 1).

All censuses were carried out along fixed linear belt transects that ran parallel to the coastline, and all P. ferruginea specimens present along these transects were counted. The belt area sampled included all substrata at levels where P. ferruginea could be found, i.e. from the lower limit of the midlittoral level (marked by the Corallinaceae fringe) to the upper limit (marked by the Chthamalus spp. fringe). The belt width varied depending on the distribution of these characteristic assemblages, related mainly to the slope of the substratum and the degree of hydrodynamism. All P. ferruginea individuals (i.e. adults, juveniles <30 mm; ‘carriers’ and ‘phoretic’) observed in each transect were counted and measured in situ, using Vernier callipers. The early juveniles of P. ferruginea were distinguished from those of the other sympatric limpet species (Patella rustica Linnaeus, 1758, or, more infrequently, Patella caerulea Linnaeus, 1758 and Patella ulyssiponensis Gmelin, 1791), according to the shell characters described by Guallart et al. (Reference Guallart, Peña, Luque and Templado2017). The maximum diameter (MD) of the shell measured along its longitudinal axis, including the extensions due to the ribs that often project from the shell contour, was considered to be the limpet size or length (Guallart et al., Reference Guallart, Acevedo and Calvo2012; Guallart & Templado, Reference Guallart and Templado2016; Luque et al., Reference Luque, Guallart, Templado and Pola2018). The number of specimens per linear metre of coastline (‘density’ hereinafter) was considered a representative parameter of abundance and has been used in the majority of recent studies on this species (Luque et al., Reference Luque, Guallart, Templado and Pola2018). Due to the abundance of specimens, not all were accurately measured and were instead categorized into size ranges. They were first classified in intervals of 5 mm, but in 2011 and 2012, censuses were carried out with interval sizes of 1 mm for more detailed comparative purposes.
Censuses were always carried out at low tide and during calm weather, with small or no waves breaking on the shore. These conditions were necessary for accurate counts, particularly for small specimens like recruits, but sometimes bad weather limited the opportunity to undertake all planned censuses. When there was no other choice and only one census could be carried out during the annual surveys, transect 07 was selected because it was the most accessible and had the high number of limpets required for statistical analyses. No censuses were conducted in 2000, 2004 and 2014 because of weather or logistical constraints.
Settlement per se was not estimated in this study because settlers (post-larvae) are unlikely to be detected, hence their total numbers could not be determined accurately. As such, a sampling bias was assumed as smaller specimens (<5 mm) are likely to have been overlooked. While 74 specimens <5 mm in MD (the smallest was 3.8 mm) were counted during the study, we estimate that only individuals >8 mm were fully counted.
Phoresy
The presence of ‘phoretic’ specimens was studied between 1999‒2010 in the censuses conducted in the three transects selected for regular monitoring. During these censuses, the number and size (1 mm size intervals) of both adults and ‘phoretic’ specimens was recorded.
We made additional observations of the phoretic relationship between juveniles and adults in the field and in laboratory culture tanks of which some involved the translocation of both juveniles and adults (Peña et al., Reference Peña, Guallart and Pérez-Larruscaín2013; Guallart et al., Reference Guallart, Peña, Luque and Templado2017, Reference Guallart, Peña, Pérez-Larruscaín, Luque and Templado2020).
Data analysis
The abundance of recruits was assessed using two complementary procedures. A cohort analysis of size‒frequency distribution was conducted using the Bhattacharya (Reference Bhattacharya1967) method (BM hereinafter) in FISAT II FAO-ICLARM Software v. 1.2.2 (Gayanilo et al., Reference Gayanilo, Sparre and Pauly2005). In general, only the first two years cohorts (ages 0+ and 1+) could be assessed. The alternative method was to count juveniles <20 mm MD (considered as recruits) as 0+ cohort estimates, since previous work has shown that this is approximately the average size that juvenile P. ferruginea reach during the first year of life (Luque et al., Reference Luque, Guallart, Templado and Pola2018).
Other basic statistical calculations (averages, standard deviations or lineal correlations) were made using SPSS® Software v. 16.0.
Definitions
The meanings of the terms used in this study are as follows:
-
Settlement: the successful passage from the pelagic larval stage to benthic life.
-
Settlers: newly settled individuals that cannot be detected by the naked eye (i.e. <1 mm) or rarely found in the field (i.e. specimens <4 mm).
-
Recruitment: the number of individuals that have settled and persisted on the shore during the first annual cycle (0+ year cohort).
-
Recruits: settlers that have survived to a size that allows them to be detected by the naked eye (i.e. cohort 0+ determined by BM analysis or observed specimens <20 mm).
-
Juveniles: specimens that have not yet reached sexual maturity (i.e. not adults, in practice those <30 mm MD).
Results
Recruitment
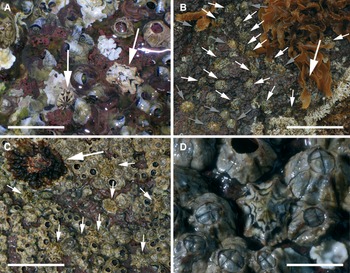
A total of 8115 recruits <20 mm MD were counted in 95 censuses during the study. Irrespective of the year, the presence of recruits began to be evident at the end of winter or beginning of spring (March‒April). Differentiating of recruits from the previous annual spawning period from juveniles more than one year old was often easy because the recruits were smaller in size and had bright shells with a conspicuous colouration and often lacked epibionts. Specimens of 4‒6 mm were found at the mean sea level, delimited by the fringe of the vermetid gastropod Dendropoma lebeche Templado, Richter & Calvo, 2016 and the crustose coralline algae Neogoniolithon brassica-florida (Harvey) Setchell & L. R. Mason, 1943 (Figure 2A). Specimens >8 mm were also found at this level, as well as the upper midlittoral at the Chthamalus spp. fringe (Figure 2B‒D) where adults predominate.
Recruitment of Patella ferruginea in the Chafarinas Islands: (A) two small recruits (arrows) in the fringe of the vermetid gastropod Dendropoma lebeche and the crustose coralline algae Neogoniolithon brassica-florida; (B) group of recruits from both Patella ferruginea (white arrows) and Patella rustica (grey arrows) with an adult of the first species (large arrow) and the algae Rissoella verruculosa (Bertoloni) J. Agardh, 1851 at the top and Ellisolandia elongata (J. Ellis & Solander) K.R. Hind & G.W. Saunders, 2013 in the lower right-hand corner; (C) adult specimen (large arrow) and some recruits (small arrows) in the area with maximum coverage of Chthamalus spp.; (D) recruit of about 6 mm MD in a gap not covered by Chthamalus spp. Scale bar: A, 10 mm; B, 54 mm; C, 41 mm; D, 5 mm.

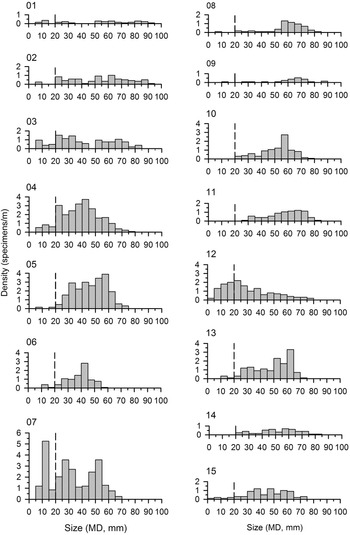
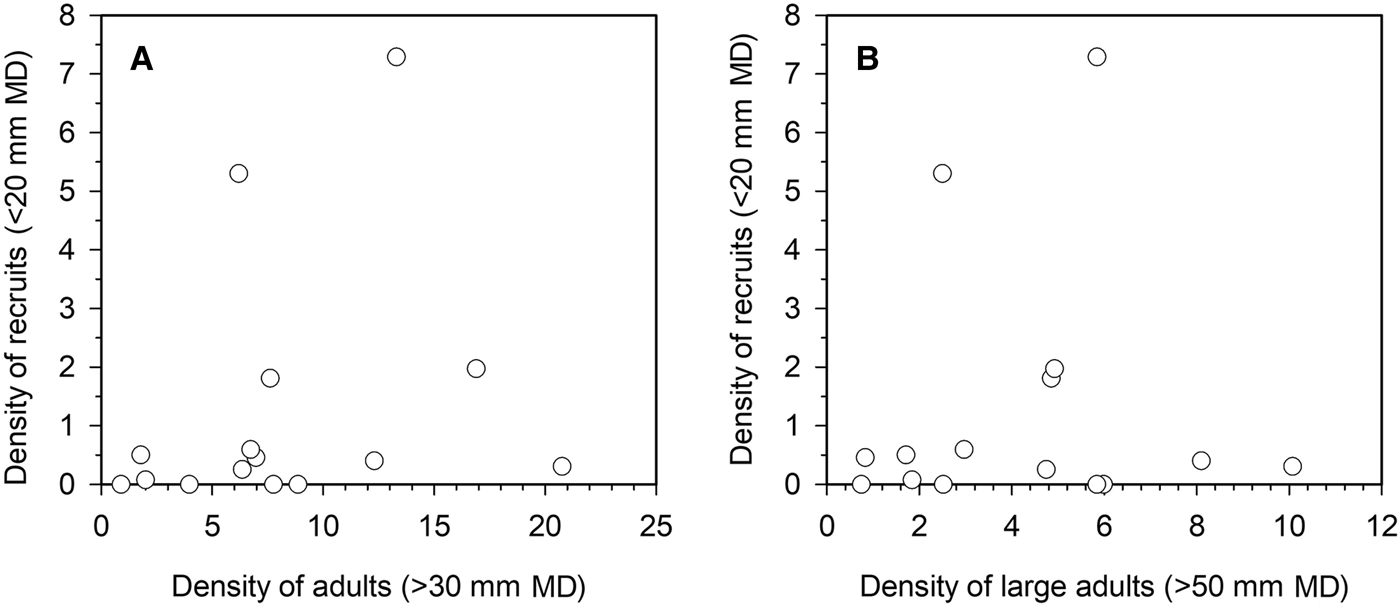
The censuses carried out in March 2005 on 15 transects across the archipelago showed that recruits were widely distributed along the coast of the archipelago, although abundance was not homogeneous across transects, at least during this year when recruits were not particularly abundant (Figure 3). No significant correlation was found between the density of recruits and adults in these transects, both for adults >30 mm MD (r = 0.255, P = 0.358, N = 15) or >50 mm MD (r = 0.059, P = 0.836, N = 15) (Figure 4).
Size‒frequency distribution of Patella ferruginea from censuses carried out in 15 transects (see Figure 1) in March 2005. Dashed vertical lines segregate specimens <20 mm MD, considered as recruits.

Relationship between abundance of recruits (specimens <20 mm MD) and adults in 15 transects studied in March 2005: (A) adults >30 mm MD; (B) adults >50 mm MD.

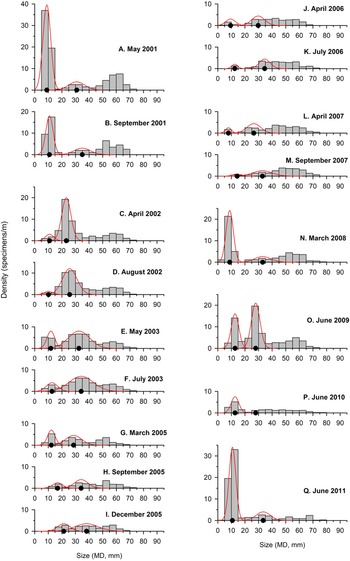
The results of the size-frequency distribution of P. ferruginea from censuses carried out in different months and years in transect 07 and adjusted by the BM show the progression of growth in the newly recruited cohort (age 0+) and limpets of the first year (age 1+ cohort) (Figure 5). In some years, such as 2001 and 2005, a decrease in the abundance of individuals was observed between March and September (Figure 5). Larger individuals could not be classified into older age groups because no well-defined cohorts could be detected visually nor using BM.
Size‒frequency distribution of Patella ferruginea from censuses carried out in different months and years in the transect 07. Normal-distribution curves (red line) were fitted to the supposed 0+ (recruits) and 1+ cohorts calculated by the Bhattacharya method (BM). Black dots on the x-axis correspond to the mean size value of each cohort.

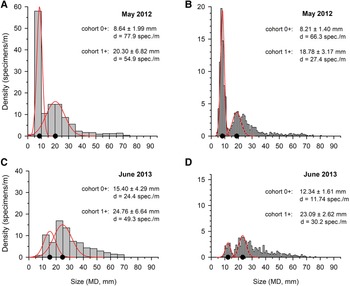
The comparison of the size‒frequency distribution from transect 07 in May and June 2012 and 2013 shows a smaller average size of the 0+ cohort (4.98% and 19.87% smaller in 2012 and 2013, respectively) and a much lower SD using 1 mm analyses compared with the 5 mm size-classes (Figure 6). The density of the 0+ cohort using the 1 mm analyses is also lower in both 2012 and 2013 compared with the 5 mm size-classes (14.89 and 23.77%, respectively). A similar pattern is observed for the 1+ cohort.
Comparison of results of the size‒frequency distribution of Patella ferruginea in transect 07 in May 2012 (A, B) and June 2013 (C, D) using 1 mm (B, D) and 5 mm size-classes (A, C). Average size (black dots), standard deviation and abundance (d: density = specimens m−1 of linear coastline) resulting from the calculations (using BM) are presented with the normal-distribution curves overlayed (red line).

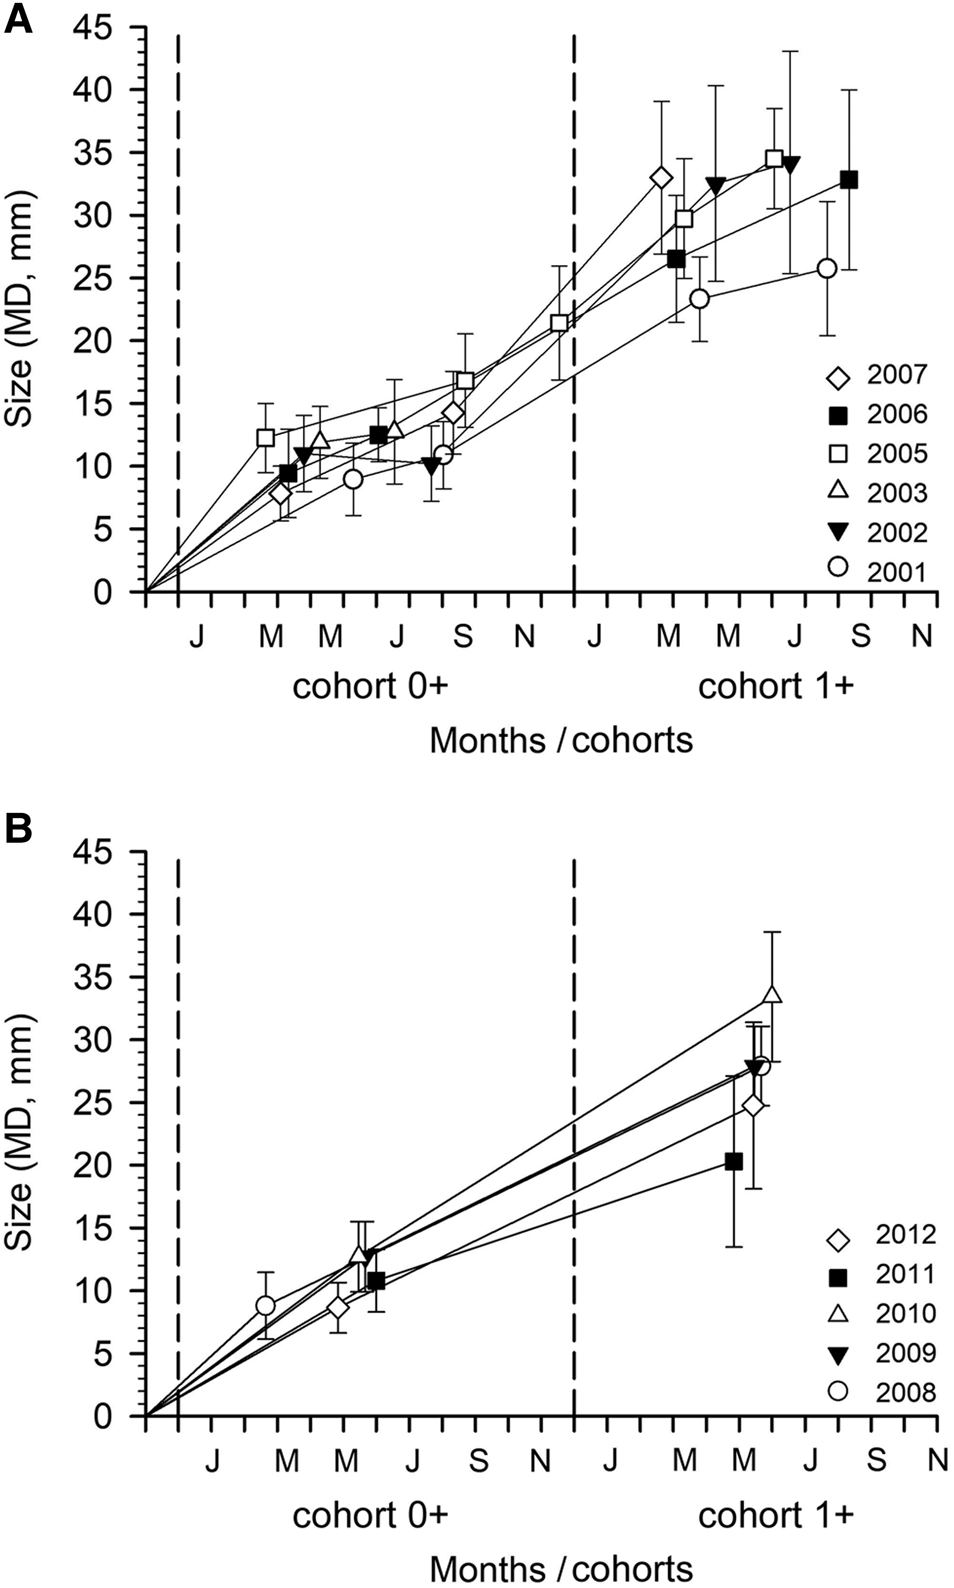
From the analysis of the average size of the first two years cohorts (i.e. ages 0+ and 1+) in transect 07 (Figure 7), it can be estimated that P. ferruginea reaches a mean size of around 18 mm at the end of its first year of life, although this is highly variable and ranges from 12‒27 mm. These values are based on the BM analysis and correspond to the normal curves and the average sizes of P. ferruginea represented in Figures 5 and 6A, C. Although the same general pattern is observed, some interannual variability appeared in the mean size of P. ferruginea across the months. For instance, the most common size-range of recruits in March 2005 and June 2009 and 2010 was 10‒15 mm, while the predominant size-range in March 2008 was 5‒10 mm (Figure 5). Likewise, the mean size of recruits aged 0+ in May 2012 would be ~8 mm (Figure 6A, C), while that same group one month later (June 2013) would be between 12‒15 mm (Figure 6B, D). Changes of the mean size of the cohorts in transect 07 during the two first years of life (Figure 7) allows us to predict that juvenile P. ferruginea could reach a mean size of 35 mm MD at the end of their second year of life.
Changes of the mean size (points) ± standard deviation (vertical bars) of the cohorts in transect 07 during the two first years of life, from calculations made through the BM: (A) data between 2001 and 2007, with more than one sampling per year; (B) data between 2008 and 2012, with only one sampling per year.

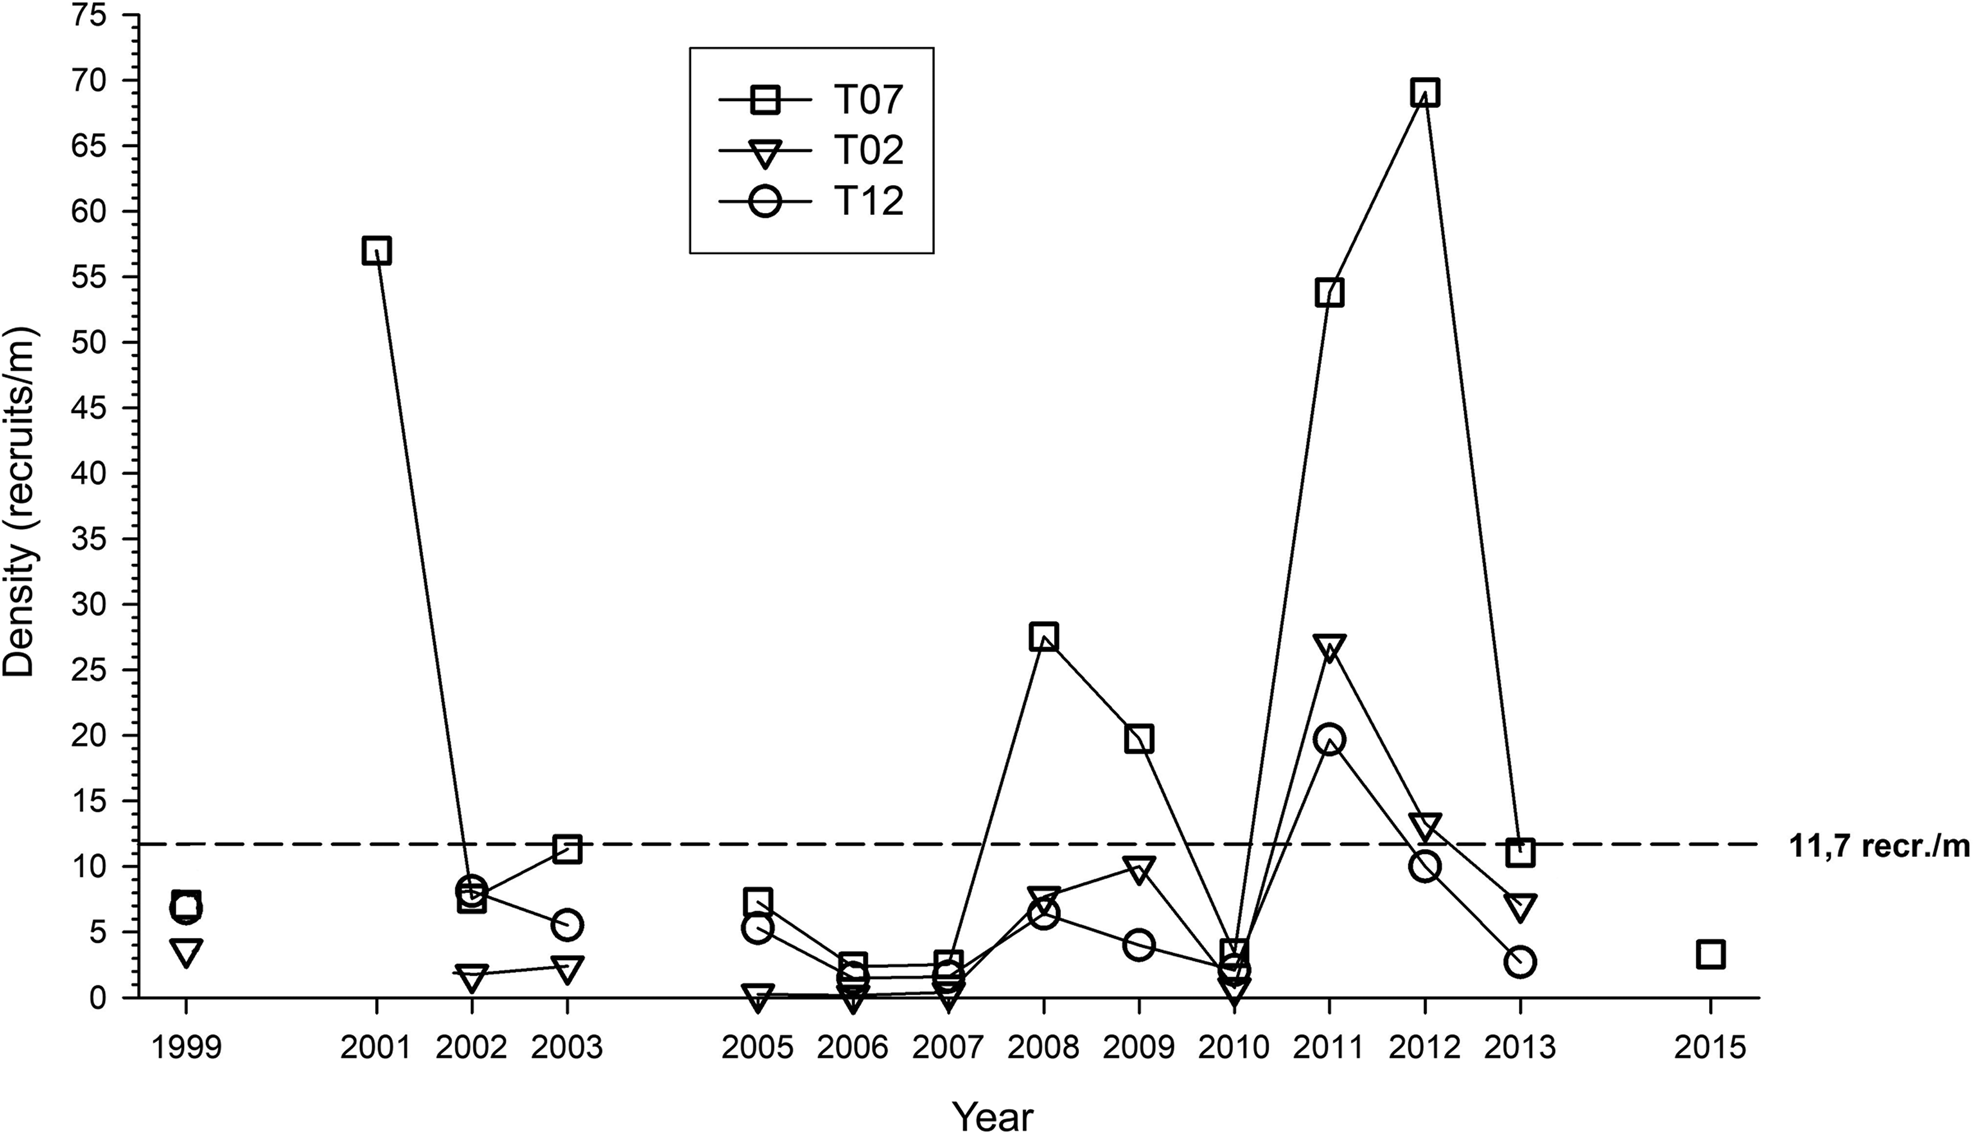
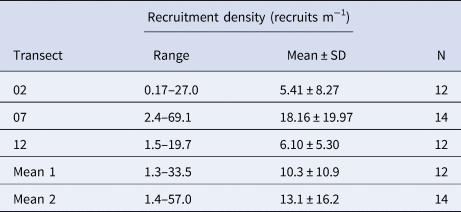
A total of 2479 recruits were counted in the Chafarinas Islands between 1999 and 2015 in the three transects selected for regular monitoring (02, 07 and 12). Regular recruitment was detected in all years studied, which in any year was less than 1 recruit m−1 on average, and was 11.71 recruits m−1 on average for all transects across the whole study period. However, interannual variability in recruitment was extremely high (Table 2), and the values obtained in three years (2001, 2011 and 2012) were much higher than the average, with the lowest recruitment occurring in 2006 and 2007 (Figure 8). Recruitment was generally higher in transect 07 than in the other two transects, especially in the 2001, 2011 and 2012 peaks. The maximum density across all transects censuses was 69.07 recruits m−1 in the transect 07 in 2012. The highest average per year for the three monitored transects was 33.49 recruits m−1 in 2011. In the years of highest recruitment (>10 recruits m−1 on average), recruits were relatively widespread across coastal areas of the archipelago.
Average density of recruits (specimens <20 mm) in spring during the studied years in the three transects selected for regular monitoring (02, 07 and 12). The dashed line represents the average of the whole data set (11.71 recruits m−1).

Interannual variation in the density of recruits from censuses carried out in spring in different years in the three transects selected for regular monitoring throughout the present study. The size range (recruits <20 mm MD m−1), the mean and standard deviation (SD) and the number of years (N) for which data are available are indicated. Mean 1: only years with data for the three transects; Mean 2: data from all years, even if data only come from one transect.

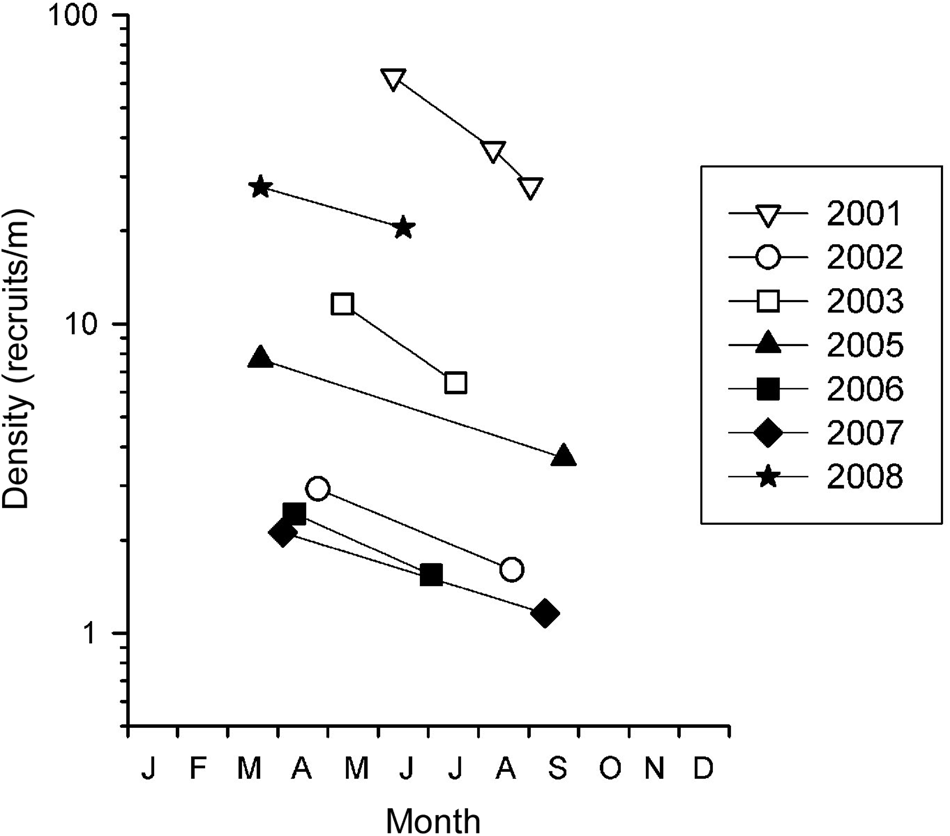
The density of recruits in their first year of life decreased during summer in the seven years in which censuses in transect 07 were conducted in more than one period (Figure 9).
Seasonal change of recruit density (estimated by BM) in transect 07 in the seven years in which censuses were conducted in more than one period. The vertical axis is on a logarithmic scale to homogenize the variability of the initial density.

Phoresy
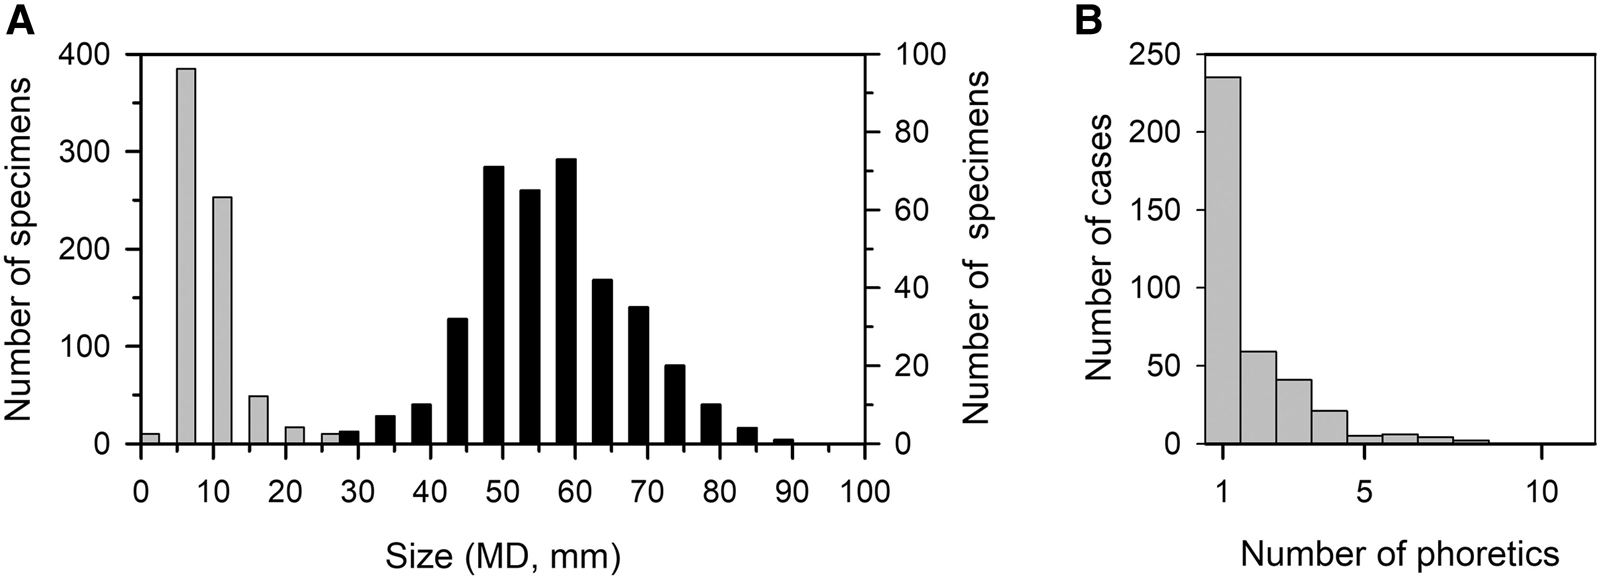
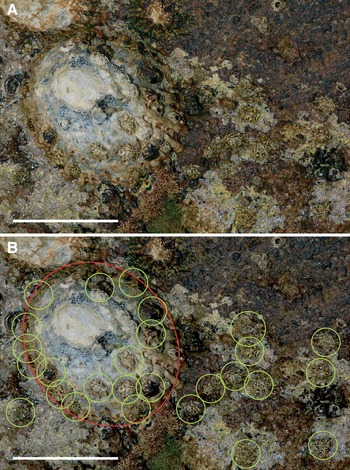
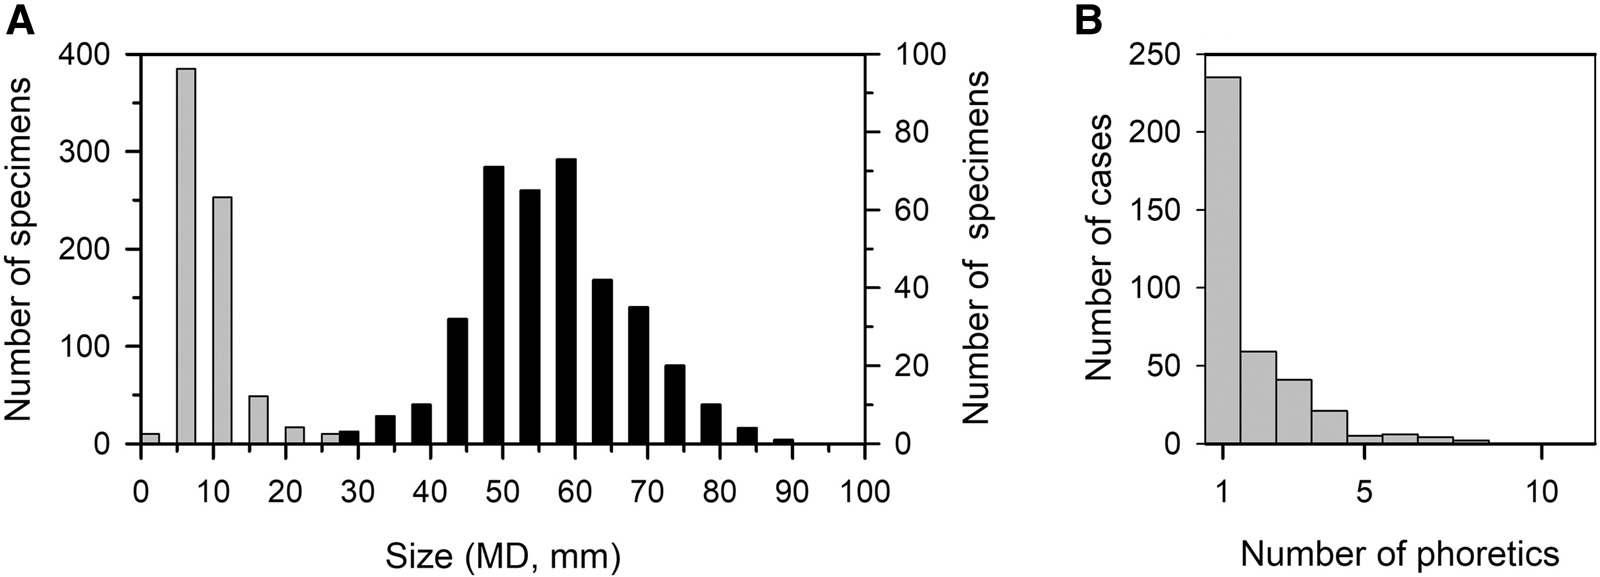
Censuses between 1999 and 2010 in spring months for the three transects selected for regular monitoring registered 726 small specimens on the shells of 373 adults. This represents 29.29% of the total counted recruits (<20 mm) in that period (N = 2479). The size of phoretic specimens ranged from 4.5‒35.7 mm (mean ± SD = 10.6 ± 4.3, N = 583), whereas carriers size ranged from 29.8‒90.7 mm (mean ± SD = 60.2 ± 10.5, N = 373). Phoretic specimens were mainly recruits <20 mm (95.88%), but 4.12% were also larger juveniles >20 mm which may be fast-growing 0+ age, 1+ age or even small adults (>30 mm). Most phoretic specimens were 5‒15 mm in size and were most commonly found on adult carriers ranging from 45‒60 mm (Figure 10A). The number of phoretic specimens per adult ranged from 1–11 (mean ± SD = 1.81 ± 1.41; N = 373) for the three transects selected for regular monitoring, but 62.8% of adults carried only one specimen (Figures 10B, 11). Outside the reference transects, an adult of about 80 mm MD was observed in 2011 carrying 16 juveniles (<15 mm) on its shell (Figure 12). A weak significant positive correlation was found between adult size and number of small specimens on the shell (r = 0.131, P = 0.012, N = 373; only adults carrying at least one specimen were included in these calculations).
Phoresy in Patella ferruginea. (A) size‒frequency distribution of phoretic specimens (grey, left y-axis) and adults carrying them (black, right y-axis) for the three transects selected for regular monitoring in censuses carried out between 1999 and 2010; (B) abundance of phoretic specimens per adult for the three transects.
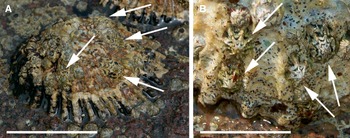
Phoresy in Patella ferruginea: (A) recruits (arrows) on the shell of an adult, whose surface shows a covering similar to that of the substratum with crustose algae and Chthamalus spp.; (B) four recruits (arrows) between ribs of an adult shell, close to some specimens of Chthamalus spp. and algal propagules. Scale bar: A, 50 mm; B, 36 mm.

Phoresy in Patella ferruginea. Example of a very high abundance of recruits observed in Congreso Island (Chafarinas Islands) in June 2011 outside one of the monitoring transects. The image covers an area of ~16.7 × 11.1 cm (i.e. 185.4 cm2) and shows an adult of about 80 mm DM and 27 small juveniles (recruits), 16 of which are on the shell of the adult and 11 on the rocky substratum. (A) original image; (B) the adult is highlighted with a red oval and the recruits with green circles. Scale bar: A, B, 50 mm.

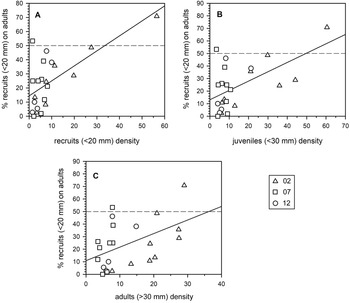
The correlation between the percentage of phoretic recruits (<20 mm) and total recruit density, total juvenile density and adult density was analysed in the three transects selected for regular monitoring (Figure 13). Censuses in which fewer than 10 recruits were found were not included in the analysis due to the small sample size. The percentage of phoretic recruits showed a significant positive correlation with the recruits' total density (r = 0.673; P < 0.001; N = 23) and the total juvenile (<30 mm) density (r = 0.580; P = 0.004; N = 23), and a weak correlation with adult (>30 mm) density (r = 0.474; P = 0.022; N = 23).
Phoresy in Patella ferruginea. Relation between the percentage of phoretic recruits (<20 mm) and (A) total density of recruits (<20 mm), (B) total density of juveniles (<30 mm), (C) density of adults (>30 mm). (Dashed line is a reference of 50% and solid lines correspond to the fit to a linear model.)

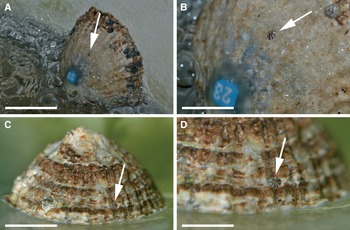
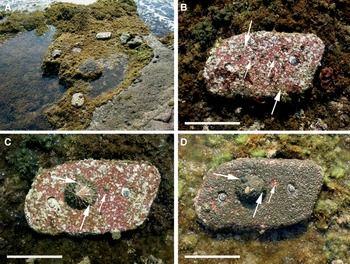
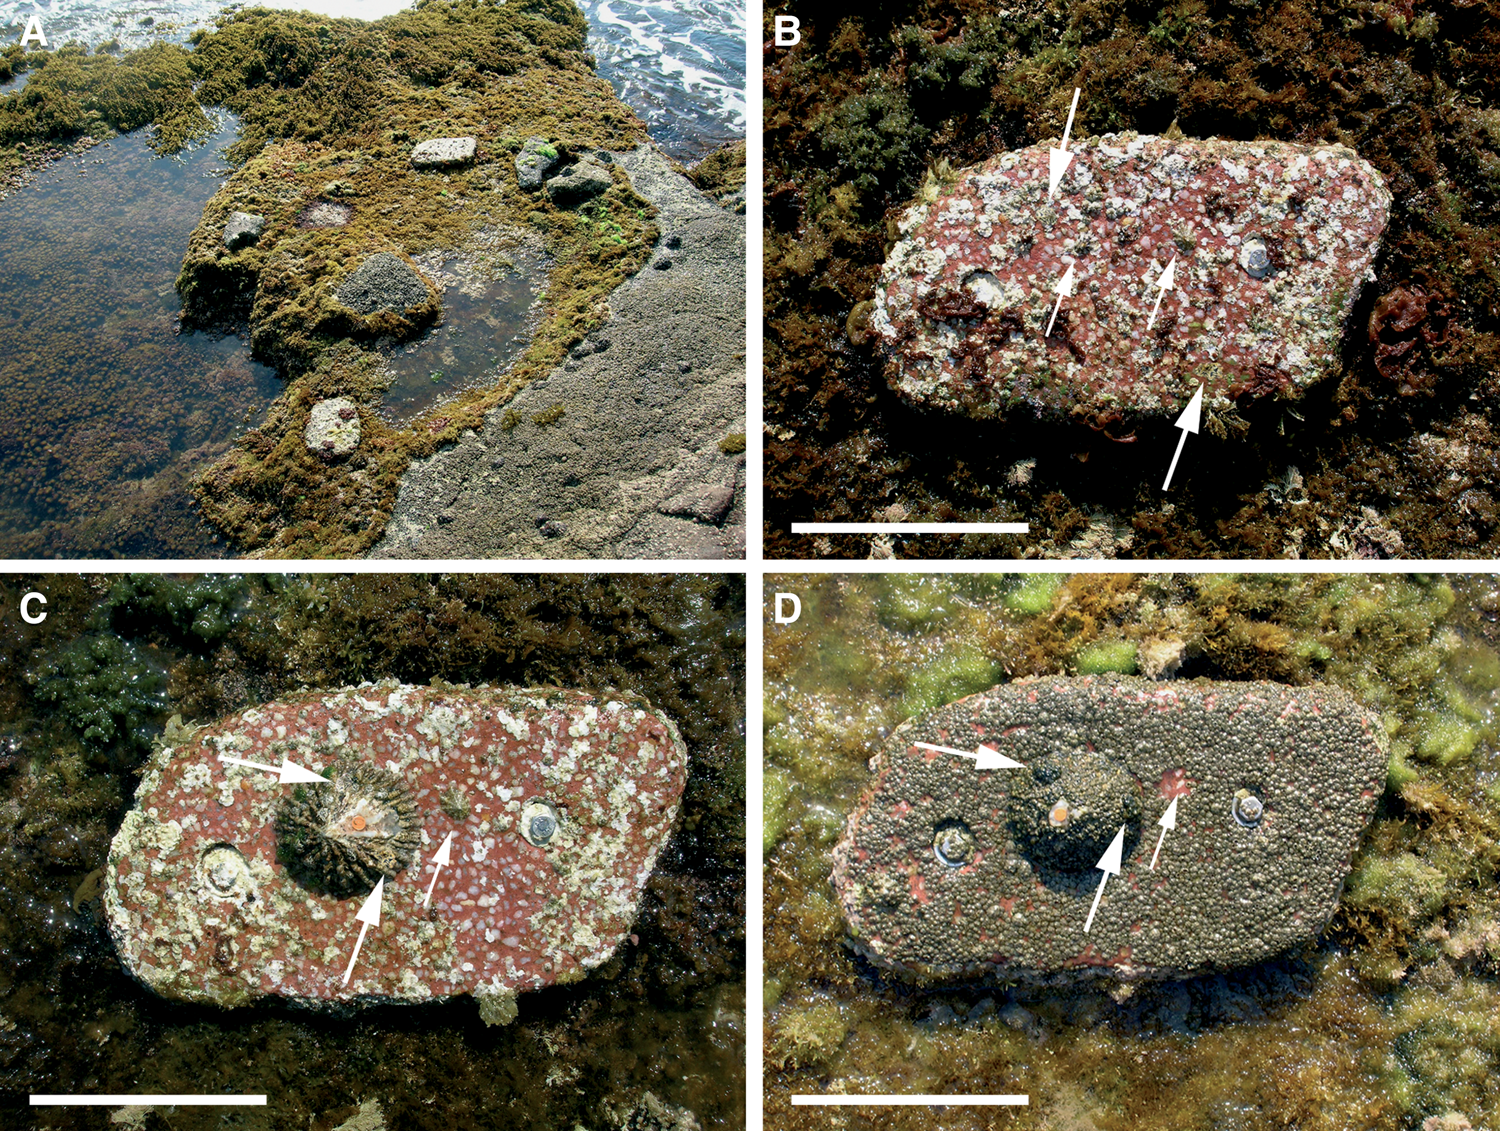
In laboratory culture tanks it was observed that when one or more adult specimens were placed in areas where there were recruits, the recruits tended to climb on the adults' shells (Figure 14). Similarly, in field experiments in the Chafarinas Islands carried out in 2006, very small specimens (naturally recruited) moved onto the shells of adults that were experimentally translocated to removable substrata (Figure 15). These substrata were installed over rocky ground but separated from the substratum, so that the adults translocated on them and the spontaneously attached recruits were experimentally isolated from the rest of the population.
Phoresy in Patella ferruginea. (A–B, C–D) two examples of small laboratory-bred recruits (arrows) that climbed on to an adult after placing the adult in the culture tanks in which the recruits were previously held (see Guallart et al., Reference Guallart, Peña, Pérez-Larruscaín, Luque and Templado2020). Scale bar: A, 27 mm; B, 12 mm; C, 17 mm; D, 10 mm.

Phoresy in Patella ferruginea. (A) General view in April, 2006 of artificial removable substrata placed in September, 2005 on the shore of Chafarinas Islands to test techniques for handling specimens; (B) four Patella spp. recruits (arrows) including two recruits of P. ferruginea (larger arrows), detected at the beginning of April, 2006; (C) after the experimental transfer of a marked adult (orange mark) to the substratum (13 April 2006) these last two recruits (large arrows) spontaneously climbed on the shell of the adult, detected in a subsequent survey (29 June 2006); the only remaining Patella spp. specimen (small arrow) was still adhering to the substratum; (D) both recruits (large arrows) remained on the adult in August 2006, and the coverage of both the rock and shell of adults was similar consisting mainly of Chthamalus spp.; the recruit of Patella spp. in (C) had disappeared, leaving only its home-scar (small arrow). Scale bar: B, C, D, 100 mm.
Discussion
Recruitment
Data on the recruitment of Patella ferruginea are anecdotal and scattered in studies focused on other aspects of its biology and ecology. Publications where there is explicit reference to recruitment are mostly based on size‒frequency observations, considering recruits as individuals <30 mm (Espinosa, Reference Espinosa2009; Espinosa et al., Reference Espinosa, Rivera-Ingraham, Fa and García-Gómez2009b; Arroyo et al., Reference Arroyo, Moreno, Barrajón, de la Linde, Remón, de la Rosa, Fernández-Casado, Gómez, Ruiz-Giráldez, Vivas and Fernández2011; Meinesz & Dominici, Reference Meinesz and Dominici2015; Zarrouk et al., Reference Zarrouk, Romdhane and Espinosa2016), <25 mm (Rivera-Ingraham et al., Reference Rivera-Ingraham, Espinosa and García-Gómez2011a, Reference Rivera-Ingraham, Espinosa and García-Gómez2011b, Reference Rivera-Ingraham, Espinosa and García-Gómez2015a) or <20 mm (Rivera-Ingraham et al., Reference Rivera-Ingraham, Espinosa and García-Gómez2011c). The terms ‘young specimens’, ‘juveniles’ or ‘recruits’ were used by these authors, sometimes interchangeably; however, it was not specified what was meant by ‘recruitment’. The data presented in these studies also suggest that recruitment can vary greatly across locations. Here, we quantitatively described the seasonal occurrence and density of recruits of P. ferruginea in the Chafarinas Islands over a 17-year period (1999‒2015), although there are no data from 2000, 2004 and 2014. This is the longest monitoring of recruitment of P. ferruginea to date, as the one conducted in Ceuta (Strait of Gibraltar) by Rivera-Ingraham et al. (Reference Rivera-Ingraham, Espinosa and García-Gómez2015a) covered five years (2007‒2011). We found a regular recruitment over time, consistent with the dense and healthy population of P. ferruginea in these islands (Guallart & Templado, Reference Guallart and Templado2016), but showing a great interannual variability. Higher recruitment was observed in three of the studied years (2001, 2011 and 2012), with a maximum density of 69.07 recruits m−1 in one transect in 2012, compared with 11.71 recruits m−1 on average for the study period. The fact that recruitment was generally higher in transect 07 than the two other regularly monitored transects (02 and 12), especially at the 2001, 2011 and 2012 peaks, may be due to several factors: transect 07 is located in one of the areas with the greatest density of adults in the whole archipelago, the coast at this transect has a low slope giving it a large surface area for settlement, and it has a moderate‒high hydrodynamism but is protected from strong storms. During five years of monitoring (2007‒2011) in Ceuta, Rivera-Ingraham et al. (Reference Rivera-Ingraham, Espinosa and García-Gómez2015a) found a maximum recruitment (total number of juveniles <25 mm) in 2009, and considerable differences among transects and large interannual differences. The causes of this variability are not supported by direct evidence, but gamete production, fertilization success, or stochastic factors affecting dispersal of planktonic larval stages and settlement could lead to spatial and temporal variation in recruitment. Recruitment in P. ferruginea also seemed to be influenced by both the heterogeneity and nature of the substratum (Espinosa et al., Reference Espinosa, Rivera-Ingraham and García-Gómez2011; Guallart et al., Reference Guallart, Luque, Acevedo and Calvo2013b). Interannual fluctuations in recruitment have also been observed in other true and pulmonate limpets (e.g. Bowman & Lewis, Reference Bowman and Lewis1977, Reference Bowman and Lewis1986; Shanks et al., Reference Shanks, Walser and Shanks2014; Seabra et al., Reference Seabra, Hawkins, Espírito-Santo, Castro and Cruz2020) and are usual for marine species with complex life cycles (e.g. Roughgarden et al., Reference Roughgarden, Gaines and Possingham1988; Gaines & Bertness, Reference Gaines and Bertness1993). Such variation may be driven by local (waves, tides, wind, storms, water temperature, available and suitable substratum) and non-local abiotic factors, alongside biotic factors (behaviour, competition, predation), all of which can influence the arrival of larvae and subsequent survival of recruits in intertidal assemblages (Hutchinson & Williams, Reference Hutchinson and Williams2001).
Settlement itself was not observed in the present study because of the difficulty of finding very small (<4 mm; Guallart et al., Reference Guallart, Peña, Luque and Templado2017) and/or cryptic settlers in the field. The first detectable recruits (about 4 mm) began to be evident at the end of winter and their peak abundance was observed during spring. This is in accordance with the known reproductive season of P. ferruginea and particularly with the spawning period in the SE Alboran Sea, which takes place around mid-November (Frenkiel, Reference Frenkiel1975, Guallart et al., Reference Guallart, Calvo and Cabezas2006). The duration of the pelagic larval phase was estimated to be about 3‒4 days in culture tanks, but it can last between 7‒32 days, and up to 40 days (Guallart et al., Reference Guallart, Peña, Pérez-Larruscaín, Luque and Templado2020; Ferranti et al., Reference Ferranti, Guallart, Fanciulli, Panzalis and Chiantore2022). Since the spawning period may vary from early to late November depending on seawater temperature change and storm events, which are thought to trigger synchronized spawning (Frenkiel, Reference Frenkiel1975; Guallart et al., Reference Guallart, Calvo and Cabezas2006), peak settlement in the Chafarinas Islands is likely to occur during December. Thus, specimens settled during winter are hardly detectable until March, when they exceed 5 mm (Guallart et al., Reference Guallart, Peña, Luque and Templado2017). This is consistent with observations by Espinosa et al. (Reference Espinosa, Rivera-Ingraham and García-Gómez2011) in Ceuta, who pointed out that recruitment of P. ferruginea mainly occurred during spring, with a mean size of new recruits of around 7 mm. They also noted a high growth rate of recruits of about 2 mm month−1 until they reached a size of 20 mm. According to our results, we estimated that P. ferruginea reaches a mean size of around 18 mm at the end of its first year of life in the Chafarinas Islands, although we observed great variability in the growth rate (Guallart et al., Reference Guallart, Acevedo and Calvo2012), with a size range of 12‒27 mm. In laboratory observations, the growth rate of settlers during the first months was highly variable (Peña et al., Reference Peña, Guallart and Pérez-Larruscaín2013; Guallart et al., Reference Guallart, Peña, Luque and Templado2017, Reference Guallart, Peña, Pérez-Larruscaín, Luque and Templado2020; Ferranti et al., unpublished data). According to Guallart et al. (Reference Guallart, Peña, Pérez-Larruscaín, Luque and Templado2020), juveniles achieved 1–2.5 mm in more than 4–5 months, whereas Ferranti et al. (Reference Ferranti, Guallart, Fanciulli, Panzalis and Chiantore2022) found that same size was achieved after only 1.5–2.5 months. Ferranti et al. (Reference Ferranti, Guallart, Fanciulli, Panzalis and Chiantore2022) suggested that such faster growth rate may be ascribed to differences in food availability (quality and quantity of biofilm on culture tanks) or temperature. In both cases these growth rates seem to be lower than in natural environments, which might be attributed to the lack of other natural conditions typical of the midlittoral habitat (waves, sunlight) in the culture tanks.
Recruits were not homogeneously distributed along the coastline of the islands. The input of competent larvae reaching the islands' shoreline and local hydrodynamic factors (e.g. currents, waves) at the time of settlement may determine in the first instance the location of settlers, followed by the presence of favourable habitat, together with selective settlement. In this regard, it would be important to elucidate whether recruitment is primarily mediated by competition (inter- or intraspecific) or by facilitation, because there can be several possible factors that could cause a negative or positive association between adults and recruits (Nakin & McQuaid, Reference Nakin and McQuaid2016).
Our results do not show a significant correlation between density of recruits and adults in the 15 studied transects in 2005. However, these data only were from one year with a relatively low recruitment (2005), so it is not a representative year. Conversely, Rivera-Ingraham et al. (Reference Rivera-Ingraham, Espinosa and García-Gómez2015a) pointed out a significant positive linear correlation between the number of recruits and adult P. ferruginea and suggested that recruitment is related to the number of adults, although this correlation was only clearly significant (P < 0.001) in the year of maximum recruitment (2009). Previously, Rivera-Ingraham et al. (Reference Rivera-Ingraham, Espinosa and García-Gómez2011c) suggested that the presence of gamma-aminobutyric acid (GABA) may not only enhance recruitment in this species, but also might accelerate it, and that this compound may have similar effects on recruitment to the presence of adult conspecifics. Rivera-Ingraham et al. (Reference Rivera-Ingraham, Espinosa and Krock2015b) verified that GABA was present in the mucus secreted by the foot of adults of P. ferruginea.
It has not been proven whether the presence of other species could induce settlement in P. ferruginea. It has long been suggested that crustose coralline algae may induce the settlement of larvae of some patellid species, based on the spatial patterns of distribution of the smallest field-detectable recruits (e.g. McGrath, Reference McGrath1992; Delany et al., Reference Delany, McGrath, O'Riordan, Myers and Myers2002; Seabra et al., Reference Seabra, Cruz, Fernandes, Silva and Hawkins2019; Castejón et al., Reference Castejón, Nogueira and Andrade2022). We found all specimens <5 mm on the irregular surface covered by the gregarious vermetid gastropod Dendropoma lebeche and the crustose coralline algae Neogoniolithon brassica-florida at the lower midlittoral level. Recruits >8‒10 mm can be found also at this fringe, but the majority of them were found on an upper level characterized by the barnacle Chthamalus spp. (upper midlittoral) and they share this habitat with adult specimens (Guallart et al., Reference Guallart, Peña, Luque and Templado2017). These observations partially agree with the suggestion of Laborel-Deguen & Laborel (Reference Laborel-Deguen, Laborel, Boudouresque, Avon and Gravez1991b) that the very first benthic stages of P. ferruginea live at lower intertidal levels compared with adults. The lower shore distribution pattern of juveniles with regard to adults has been pointed out in different limpet species (Branch, Reference Branch1975a, Reference Branch1975b, Reference Branch1981; Delany et al., Reference Delany, Myers and McGrath1998; Kay, Reference Kay2002; Silva et al., Reference Silva, Boaventura and Ré2003; Nakin & McQuaid, Reference Nakin and McQuaid2016). According to these authors, this distribution trend might safeguard the most susceptible small recruits from the physical stresses of the adult habitat (higher temperatures and desiccation) and to some extent, to avoid size-class competitive interactions. Limpet species showing an ontogenetic habitat shift were included by Branch (Reference Branch1975a, Reference Branch1975b, Reference Branch1981) in the category he termed ‘migratory’. This author suggested that migratory habit in those mid- to high-shore species spatially separates animals of different ages and reduces competition (see discussion under phoresy).
Since the first recruits were found just over three months after the estimated date of settlement, their observed distribution may be established by migration to another habitat after settlement. Furthermore, differential mortality of settlers in different microhabitats may also influence recruit distribution. Mortality of newly settled benthic invertebrates is usually very high (Hunt & Scheibling, Reference Hunt and Scheibling1997) and it can exceed 90%, according to Gosselin & Qian (Reference Gosselin and Qian1997). In short, it is not yet known where settlement occurs in P. ferruginea and what cues are involved. Both selective settlement and post-settlement migration in addition to differential mortality could determine the distribution of recruits at small temporal and spatial scales. Recruits represent the surviving settlers, perhaps those that have managed to reach the most favourable habitat, and recruitment thus combines settlement with early mortality up to the time of the first census. Thus, the decrease in recruits density we observed in summer may be due to an increase in mortality due to higher air temperatures and an increased risk of desiccation.
Our results also show that analyses using 1 mm size-classes allow for a better definition of cohorts and refinement of important parameters compared with analyses using 5 mm size-classes: mean size (for growth studies) and density (for mortality/survival studies). However, this type of detailed analysis is more time consuming and requires a greater sampling effort, and is therefore not always logistically possible.
An important aspect concerns the origin of recruits. The degree to which adult population density affects recruitment density is influenced by not only the attraction of recruits to conspecifics, but also by how demographically open or closed a population is (Nakin & McQuaid, Reference Nakin and McQuaid2016). According to Henriques et al. (Reference Henriques, Delgado, Souza and Ray2017), limpet populations cannot be considered fully open or fully closed, since some local larval retention is likely to occur despite larval dispersal. Estimating the extent to which a local population is open/closed or source/sink requires knowing the location of possible source populations, the factors related to larval transport and detailed genetic studies. These aspects and the extent of the connectivity are still unknown in P. ferruginea and should be studied in the future.
Cossu et al. (Reference Cossu, Scarpa, Dedola, Sanna, Lai, Cristo, Curini-Galletti, Panzalis, Navone, Careddu, Congiatu, Mura, Fois and Casu2017), in a study using microsatellite loci, pointed out a high percentage of self-recruitment in populations of P. ferruginea in Sardinia, and that the scale of dispersal can exceed 10 km. Among populations of P. ferruginea along the Mediterranean coasts of N Africa, a genetic divergence between western and eastern groups of Algerian localities was detected (Bouzaza et al., Reference Bouzaza, Vera and Mezali2021), which may indicate the existence of barriers to dispersal. Nevertheless, despite the relatively short planktonic phase, and therefore the supposed limited dispersal capacities, the available data seem to indicate that the larval dispersal capacity of P. ferruginea may be greater than expected, probably due to sporadic long-distance dispersal events. The presence of isolated specimens found more than 200 km away from established populations of this limpet, such as in the Hormigas Islands (eastern Spain) (Espinosa et al., Reference Espinosa, Maestre and García-Gómez2009a; Templado et al., Reference Templado, Guallart, Luque, Calvo and Acevedo2018), and Liguria (Ferranti et al., Reference Ferranti, Monteggia, Asnaghi, Dagnino, Gaino, Moretto, Parodi, Tixi, Cappanera, Valerani, Bava and Chiantore2019), could be evidence of such occasional long-distance dispersal events. It should be noted that Ribeiro (Reference Ribeiro2008), combining the reproductive characteristics of some European limpet species with the general system of currents, estimated that larval dispersal can exceed 200 km in Patella depressa, although the number of larvae decreased sharply with distance.
The dispersal of Patella ferruginea may be a stepwise progression, with a substantial percentage of self-recruitment and eventual dispersive events at variable distances, as has been reported for other littoral gastropods with a similar short planktonic larval stage (e.g. Gibbula divaricata), or direct development (e.g. Dendropoma lebeche) (López-Márquez et al., Reference López-Márquez, Cushman, Templado, Wan, Bothwell and Machordom2021). Important recruitments have been recorded in some of the dense populations (‘hotspots’) of P. ferruginea along N African coasts, such as those in Ceuta (Strait of Gibraltar, Espinosa, Reference Espinosa2009; Rivera-Ingraham et al., Reference Rivera-Ingraham, Espinosa and García-Gómez2011a, Reference Rivera-Ingraham, Espinosa and García-Gómez2015a), Melilla (Guallart et al., Reference Guallart, Luque, Acevedo and Calvo2013b) and the Chafarinas Islands (Guallart & Templado, Reference Guallart and Templado2016), and Gazhaouet (Frenkiel, Reference Frenkiel1975), the islands of Rachgoun, Habibas and Plane (Paloma) in Algeria (Boumaza & Semroud, Reference Boumaza and Semroud2001; Espinosa, Reference Espinosa2009; PNUE/PAM-CAR/ASP, Reference Ramos Esplá, Benabdi, Sghaier, Forcada Almarcha, Valle Pérez and Ouerghi2016; Kallouche et al., Reference Kallouche, Benaissa, Rouane-Hacene, Soufi, Bouderbala, Bouras and Mouffok2020), as well as Zembra Island in Tunisia (Zarrouk et al., Reference Zarrouk, Romdhane and Espinosa2016). Within the SE Alboran Sea, it can be expected that some populations are genetically interconnected through a flow of larvae that may vary from year to year depending on the environmental conditions (e.g. direction of the storm at the time of spawning, main currents in the days or weeks immediately after the spawning). The ‘hotspots’ of P. ferruginea in this area, separated by a distance of about 100 km or less (from Chafarinas, Melilla is about 45 km to the west, and Gazhaouet, Rachgoun and the Habibas Islands, 52, 88 and 133 km to the east, respectively) could allow connectivity among these populations. However, larval dispersal and connectivity in P. ferruginea should be elucidated in future studies.
Phoresy
Observations of so-called phoresy by Laborel-Deguen & Laborel (Reference Laborel-Deguen and Laborel1990, Reference Laborel-Deguen, Laborel, Boudouresque, Avon and Gravez1991b) led these authors to hypothesize that adult specimens of P. ferruginea could somehow induce a selective settlement of larvae on their shells. We frequently observed recruits on adult limpets (Guallart et al., Reference Guallart, Acevedo and Templado2011, Reference Guallart, Peña, Luque and Templado2017; this paper). Nevertheless, our observations suggest that juveniles climb on the shell of adults some time after settling on the substratum. Thus, phoresy in P. ferruginea may be mainly the result of movements after settlement that would favour the access of young individuals to resources (space and food), contrary to the hypothesis of a selective settlement of larvae on adults. A high presence of small specimens over large ones has been observed in other patellogastropod limpets, such as Scutellastra cochlear (Born, 1778) (Branch, Reference Branch1975a, Reference Branch1975b, Reference Branch1981), S. flexuosa (Quoy & Gaimard, 1834) (Lindberg, Reference Lindberg2007) or S. kermadecensis (Pilsbry, 1894) (Kim et al., Reference Kim, Liggins and Aguirre2021). According to Branch (Reference Branch1975a, Reference Branch1975b, Reference Branch1981) adults may have an adverse effect on the survival of recruits, with the highest proportions of juveniles on adult shell in the densest populations. Branch (Reference Branch1981) also commented that juveniles reaching a size too large to occupy shells must descend to the rock, and this makes them vulnerable until they establish a new home scar, with high mortality occurring during this period by the indirect effect of increased density. Underwood et al. (Reference Underwood, Denley and Moran1983) suggested that juvenile limpets might have different habitat preferences than adults, or the larger specimens may be responsible for the mortality of the smaller specimens. Competitive interaction between size-classes has been pointed out in Patella depressa Pennant, 1777 (Boaventura et al., Reference Boaventura, Da Fonseca and Hawkins2003). Kim et al. (Reference Kim, Liggins and Aguirre2021) found that the size at which the so-called ‘piggy-backing’ individuals transitioned to being rock-attached was not influenced by the available rock space. These authors also found that larger limpets were more likely to have ‘piggies’, they had more ‘piggies’, and the ‘piggies’ were larger, and suggested that P. kermadecensis are motivated to piggy-back by the properties of the social environment rather than space constraints. According to Kim et al. (Reference Kim, Liggins and Aguirre2021), this behaviour may be a mechanism to avoid bulldozing by larger limpets, to access grazing opportunities on the shells of larger limpets, and/or to monopolize breeding opportunities with larger rock-attached females.
Young phoretic specimens of P. ferruginea would have two of the three advantages suggested by Kim et al. (Reference Kim, Liggins and Aguirre2021) over young specimens attached to the substratum: (1) they would avoid being dislodged by larger limpets in their trophic movements, especially in zones with high density of individuals, like the Chafarinas Islands; (2) intraspecific competition with adults would be reduced, since ‘phoretic’ juveniles could use the microalgal coverage on the adult shell (similar to that of littoral rocks) as a food resource that would otherwise not be exploited. Nevertheless, it is unlikely that phoretic behaviour can maximize the reproductive output in P. ferruginea. Though phoretic specimens were most commonly found on potentially adult females ranging from 45‒60 mm, most of them (95.88%) were recruits <20 mm, and rarely exceed 30 mm, the size from which they first mature as males. Since part of the mortality of recruits could be due to intraspecific competition with adults, our hypothesis is that small ‘phoretic’ limpets would have a higher survival rate than those attached to littoral rocks.
Conclusions and suggestions
A regular recruitment of Patella ferruginea was observed in the Chafarinas Islands, coupled with a high density of adults of a wide range of sizes and wide distribution along almost the entire coastline.
We emphasize that any study on recruitment should clearly define recruitment, and that it should not be equated with settlement. We propose that recruitment in P. ferruginea should refer to the addition of new specimens to the populations in each annual cycle (cohort 0+). Since at the end of the first year of life juveniles reach an average size of about 18 mm (range 12‒27 mm), we propose that specimens <20 mm be considered recruits as a standard methodological approach to monitoring recruitment of this species, since some of the specimens between 20 and 30 mm could be recruits from the previous year (cohort 1+).
Since recruitment monitoring aims to estimate the number of individuals that have settled and persist at the end of each annual cycle, as well as interannual variation, we propose that censuses are carried out in spring (from late March) and after summer (September). This would allow: (1) sufficient time after spawning for recruits to reach a size at which they are detectable; (2) studies of mortality during the first year of life following the period when it is likely to be highest (summer). We also recommend (where possible) to use 1 mm interval size classes for size‒frequency analyses of recruits, particularly if the data are to be used to assess growth and survival.
The larval phase of Patella ferruginea in the water column remains the ‘black box’ in our understanding of the life cycle of this limpet despite its importance for conservation purposes. Optimal conservation of marine species involves not only ensuring the survival of adult specimens (or benthic phases of the life cycle), but also maintaining recruitment dynamics. Thus, further studies on larval supply, settlement, and early post-settlement mortality are crucial to provide information about how they influence recruitment.
Data
All relevant data generated during this study are included within the article, and datasets used are available from the corresponding author on request.
Acknowledgements
We thank the Dirección General de Conservación de la Naturaleza of the Spanish Ministerio de Agricultura, Alimentación y Medio Ambiente (MAGRAMA) for permission to study a species protected by Spanish laws. We are also indebted to Javier Zapata and the staff of the Biological Station of the Chafarinas Islands, the Spanish Ministerio de Defensa and the military personnel on the islands for the facilities provided during the fieldwork. The authors also thank Iván Acevedo, Marta Calvo, Annie Machordom and Patricia Cabezas (MNCN-CSIC) and Javier Díaz (Melilla) and Juanjo Villalón (Melilla) for their valuable contribution to logistics or fieldwork. We also thank the anonymous reviewers for their careful reading of our manuscript and their useful comments and suggestions.
Author contributions
J.G., J.T. and Á.A.L. conceived the original idea, J.G. conducted the fieldwork and took all the photographs. All authors co-drafted the manuscript together, and wrote, read and approved the final version of the manuscript.
Financial support
This work was funded by the project ‘Action plan for viability proposals of the endangered limpet, Patella ferruginea’, within Proyectos Cero on Endangered Species of the Spanish Research Council CSIC Foundation, and former contracts by the Organismo Autónomo Parques Nacionales and the Dirección General de Conservación de la Naturaleza of the Spanish Ministerio de Agricultura, Alimentación y Medio Ambiente (MAGRAMA).
Conflict of interest
The authors declare that they have no conflict of interests.
Ethical standards
All applicable international, national and/or institutional guidelines for the use and handling of specimens were followed. All necessary permits for sampling and field studies have been obtained from the competent authorities.