Introduction
Recognized by the World Health Organization as the sixth leading cause of disability in the world (Murray & Lopez, Reference Murray and Lopez1996), bipolar disorder (BD) is marked by significant morbidity and mortality. More than 90% of individuals diagnosed with BD report multiple affective episodes across their lifetime, and data suggest that those with BD will remain symptomatically ill for approximately 50% of their life (Judd et al. Reference Judd, Akiskal, Schettler, Endicott, Maser, Solomon, Leon, Rice and Keller2002). Perhaps most alarming, BD is associated with significant suicide risk. Individuals with BD are 20 times more likely than those in the general population to attempt suicide, and approximately 15% of individuals with BD die from suicide (Tondo et al. Reference Tondo, Isacsson and Baldessarini2003). Given this clinical picture, methods to improve proper identification of BD represent an important priority.
Indeed, BD can be remarkably difficult to identify and diagnose. Between 69% and 73% of patients are initially misdiagnosed (Ghaemi et al. Reference Ghaemi, Boiman and Goodwin2000), with an average of 6 years from initial presentation for treatment to a correct diagnosis (Hirschfeld et al. Reference Hirschfeld, Lewis and Vornik2003). Although not an exhaustive list, common explanations for such misdiagnosis include the presence of a major depressive versus manic episode at illness onset, failure to remit between affective episodes, the typically depression-predominant course of BD, and the presence of frequent co-morbid conditions, especially substance use disorders (SUDs), which may complicate the identification of mood symptoms. As noted by Agrawal et al. (Reference Agrawal, Nurnberger and Lynskey2010), clinicians have the benefit of following patients over time to arrive at a correct diagnosis. Yet in the cross-sectional epidemiologic context, proper identification of BD relies on psychometrically robust diagnostic criteria for the episodes that define the presence of the disorder.
Despite this need, it remains unclear to what extent the diagnostic criteria for mania are good indicators of underlying mania severity, or even if there is a single liability dimension that represents mania itself. To date, the literature has largely focused on factor analytic investigations, the results from which have been difficult to integrate as studies have converged on anywhere from one- to seven-factor solutions (see Gupta et al. Reference Gupta, Sinha, Praharaj and Gandotra2009; Prisciandaro & Roberts, Reference Prisciandaro and Roberts2011). This ambiguity in findings may be due to the variability in statistical methods applied, in addition to the heterogeneity in and number of symptoms selected for evaluation, several of which extend beyond the core DSM-IV diagnostic criteria for mania (APA, 1994), such as depression and psychosis. Interpretation of these data is further complicated by an almost exclusive focus on clinical samples, which does not allow for the evaluation of diagnostic criteria at the less severe end of the mania spectrum.
To this end, the application of methods based in item response theory (IRT; Lord, Reference Lord1980) has several strengths that may advance an understanding of manic symptom expression (Weinstock et al. Reference Weinstock, Strong, Uebelacker and Miller2010). In particular, IRT relies on the estimation of latent models such that a given symptom's psychometric performance can be evaluated along the full spectrum of underlying mania severity. Furthermore, because IRT can estimate the likelihood that a particular symptom will be endorsed at a particular level of mania severity, differences in patterns of symptom endorsement between relevant clinical subgroups can be evaluated while equating for underlying mania severity.
In the context of mood disorders, several studies have used IRT methods to evaluate the psychometric properties of the DSM-IV major depression criteria (Aggen et al. Reference Aggen, Neale and Kendler2005; Simon & Von Korff, Reference Simon and Von Korff2006; Balsis & Cully, Reference Balsis and Cully2008; Uebelacker et al. Reference Uebelacker, Strong, Weinstock and Miller2009; Carragher et al. Reference Carragher, Mewton, Slade and Teesson2011). However, comparatively fewer studies have used IRT to evaluate the phenomenology of mania (Henry et al. Reference Henry, Pavuluri, Youngstrom and Birmaher2008; Cassano et al. Reference Cassano, Mula, Rucci, Miniati, Frank, Kupfer, Oppo, Calugi, Maggi, Gibbons and Fagiolini2009; Freeman et al. Reference Freeman, Youngstrom, Freeman, Youngstrom and Findling2011) and only one has evaluated criterion-level performance in an adult sample (Agrawal et al. Reference Agrawal, Nurnberger and Lynskey2010). In their study, Agrawal and colleagues relied upon data from the National Epidemiologic Survey of Alcohol and Related Conditions (NESARC; Grant et al. Reference Grant, Dawson, Stinson, Chou, Kay and Pickering2003) and the National Comorbidity Survey Replication (NCS-R; Kessler et al. Reference Kessler, Chiu, Demler, Merikangas and Walters2005) to conduct item response analyses of the DSM-IV criterion B mania symptoms. In contrast to prior studies that have used large item sets that extend beyond the core definition of mania (e.g. Cassidy et al. Reference Cassidy, Forest, Murry and Carroll1998; Sato et al. Reference Sato, Bottlender, Kleindienst and Möller2002; Picardi et al. Reference Picardi, Battisti, de Girolamo, Morosini, Norcio, Bracco and Biondi2008), the results from this study confirmed a unidimensional (i.e. single factor) liability distribution that represents underlying mania severity. Although the majority of symptoms (e.g. flight of ideas, distractibility and increased goal-oriented activities) performed well in terms of indexing mania severity, certain symptoms such as grandiosity were found to have less utility. Furthermore, decreased need for sleep evidenced poor discrimination in the NCS-R. The authors concluded that additional studies which replicate and extend these findings are needed, especially as data from US samples may not generalize to other populations.
In an attempt to further advance this line of research, the primary aim of the current study was to evaluate the psychometric properties of the DSM-IV criterion B mania symptoms in an international epidemiologic sample of individuals. The use of nationally representative data offers advantages over clinical samples that typically display a restricted range of symptomatology and a motivation toward treatment that hampers the generalizability of findings. Epidemiologic samples complete the spectrum of disease in the population and, in tandem with the large number of people surveyed, ensure that the results obtained are representative of the general population rather than unique to any particular setting. For such reasons, Robins (Reference Robins2004) argues that epidemiological data sets are crucial as they provide the strongest test of any classification system. In the current study, using methods grounded in IRT, analyses were conducted on data from the Australian 2007 National Survey of Mental Health and Wellbeing (NSMHWB). Given that mania frequently co-occurs with the presence of SUDs (Grant et al. Reference Grant, Stinson, Dawson, Chou, Dufour, Compton, Pickering and Kaplan2004) and SUDs can impact manic symptom expression (Tohen et al. Reference Tohen, Greenfield, Weiss, Zarate and Vagge1998), the secondary aim of this study was to evaluate differences in symptom expression (differential item functioning, DIF) between mania respondents with and without a SUD diagnosis. This is the first study in the Australian general population, and only the second internationally, to empirically evaluate the psychometric performance of the DSM-IV criterion B mania symptoms using epidemiological data. With preparations for DSM-5 underway, structural investigations of this kind are especially timely.
Method
Participants
The 2007 NSMHWB is a nationally representative, face-to-face survey of 8841 individuals aged 16–85 years. The target population was residents in private dwellings across all States and Territories in Australia. A random sample of private dwellings was identified using a stratified, multistage area probability sampling technique. Those residing in special dwellings (e.g. hospitals, nursing homes, jails, hostels) and those living in remote and sparsely populated areas of Australia were excluded from the survey. Fieldwork for the survey was conducted by trained interviewers from the Australian Bureau of Statistics (ABS) between August and December 2007. Interviews took place in respondents' homes and took an average of 90 min. The overall response rate was 60%. A more detailed discussion of the sampling design and survey methodology is available elsewhere (Slade et al. Reference Slade, Johnston, Oakley Browne, Andrews and Whiteford2009).
Assessment of mania
Respondents were interviewed about their experience of DSM-IV-defined mania symptomatology using a modified version of the World Mental Health Composite International Diagnostic Interview (WMH-CIDI 3.0; Kessler & Üstün, Reference Kessler and Üstün2004). In the 2007 NSMHWB, the estimated lifetime prevalence of mania was 0.7% (s.e. = 0.1). Specifically, the WMH-CIDI comprises two gate questions that determine entry into the mania and hypomania modules: (1) ‘Some people have periods lasting four days or longer when they feel much more excited and full of energy than usual. Their minds go too fast. They talk a lot. They are very restless or unable to sit still and they sometimes do things that are unusual for them, such as driving too fast or spending too much money. Have you ever had a period like this lasting several days or longer?’; and (2) ‘Have you ever had a period lasting four days or longer when most of the time you were so irritable that you either started arguments, shouted at people, or hit people?’ (To distinguish between manic and hypomanic episodes, respondents were queried about the duration of the episode and related hospitalizations.) The mania analyses focused on those respondents who responded positively to experiencing such a period of abnormally and persistently elevated, expansive or irritable mood for at least 1 week (criterion A) and were subsequently queried about their mania symptoms. Of these 666 respondents, 43 respondents had missing data across the mania symptom items; for consistency, the analyses here are based on 623 respondents who had complete data across the variables of interest. In total, 14 items operationalized the DSM-IV criterion B mania symptoms: grandiosity (two items), decreased need for sleep (one item), talkativeness (one item), flight of ideas (one item), distractibility (two items), increased goal-oriented activities (four items), and activities with painful consequences (three items).
The subsample under investigation had a mean age of 34.7 years (s.e. = 0.8) and 50.3% males (s.e. = 2.7). In terms of marital status, the majority were never married (55.6%, s.e. = 2.9), whereas 27.8% were married or de facto (s.e. = 2.5), and 16.6% (s.e. = 1.8) were separated, divorced or widowed. More than three-quarters were born in Australia (77.3%, s.e. = 2.3), 54.4% (s.e. = 2.3) had a post-school qualification and 70.7% (s.e. = 2.3) were employed. A small proportion reported a history of homelessness (11.2%, s.e. = 1.5) or incarceration (5.1%, s.e. = 1.1). In terms of SUD diagnostic status, 314 respondents had a lifetime DSM-IV SUD diagnosis whereas 309 respondents did not have a lifetime SUD diagnosis.
Analytic plan
The NSMHWB data were derived by complex survey design procedures. Because of ABS confidentiality concerns, information on primary sampling units and stratification were not provided; instead, replicate weights were supplied. Most structural equation modeling programs cannot accommodate complex sampling design information (Stapleton, Reference Stapleton2008); although the current iteration of Mplus is able to take replicate weights into account in the estimation of standard errors, traditional fit statistics have not yet been developed in the case of replicate weights. Given that the respective formulas for these measures do not take variance into account, it seems unlikely that these indices would alter if replicate weights were included. Accordingly, analyses (where possible) took account of the person weight but not the replicate weights. This approach is similar to previous analyses of the NSMWHB (e.g. Proudfoot et al. Reference Proudfoot, Baillie and Teesson2006; Baillie & Teesson, Reference Baillie and Teesson2010; Carragher et al. Reference Carragher, Mills, Slade, Teesson and Silove2010). Indeed, Muthén et al. (Reference Muthén, Grant and Hasin1993) argue that this analytic approach, which assumes simple random sampling, is acceptable because multivariate techniques are generally less sensitive to complex sampling features than univariate methods.
Unidimensionality assumption
Unidimensional IRT models assume that one common latent trait (θ) accounts for variation among individual items (i.e. DSM-IV criterion B mania symptoms in the present context). Given recent support in the literature for unidimensionality of DSM-defined mania (Agrawal et al. Reference Agrawal, Nurnberger and Lynskey2010; Prisciandaro & Roberts, Reference Prisciandaro and Roberts2011), a one-factor model was fit to the subsample and to the two subgroups differentiated according to SUD status. Confirmatory factor analysis (CFA) was implemented in Mplus version 6 (Muthén & Muthén, Reference Muthén and Muthén1998–Reference Muthén and Muthén2011) using a weighted least squares mean and variance adjusted estimator (WLSMV). Tetrachoric correlations were used to represent the relationship between the symptoms. Model fit was evaluated using the χ2 statistic, Comparative Fit Index (CFI; Bentler, Reference Bentler1990), Tucker–Lewis Index (TLI; Tucker & Lewis, Reference Tucker and Lewis1973), and root mean square error of approximation (RMSEA; Steiger, Reference Steiger1990). Non-significant χ2 values indicate good model fit. Recommendations in the extant literature suggest that TLI and CFI values ⩾0.90 reflect acceptable fit and values ⩾0.95 imply very good fit (Hu & Bentler, Reference Hu and Bentler1998; Vandenberg & Lance, Reference Vandenberg and Lance2000). Furthermore, RMSEA values <0.05 indicate close model fit; values up to 0.08 suggest a reasonable error of approximation in the population; and values >0.10 indicate poor fit (Browne & Cudeck, Reference Browne and Cudeck1992). The fit indices were assessed collectively, such that a single index that fell just outside the acceptable range was not necessarily considered to reflect poor model fit provided that the other statistics indicated good model fit (Brown, Reference Brown2006; Wolf et al. Reference Wolf, Millier and Brown2011).
IRT model
Having satisfied the unidimensional assumption, a two-parameter logistic model (2PL; Birnbaum, Reference Birnbaum, Lord and Novick1968) was used to describe the relationship between the observed responses to the DSM-IV criterion B mania symptoms and the underlying latent trait (i.e. mania severity). This model yields discrimination (a) and severity or threshold (b) parameters for each symptom. The discrimination parameter a captures how well a symptom distinguishes between respondents at different levels along the latent continuum; larger parameter estimates denote symptoms with greater discrimination. The severity parameter b indicates a symptom's location along the latent continuum (x axis) and describes the point at which respondents have a 50% probability of endorsing the symptom; high threshold values reflect symptoms that are endorsed infrequently and are more severe. These parameters may be depicted graphically as item response functions or item characteristic curves (ICCs). The discrimination parameter is conveyed through the steepness of the ICC slope at its inflection point; steep slopes reflect symptoms with greater discrimination. The severity parameter displaces the curve from left to right along the x axis as the symptom increases in severity.
Reliability
Within the IRT framework, the test information function (TIF, also called the test information curve) and test standard error of measurement (SEM) summarize the combined information of the seven symptoms at different levels of the latent trait (mania). Specifically, as an index of reliability, the TIF reflects the squared precision of measurement whereas the SEM represents imprecision of measurement (Krueger & Finger, Reference Krueger and Finger2001; Edelen & Reeve, Reference Edelen and Reeve2007). The SEM is the inverse square root of the TIF, meaning that as information for a given latent trait level decreases, the SEM increases. The peak of the TIF represents the point at which the seven aggregated symptoms provide the most precision in estimating mania. For instance, if the curve is peaked at the mild end of the mania continuum, this would indicate that seven symptoms are very accurate in measuring subtle distinctions in the trait levels of respondents with mild levels of mania, but not high levels of mania severity. All IRT analyses were implemented in multilog 7.03 (Thissen, Reference Thissen2003) using marginal maximum likelihood (MML) estimation.
DIF
The IRT likelihood-ratio test for differential item functioning program irtlrdif (Thissen, Reference Thissen2001) was used to assess whether the DSM-IV criterion B mania symptoms function equivalently for those with and without a SUD diagnosis. Within this framework, DIF is said to occur when the a or b parameter associated with a given symptom differs significantly across groups, after controlling for the underlying trait under investigation (Edelen et al. Reference Edelen, Thissen, Teresi, Kleinman and Ocepek-Welikson2006).
Analyses began by identifying a set of anchor items; anchor items are assumed to be free of DIF and are used to match the two groups with respect to the underlying latent trait. Analyses proceeded through an iterative approach (Edelen et al. Reference Edelen, Thissen, Teresi, Kleinman and Ocepek-Welikson2006), which has been supported in simulation studies elsewhere (Woods, Reference Woods2009). Specifically, all seven DSM-IV criterion B mania symptoms were submitted for analysis and each symptom was tested for the presence of DIF using the remaining symptoms as the temporary anchor set. For each symptom, the likelihood-ratio test statistic (G 2) was generated; G 2 evaluates the difference in fit between a model where the a and b parameters are constrained to equality between the two groups with a model where the parameters for the studied item are freed and estimated separately between the two groups. If the G 2 statistic exceeded 3.84 (i.e. the critical value associated with α = 0.05 in a χ2 distribution with 1 degree of freedom), the symptom was considered to potentially exhibit DIF in one or both parameters. An α level of 0.05 was used to guard against Type II error and yield a conservative set of anchor items (Edelen et al. Reference Edelen, Thissen, Teresi, Kleinman and Ocepek-Welikson2006). Symptoms identified as potentially exhibiting DIF were removed and the remaining symptoms were reanalyzed. This process was repeated until no more symptoms were flagged for DIF. The final set of symptoms free of DIF formed the purified anchor set, and the remaining symptoms formed the target or study items.
The next stage involved testing the target items against the purified anchor set. The likelihood-ratio test statistic was again used to gauge statistical significance. If the G 2 statistic exceeded 3.84, follow-up tests were conducted on the individual parameters to determine whether DIF was present in the a or b parameter. Specifically, DIF in the a parameter indicates that the extent to which a symptom is related to the latent trait varies according to SUD diagnostic status. DIF in the b parameter indicates that a symptom displays unequal levels of severity according to SUD diagnostic status (Gelhorn et al. Reference Gelhorn, Hartman, Sakai, Mikulich-Gilbertson, Stallings, Young, Rhee, Corley, Hewitt, Hopfer and Crowley2009). Because multiple comparisons increase the risk of Type I error, the Benjamini–Hochberg procedure (Benjamini & Hochberg, Reference Benjamini and Hochberg1995; Thissen et al. Reference Thissen, Steinberg and Kuang2002) was used to adjust p values. Given the large sample size involved, minor differences between groups may be statistically significant. Accordingly, an a priori difference ⩾0.25 in severity (i.e. small effect size) was selected to represent a clinically meaningful difference and ICCs were chosen to evaluate clinical significance in the discrimination parameters (cf. Uebelacker et al. Reference Uebelacker, Strong, Weinstock and Miller2009; Weinstock et al. Reference Weinstock, Strong, Uebelacker and Miller2009). Final item parameter estimates for the two groups were estimated using multilog, and fit plots were derived from MODFIT (Stark, Reference Stark2001).
Results
Unidimensionality of mania
CFA was used to assess the unidimensionality assumption underlying IRT. Fit indices suggested that a one-factor model provided a good fit to the data [χ2 (14) = 40.74, p < 0.05, RMSEA = 0.06, CFI = 0.93, TLI = 0.89]. In terms of the parameter estimates, factor loadings were all salient (ranging from 0.44 for decreased need for sleep to 0.76 for grandiosity) and statistically significant (p < 0.05). A one-factor model exhibited good fit to the mania sample with a SUD diagnosis [χ2 (14) = 26.49, p < 0.05, RMSEA = 0.05, CFI = 0.92, TLI = 0.88] and to the mania sample without a SUD diagnosis [χ2 (14) = 29.75, p < 0.05, RMSEA = 0.060, CFI = 0.93, TLI = 0.90]. Similarly, factor loadings were all salient and statistically significant. These findings provided support for the use of a unidimensional IRT model.
IRT analysis
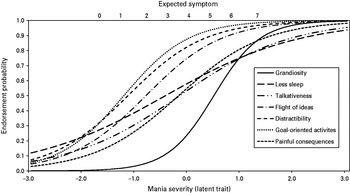
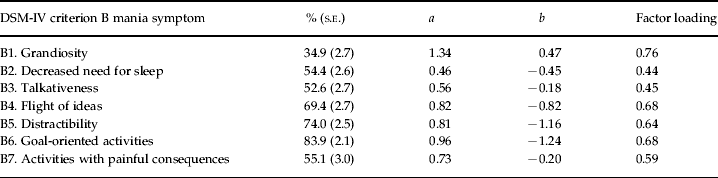
Table 1 outlines the endorsement frequencies, IRT parameter estimates and standardized loadings for the seven DSM-IV criterion B mania symptomsFootnote 1Footnote †. Increased goal-oriented activities (83.9%) was the most commonly endorsed symptom whereas grandiosity (34.9%) was the least commonly endorsed symptom (cf. Agrawal et al. Reference Agrawal, Nurnberger and Lynskey2010). Discrimination was greatest for grandiosity (cf. Agrawal et al. Reference Agrawal, Nurnberger and Lynskey2010) and, as denoted by the low factor loading, discrimination was lowest for the decreased need for sleep symptom. To aid interpretation, the corresponding ICCs are presented in Fig. 1. As illustrated by their densely clustered ICCs, the flight of ideas and distractibility symptoms had similar discrimination parameters, suggesting that they provide redundant psychometric information. With regard to the severity parameters, the increased goal-oriented activities symptom tapped the mild end of the mania continuum whereas the grandiosity symptom fell at the severe end of the continuum (cf. Agrawal et al. Reference Agrawal, Nurnberger and Lynskey2010). Interpretation of severity is related to the population under investigation. As mentioned earlier, treated samples tend to comprise more severely affected individuals (Kendler et al. Reference Kendler, Eaves, Walters, Neale, Heath and Kessler1996); given that the sample used here was derived from the general population and so includes individuals reporting symptoms across the spectrum of mania severity, it is not surprising that the severity parameters are generally negative reflecting the mild end of the latent continuum. Severity is therefore relative and accordingly, in the present context, the severe of the continuum is represented by grandiosity. These observations are consistent with other IRT investigations of DSM-IV mood disorders in epidemiological samples (cf. Uebelacker et al. Reference Uebelacker, Strong, Weinstock and Miller2009; Weinstock et al. Reference Weinstock, Strong, Uebelacker and Miller2009, Reference Weinstock, Strong, Uebelacker and Miller2010).
Item characteristic curves of the seven DSM-IV criterion B mania symptoms for eligible respondents in the Australian 2007 National Survey of Mental Health and Well-Being (NSMHWB, n = 623).

Endorsement frequencies, IRT parameter estimates and standardized factor loadings of the DSM-IV criterion B mania symptoms for eligible respondents in the 2007 NSMHWB (n = 623)
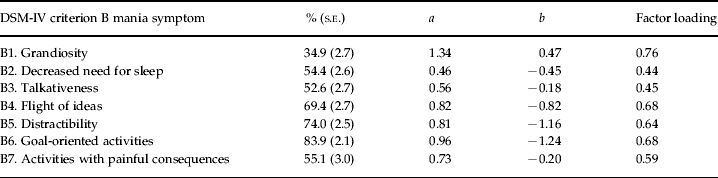
IRT, Item response theory; NSMHWB, National Survey of Mental Health and Well-Being; s.e, standard error.
The a parameters were computed in multilog (Thissen, Reference Thissen2003) and include the 1.702 scaling factor.
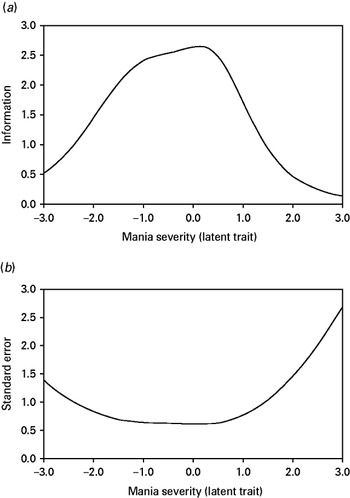
The TIF and SEM are presented in Fig. 2. The seven symptoms provide the highest measurement precision at mild to moderate levels of mania severity (i.e. θ values between −1.25 and 0.5, as measured in standard deviations). However, the precision of measurement of mania severity decreases sharply and the SEM increases sharply as θ increases over 1.0 (i.e. severe pathology). We used the technique of summed-score linking (Orlando et al. Reference Orlando, Sherbourne and Thissen2000) and IRTScore software (Flora & Thissen, Reference Flora and Thissen2002) to estimate the test scores equivalent to each level of the underlying latent spectrum of mania severity. These values are displayed graphically along the upper x axis of Fig. 1. Criterion B for mania is met when an individual endorses three or more of the seven criterion B symptoms; respondents with an IRT score of ⩾ − 0.44 would satisfy criterion B for a diagnosis of mania.
(a) Test information function (TIF) and (b) standard error of measurement (SEM) for the seven DSM-IV criterion B mania symptoms (n = 623).

DIF
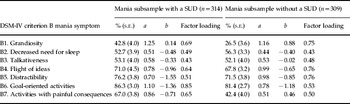
Table 2 outlines the endorsement frequencies, IRT parameter estimates and standardized loadings for the seven DSM-IV criterion B mania symptoms in terms of the subgroups defined according to SUD diagnosis. As Table 2 indicates, with the exception of the decreased need for sleep symptom, those respondents with a SUD endorsed each of the mania symptoms at a higher rate than those respondents who did not have a SUD.
Endorsement frequencies, IRT parameter estimates and standardized factor loadings of the DSM-IV criterion B mania symptoms for those eligible mania respondents in the NSMHWB with a lifetime SUD diagnosis (n = 314) and without a SUD diagnosis (n = 309)

IRT, Item response theory; NSMHWB, National Survey of Mental Health and Well-Being; SUD, substance use disorder; s.e, standard error.
The a parameters were computed in multilog (Thissen, Reference Thissen2003) and include the 1.702 scaling factor.
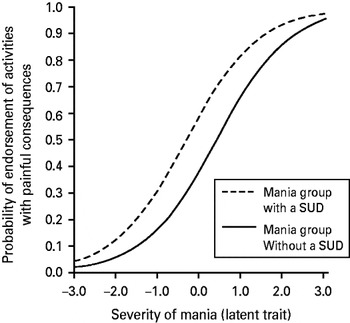
Through the iterative purification process described earlier, four symptoms were identified as being free of DIF (decreased need for sleep, talkativeness, distractibility, increased goal-oriented activities) and so formed the anchor set. The remaining symptoms (grandiosity, flight of ideas, activities with painful consequences) were flagged for DIF and tested against this anchor set. Following the application of the Benjamini–Hochberg procedure for multiple comparisons, a statistically significant group difference was identified in the b parameter for the activities with painful consequences symptom: G 2 (1, n = 623) = 12.5, p < 0.001. As evidenced in Fig. 3, this difference was also clinically significant as the DIF exceeded our 0.25 a priori cut-off (b SUD = − 0.35, b no SUD = 0.38, b difference = − 0.73). Specifically, differences in severity parameter estimates indicated that the activities with painful consequences symptom was endorsed at lower levels of severity, and hence more frequently, by those with a SUD diagnosis than those without a SUD diagnosis. Those with a SUD diagnosis had a mean level of mania severity that was 0.96 (s.d. = 0.38) higher/lower than those in the reference group without a SUD (mean = 0, s.d. = 1).
Differences between the mania groups with and without a substance use disorder (SUD) in the probability of endorsing the activities with painful consequences symptom.

Discussion
Elucidating the latent structure of mania has important theoretical and statistical implications, and holds promise for informing our understanding of etiological and maintenance factors, and improving clinical assessment, the sensitivity and specificity of diagnosis, treatment approaches, and evaluation of clinical intervention strategies. Only one study to date has examined the measurement properties of the DSM-IV criterion B mania symptoms using epidemiologic data from the US population (Agrawal et al. Reference Agrawal, Nurnberger and Lynskey2010). The present study extended this work and is the first to evaluate the psychometric performance of the DSM-IV criterion B mania symptoms in a nationally representative sample of the Australian population. Our findings generally converged with those of Agrawal et al. (Reference Agrawal, Nurnberger and Lynskey2010). Specifically, we similarly found: (1) evidence for a unidimensional latent trait underlying mania; (2) that the increased goal-oriented activities was also the most commonly endorsed symptom, and grandiosity was the less commonly endorsed symptom; (3) that the increased goal-oriented activities symptom tapped the mild end of the mania continuum, and grandiosity tapped the severe end of the continuum; and (4) that grandiosity was also the most highly discriminating symptom. The parallels between the present study and that by Agrawal et al. (Reference Agrawal, Nurnberger and Lynskey2010) are particularly encouraging from a cross-national perspective. Moreover, evidence of unidimensionality is congruent with the broader nosological literature conceptualizing mental disorders according to a dimensional framework (e.g. Brown & Barlow, Reference Brown and Barlow2005).
However, departing somewhat from the findings of Agrawal et al. (Reference Agrawal, Nurnberger and Lynskey2010), we found that the decreased need for sleep symptom poorly discriminated between individuals at low versus high liability to mania. This finding is particularly noteworthy given that decreased need for sleep is often considered to be a hallmark symptom of mania (Plante & Winkelman, Reference Plante and Winkelman2008). Agrawal et al. (Reference Agrawal, Nurnberger and Lynskey2010) observed this finding in their analyses of the NCS-R but not the NESARC. One potential explanation for the divergence between findings may relate to the diagnostic survey instrument. Specifically, both the NSMHWB and NCS-R used the WMH-CIDI whereas the NESARC used the Alcohol Use Disorder and Associated Disabilities Interview Schedule-IV (AUDADIS-IV). The relevant symptom item in the WMH-CIDI reads as follows: ‘Did you sleep far less than usual and still not get tired or sleepy?’, whereas the respective item in the AUDADIS reads as: ‘During that time when (you were the most excited, elated or hyper/you felt the most irritable or easily annoyed), did you need much less sleep than usual?’ Subtle differences in the wording of this item may have contributed to the disparity in findings. The cross-national finding that the decreased need for sleep symptom poorly discriminates between individuals at low versus high liability for mania suggests that this symptom may warrant modification for use in epidemiologic samples. On a related note, it is worthwhile bearing in mind that the BD diagnosis was recalibrated in the WMH-CIDI in light of findings that the CIDI substantially overestimated the disorder (Kessler et al. Reference Kessler, Rubinow, Holmes, Abelson and Zhao1997). This finding does not have a bearing on the above IRT results, which focus on the symptom level, but should be kept in mind when considering the lifetime prevalence estimate of mania noted earlier.
This study contributes important and novel information regarding the evaluation of SUD-related DIF in mania symptomatology. We found that when equating for mania symptom severity, few differences in symptom expression exist among those respondents with and without a lifetime SUD diagnosis. The only symptom that seemed to differentiate these groups was activities with painful consequences; this symptom was endorsed at lower levels of severity, and hence more frequently, by those with a SUD diagnosis compared to those without a SUD diagnosis. These data suggest that treatment providers may need to be particularly cognizant of and assess for the presence of outward, behavioral manifestations of mania at lower levels of severity in dually diagnosed patients. Among individuals not yet diagnosed, this observation may also aid clinical diagnostic decision making and highlight subtle phenomenological differences between these patients.
The above findings should be tempered by some important caveats. As information on mania symptomatology was retrieved by retrospective self-report, recall bias cannot be ruled out. Furthermore, as noted earlier, mania poses diagnostic challenges and clinical interviews are considered to be the gold standard for mania diagnosis (Diler et al. Reference Diler, Uguz, Seydaoglu and Avci2008). An inherent limitation of all large-scale epidemiologic studies of this kind is that the use of lay interviewers who do not possess clinical expertise in the diagnosis of mania may yield less accurate diagnoses. Finally, although IRTLRDIF is particularly useful for evaluating the presence of DIF by identifying differences between groups that are matched in terms of a common underlying latent trait (Uebelacker et al. Reference Uebelacker, Strong, Weinstock and Miller2009; Sunderland et al. Reference Sunderland, Mewton, Slade and Baillie2010), unresolved issues remain. Specifically, this technique is based on the inherent assumption underlying IRT that the latent trait under investigation is normally distributed in the population. In psychiatry, investigations focus on maladaptive behavior and pathology that are unlikely to be characterized by a normal distribution (Sunderland et al. Reference Sunderland, Mewton, Slade and Baillie2010). Woods (Reference Woods2008a) has found that violations of the normality assumption can result in higher Type I error rates, particularly in instances where no anchor set of DIF-free items has been specified. In an effort to reduce the likelihood of Type I errors, we identified an anchor set and applied the Benjamini–Hochberg procedure. Although Woods (Reference Woods2008b) has developed a method to identify the presence of DIF using IRTLRDIF methods in non-normal samples, the approach assumes that a non-normal distribution exists only in the focal group and is not anticipated to perform well if the reference group is treated as normal but is in fact non-normal. In our study we had no reason to presume that the focal group had a non-normal distribution and the reference group had a normal distribution; accordingly, further testing was not conducted (cf. Sunderland et al. Reference Sunderland, Mewton, Slade and Baillie2010).
Finally, in light of the continued controversy surrounding the diagnosis of BD (Kupfer et al. Reference Kupfer, Angst, Berk, Dickerson, Frangou, Frank, Goldstein, Harvey, Laghrissi-Thode, Leboyer, Ostacher, Sibille, Strakowski, Suppes, Tohen, Yolken, Young and Zarate2011) and given that planning for DSM-5 is currently underway, evaluating the measurement properties of the diagnostic criteria for mania is especially timely. Given the relative dearth of research in this area, further research is warranted to determine whether the findings of the present study generalize to other epidemiologic and clinical samples.
Declaration of Interest
None.