Implications
The current study demonstrated that energy intake was clearly the most important variable affecting BW gain of growing cattle. The results showed only marginal effects of protein supply on growth. Owing to limited production responses, higher prices of protein supplements compared with cereal grains and possible increases the N and P emissions, there is generally no benefit from using protein supplementation for growing cattle fed grass silage-based diets.
Introduction
In general, feed costs are a major proportion of total variable costs in most beef systems (French et al., Reference French, O’Riordan, Moloney, O’Kiely and Caffrey2001a and Reference French, O’Riordan, O’Kiely, Caffrey and Moloney2001b). Profitable and efficient beef production demands accurate predictions of intake and production responses to changes in nutrient supply. Huuskonen et al. (Reference Huuskonen, Huhtanen and Joki-Tokola2013) reported that feed intake can be predicted from BW and diet composition in growing cattle with a reasonable accuracy. Expectedly, BW was the most important variable predicting total dry matter (DM) intake (DMI). The intake model was improved when adjusted for dietary variables (NDF concentration, silage DMI-index and concentration of volatile fatty acids). Huuskonen et al. (Reference Huuskonen, Huhtanen and Joki-Tokola2013) concluded that the developed intake models provide potential to improve current ration formulation systems by enabling the prediction of quantitative intake responses, and consequently responses to changes in the nutrient supply, which are prerequisites for any economical model in optimising beef production in various farming systems.
Hulme et al. (Reference Hulme, Kellaway and Booth1986) stated that for optimisation of the margin over feed costs within a herd, accurate prediction of the marginal production responses to the changes in nutrient supply is more important than predicting actual production levels. In lactating dairy cows a meta-analysis by Huhtanen and Nousiainen (Reference Huhtanen and Nousiainen2012) demonstrated that production responses to the changes in nutrient supply could be predicted accurately from a large data set of milk production studies using a mixed model regression analysis. Intake of metabolisable energy (ME) corrected for the effects of feeding level and associative effects of dietary components was the best single variable predicting production responses in dairy cows. Huhtanen and Nousiainen (Reference Huhtanen and Nousiainen2012) concluded that the models can be used in on-farm optimisation of dairy cow rations to maximise milk income over feed costs. Inspired by the dairy cow modelling exercise, we hypothesised that the effects of dietary factors on performance of growing cattle can be predicted from a data set of beef production experiments. Recently, Salah et al. (Reference Salah, Sauvant and Archimède2014) conducted a meta-analysis using data from feeding experiments to predict energy and protein requirements of growing cattle. On the contrary, the objective of this meta-analysis was to develop and validate empirical equations predicting BW gain (BWG) and carcass traits of growing cattle from intake and diet composition variables. The modelling was based on treatment mean data of feeding experiments in growing cattle, in which the nutrient supply was manipulated by wide ranges of forage and concentrate factors. In this paper the model development and implications for practical application are presented and discussed.
Material and methods
Data
A data set was collected from feeding experiments in growing cattle (bulls, steers, heifers) fed ad libitum total mixed rations or ad libitum grass silage, or whole-crop cereal silages (barley, oats or wheat), hay or straw partly or completely substituted for grass silage. The concentrate feeds consisted of cereal grains, fibrous by-products and various protein supplements (mainly rapeseed meal, soya bean meal and fish meal). Variation in the design of experiments, animal performance, experimental diets, feeding routines, etc. between the experiments was substantial covering most practical on-farm feeding alternatives. The minimum prerequisite for an experiment to be included in the data set was that forage and total DMI and initial and final BW of animals were available and adequate forage characterisation (plant species, DM and CP concentration, in vivo or in vitro digestibility of organic matter and fermentation quality) and adequate concentrate characterisation (proportion of ingredients, DM, CP concentration) were available.
Experiments published before 1980, studies using hormonal growth promoters as well as studies shorter than 90 days were not included in the data set. Overall, the data set comprised 553 diets in 116 studies. Forty-nine per cent of the experiments were conducted in the Nordic countries, 45% in the United Kingdom and Ireland and 6% in other countries (e.g. Belgium, Canada and Israel). Approximately 54% of the studies were conducted with pure dairy breeds (Ayrshire, Friesian, Holstein and Nordic Red), 20% with British beef breeds (Aberdeen Angus and Hereford) and their crosses and 26% with Continental beef breeds (Charolais, Limousin, Simmental) and their crosses. Approximately 55% of the studies were conducted with bulls, 35% with steers and 10% with heifers. The list of references used for the meta-analysis is given in Supplementary material S1.
Calculations
For the forages the concentration of total acids was calculated by summing the concentrations of lactic acid and volatile fatty acids (VFA). Forage D-values (digestible organic matter in DM) based on in vitro pepsin-cellulase method were calculated with forage-specific equations (primary growth and regrowth grass, legume and whole-crop silages) (Huhtanen et al., Reference Huhtanen, Nousiainen and Rinne2006). When forage NDF concentration was not reported, it was estimated from other forage parameters (crude fibre, ADF, digestibility) using empirical regression equations derived from the data of Huhtanen et al. (Reference Huhtanen, Nousiainen and Rinne2006). Fat, starch and NDF concentrations of the concentrates were entered when reported; otherwise tabulated values (MTT, 2014) for each ingredient were used. Dietary fat concentration (g/kg DM) was expressed either as total fat analysed as ether extract (EE), concentrate fat (CFat) or estimated forage fat (20 g/kg DM) plus analysed concentrate fat (g/kg DM) (FAT). Dietary carbohydrate concentrations (g/kg DM) were expressed as NDF, starch or non-fibre carbohydrates (NFC). The concentration of NFC was calculated according to National Research Council (2000) as follows:
 $${\rm NFC}={\rm 1}000-{\rm Ash}-{\rm CP}-{\rm EE}-{\rm NDF}$$
where all concentrations are expressed as g/kg DM.
ME concentration was calculated from the concentration of digestible organic matter (DOM) for grass and legume silages using equation:
 $${\rm ME}\left( {{\rm MJ}/{\rm kg}\,{\rm DM}} \right)={\rm 16}.0\left( {{\rm MJ}/{\rm kg}\,{\rm DM}} \right){\times}{\rm DOM}\left( {{\rm kg}/{\rm kg}\,{\rm DM}} \right).$$
For whole-crop silages and straws coefficients of 15.5 and 14.0 instead of 16.0 were used, respectively (MAFF, 1984). For hays the ME concentration was calculated using equation (MAFF, 1984):
 $${\rm ME}\left( {{\rm MJ}/{\rm kg}\,{\rm DM}} \right)={\rm 16}.{\rm 9}{\times}{\rm DOM}\left( {{\rm kg}/{\rm kg}\,{\rm DM}} \right)-{\rm 1}.0{\rm 5}\,.$$
For the concentrate feeds the ME concentration was calculated using tabulated digestibility coefficients (MTT, 2014) and analysed chemical composition.
In the Scandinavian feed protein evaluation system (Madsen et al., Reference Madsen, Hvelplund, Weisbjerg, Bertilsson, Olsson, Spörndly, Harstad, Volden, Tuori, Varvikko, Huhtanen and Olafsson1995), the protein value of the diet is expressed as amino acids absorbed from the small intestine (metabolisable protein (MP)) and the protein balance in the rumen (PBV), which describes the balance between the dietary supply of rumen-degradable feed protein (RDP) and the microbial requirements for RDP. In the present meta-analysis MP and PBV were calculated using the Finnish version (Tuori et al., Reference Tuori, Kaustell and Huhtanen1998; MTT, 2014) of the Scandinavian feed protein evaluation system. Because the ME intake (MEI) and microbial MP are strongly correlated, metabolisable feed protein (feed MP) rather than total MP intake or concentration was used in the modeling of production responses (Huhtanen and Nousiainen, Reference Huhtanen and Nousiainen2012).
If the BWG was not available, it was calculated as a difference between initial and final BW divided by the number of days in experiment. Dressing proportions were calculated as a ratio of carcass weight to final BW. In the majority of the feeding experiments, the carcasses were classified for conformation and fatness using the EUROP quality classification (EC, 2006). For conformation, the development of the carcass profiles, in particular the essential parts (round, back, shoulder), was taken into consideration according to the EUROP classification (E: excellent, U: very good, R: good, O: fair, P: poor). Each level of the conformation scale was subdivided into three sub-classes (e.g. O+, O and O−) to produce a transformed scale ranging from 1 to 15, with 15 being the best conformation. For fat cover degree, the amount of fat on the outside of the carcass and in the thoracic cavity was taken into account using a classification range from 1 to 5 (1: low, 2: slight, 3: average, 4: high, 5: very high). In a few old experiments different national carcass quality classifications were used. However, in all cases the smallest conformation and fat score number described the poorest conformation and leanest fat score, respectively.
Statistical analysis
Deviating properties of BWG were investigated from leverage and influence using the DFFITS i and DFBETAS ji diagnostics, where i=1, 2, …, 553 and j, i denotes the jth regression coefficient in the regression equation (=0 or 1) estimated without observation i, where i=1, 2, 3, …, 553, respectively (Belsley et al., Reference Belsley, Kuh and Welsch1980). Cut-off values suggesting that an observation warrants further examination were set at |DFFITS i |>2√(p/n) and |DFBETAS j,i |>2/√n, where p=number of parameters estimated in the model and n=total number of observations. After removing outliers the dataset contained a total of 527 treatment means.
In order to explore the relationships between the variables of interest (BWG, carcass characteristics) data were analysed by regression analysis using the MIXED procedure of SAS (Littell et al., Reference Littell, Milliken, Stroup and Wolfinger1996) and the following model:
 $$Y_{{ij}} ={\rm B}_{0} {\plus}{\rm B}_{{\rm 1}} {\rm X}_{{{\rm 1}ij}} {\plus}{\rm b}_{0} {\plus}{\rm b}_{{\rm 1}} {\rm X}_{{{\rm 1}ij}} {\plus}{\rm B}_{{\rm 2}} {\rm X}_{{{\rm 2}ij}} {\plus}\,\ldots\,\,{\rm B}_{{\rm 4}} {\rm X}_{{{\rm 4}ij}} {\plus}e_{{ij}} ,$$
where: Y ij is the expected value for the dependent variable Y observed at level of j of the independent variable X in the study i, B0 is the overall intercept (fixed effect), b0 is the random effect of study i (i=1 … 116), B1 … B4 are regression coefficients for X1 … X4 of Y across all studies (fixed effects), X1ij …X4ij =value j of the continuous variable X1 … X4 in study i, b i is the random effect of study i on the regression coefficient of Y on X1 in study i, and e ij is the residual error.
In different models the number of independent variables was 1–4. The model included two random statements: a random intercept and slope of X1 with SUBJECT=Study, using a TYPE=UN (unstructured variance-covariance structure matrix for the intercepts and slopes). Only one random independent variable was used to avoid over-parameterised models (St-Pierre, Reference St-Pierre2001). The models were evaluated on the basis of corrected Akaike’s information criterion (AIC) and residual variance. Root mean squared errors (r.m.s.e.) presented in the tables were adjusted for random study effects.
The models predicting BWG was developed stepwise. First, linear and quadratic functions of total MEI (MJ/day) and MEI per kg BW0.75 were evaluated. Second, different protein (CP, Feed MP, MP, RDP, rumen-undegraded protein (RUP), effective protein degradability (EPD)), fat (EE, CFat and FAT) and carbohydrate (NDF, forage NDF, NFC, starch, proportion of concentrate) variables and dietary ME concentration evaluated. In addition to one intake variable dietary concentrations were used in multivariate models, since they are less correlated with the intake variables than the correlation between intake variables. Third, different combinations of protein, fat and carbohydrate variables were compared to determine the best combination of these variables. In the following step, the quadratic effects of each protein, fat and carbohydrate variable were evaluated. Collinearities were evaluated by variance inflation factors. The variable was included in the final models if P-value was <0.10.
The validation of the robustness of the final BWG model was conducted by splitting randomly the dataset experiment-wise into model development and model validation data (n=249 and 278 observations). In this case, model development and validation datasets were completely independent of each other. Root mean square error of cross-validation was calculated as r.m.s.e.CV=√∑ (observed−predicted)2/n]. Observed values were adjusted for the random study effect.
Residual analysis was conducted as described by St-Pierre (Reference St-Pierre2003) by regressing predicted values on residuals (observed−predicted). Predicted values were centred by subtracting the mean of all predicted values from each prediction. This makes the slope and intercept estimates in the regression orthogonal and, thus, independent. Mean biases were assessed using the intercepts of the regression (deviation from zero) equations and the slopes of the regression equations were used to determine the presence of linear biases (deviation from unity).
Results
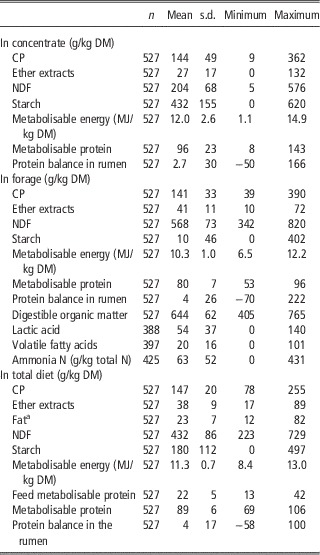
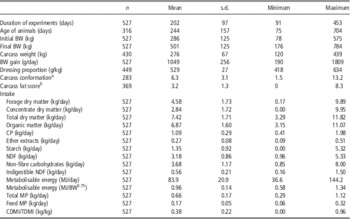
The forage and concentrate components of the diets as well as the total diets displayed wide ranges in chemical composition and calculated feeding values (Table 1). On average, the silages were well fermented, but the maximum values of silage ammonia N and VFA concentrations indicate that the data sets also included some extensively and poorly fermented silages. Total DMI ranged from 3.3 to 11.8 kg/day reflecting differences in BW of the animals and the intake potential of the diets (Table 2). The large variation in BWG (from 190 to 1809 g/day) reflects differences in age and genetic potential of the animals and nutritive value and intake potential of the diets.
Description of the experimental feeds and diets in the data set used for developing models to predict BW gain of growing cattle

DM=dry matter.
a Fat=estimated forage fat (20 g/kg DM)+analysed concentrate fat (g/kg diet DM)
Mean feed and nutrient intakes, BW, BW gain and carcass characteristics in data set used for developing models to predict BW gain of growing cattle

MP=Metabolisable protein; CDMI=concentrate dry matter intake; TDMI=total dry matter intake.
a Conformation score: 1=poorest; 15=excellent.
b Fat score: 0=leanest; 10=fattest.
BWG increased with increasing MEI (Table 3), but the responses diminished with increased intake (quadratic effect P<0.001). Expressing MEI per BW0.75 improved the model in terms of AIC. The effect of BW was negative when MEI was expressed as MJ ME/day and positive when intake was expressed as MJ ME/BW0.75. The models were slightly improved by using BW0.75 rather than BW (Table 3).
Relationships between energy intake parameters and BW gain (g/day) in growing cattle estimated by a mixed model regression analysis

Adj. r.m.s.e.=residual mean squared error adjusted for random study effects; AIC=Akaike’s information criteria (corrected).
a MEIMBW=metabolisable energy intake (MJ/BW0.75), MEI=metabolisable energy intake (MJ/day).
b MEIMBW2=MEIMBW (MJ/BW0.75)×MEIMBW (MJ/BW0.75), MEI2=MEI (MJ/day) × MEI (MJ/day).
c BW=BW (kg), MBW=metabolic BW (kg).
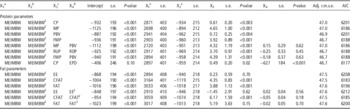
The effects of dietary protein and fat variables on BWG are shown in Table 4 when included in the quadratic model of MEI (MJ ME/kg BW0.75). Increased protein supply had a positive (P<0.01) effect on BWG. Models based on either the concentrations of total MP or Feed MP slightly improved the predictions compared with CP. The effects of PBV or RDP were non-significant when they were used as independent variables with MP or RUP. The best model in terms of the smallest AIC was a combination of CP concentration and EPD.
Relationships between protein and fat parameters and BW gain (g/day) in growing cattle estimated by a mixed model regression analysis

Adj. r.m.s.e.=residual mean squared error adjusted for random study effects; AIC=Akaike’s information criteria (corrected).
a MEIMBW=metabolisable energy intake (MJ/BW0.75).
b MEIMBW2=MEIMBW (MJ/BW0.75)×MEIMBW (MJ/BW0.75).
c CP=CP (g/kg diet DM), MP=metabolisable protein (g/kg diet DM), PBV=protein balance in the rumen (g/kg diet DM), FMP=feed MP=feed metabolisable protein (g/kg diet DM), RUP=rumen undegraded protein (g/kg diet DM), EE=ether extracts (g/kg diet DM), CFAT=concentrate fat (g/kg diet DM), FAT=estimated forage fat (20 g/kg DM)+analysed concentrate fat (g/kg diet DM).
d RDP=rumen degraded protein (g/kg diet DM), EPD=effective protein degradability (kg/kg), EE2=EE (g/kg diet DM)×EE (g/kg diet DM), CFAT2=CFAT (g/kg diet DM)×CFAT (g/kg diet DM), FAT2=FAT (g/kg diet DM)×FAT (g/kg diet DM).
e All significant, P<0.001.
Dietary concentration of EE had no effect on BWG, but dietary fat calculated assuming a constant true fat concentration in forages (20 g/kg DM) (FAT) or concentrate fat (CFat) in diet DM had a positive effect on BWG when included in the quadratic model of MEI per kg BW0.75 (Table 4). Quadratic effects of any fat variable were not significant.
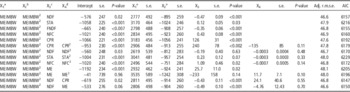
Dietary concentration of total NDF and forage NDF were negatively (P<0.05) and concentrations of NFC, starch and ME were positively (P<0.05) related to BWG (Table 5). The models were not improved by including the quadratic term of these variables in the model. Differences between NDF, forage NDF and NFC in the model performance were small.
Relationships between carbohydrate parameters and BW gain (g/day) in growing cattle estimated by a mixed model regression analysis

Adj. r.m.s.e.=residual mean squared error adjusted for random study effects; AIC=Akaike’s information criteria (corrected).
a MEIMBW=metabolisable energy intake (MJ/BW0.75).
b MEIMBW2=MEIMBW (MJ/BW0.75)×MEIMBW (MJ/BW0.75).
c NDF=NDF (g/kg diet DM), STA=starch (g/kg diet DM), FNDF=forage NDF (g/kg diet DM), NFC=non-fibre carbohydrates (g/kg diet DM), CPR=concentrate proportion in diet (proportion: 0–1), ME=metabolisable energy (MJ/kg diet DM).
d CPR2=CPR×CPR, NDF2=NDF×NDF, STA2=STA×STA, NFC2=NFC×NFC, ME2=ME×ME.
e All significant, P<0.001.
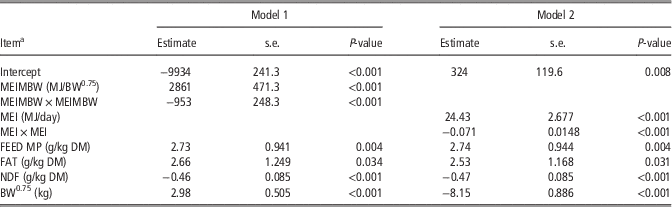
Final models based on MEI (MJ/day, MJ/kg BW0.75) and diet variables are presented in Table 6. Although diet variables had significant effects on BWG, their contribution to the improvement of the model was small. Compared with the best models based only on MEI, the additional feed variables decreased adjusted r.m.s.e. by only about 2 g/day. Ranking of different diet variables did not change when different combinations were compared in the complete model (models not shown). Feed MP rather than total MP was included in the final model, since it is less correlated to dietary ME concentration than total MP. None of the quadratic terms of feed variables were significant (P>0.10) when included in the final models. Neither any additional feed variable (e.g. silage fermentation products, forage D-value) had significant effect on BWG (models not shown).
Two best-fit equations of responses to nutrient supply and metabolic BW for BW gain (g/day) in growing cattle

Model 1: adjusted residual mean squared error (r.m.s.e.)=45.4, Akaike information criteria (AIC)=6103; Model 2: adjusted r.m.s.e.=45.8, AIC=6140.
a MEIMBW=metabolisable energy intake (MJ/BW0.75), MEI=metabolisable energy intake (MJ/day), FEED MP=feed metabolisable protein (g/kg DM), FAT=estimated forage fat (2%)+analysed concentrate fat (g/kg DM), NDF=NDF (g/kg DM).
The relationship between predicted and observed BWG together with residual plots of model validation are presented in Figure 1. Root mean square prediction error was 60 with mean slope and random error contributing 21%, 3% and 78% to the total error variance, respectively. Mean bias was 28 g/day (P=0.13) and slope bias (deviation from unity) 0.052 (P=0.12).
Relationship between predicted and observed BW gain (BWG) (above) and residual analysis (below) in growing cattle. Predicted values are centred by subtracting the observed BWG from each predicted BWG

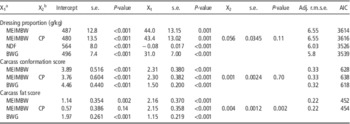
The effects of MEI and diet CP concentration on carcass traits are shown in Table 7. Increased MEI (MJ/BW0.75) improved both dressing proportion (P<0.01) and carcass conformation (P<0.001) and increased (P<0.001) carcass fat score. Increased dietary CP concentration had no significant (P>0.10) effect on dressing proportion or carcass conformation score, but it increased (P<0.01) carcass fat score. However, although significant, the effect of CP concentration on fat score was quantitatively marginal. Increased dietary NDF concentration decreased (P<0.001) dressing proportion (Table 7). Increased BWG was associated with greater dressing proportion, improved conformation and increased fat score.
Prediction of dressing proportion, carcass conformation and carcass fat score of growing cattle based on diet variables

Adj. r.m.s.e.=residual mean squared error adjusted for random study effects; AIC=Akaike’s information criteria (corrected).
a MEIMBW=metabolisable energy intake (MJ/BW0.75), NDF=NDF (g/kg DM), BWG=BW gain (kg/day).
b CP=CP (g/kg diet DM).
Discussion
Data
As Table 2 shows also both relatively young and old animals are present in the database. The young animals in the database are dairy bulls and heifers reared for beef production, since in the Nordic countries the majority of beef has been traditionally produced by dairy breeds (Pesonen et al., Reference Pesonen, Honkavaara and Huuskonen2012). Generally dairy calves for beef production are weaned at 2–3 months of age (BW 70–100 kg) after which they are fed forages and concentrates without milk or milk replacers. On the other hand, it is currently typical in Finland that bulls of Continental beef breeds are slaughtered in carcass weight above 400 kg (Pesonen et al., Reference Pesonen, Honkavaara and Huuskonen2013a). In addition, carcass weights have risen due to the pricing scheme that favours heavier animals (Herva et al., Reference Herva, Huuskonen, Virtala and Peltoniemi2011), and direct or indirect selection for increased mature size of animals (Liinamo, Reference Liinamo2000).
In the present study, the evaluation of breed, sex and age effects would be uncertain because there was no cross-classification, that is the effects of these factors were confounded with other random experimental effects. Therefore, these effects were not included in the statistical model. As stated in the introduction, for optimisation of the margin over feed costs within a herd, accurate prediction of the marginal production responses to the changes in nutrient supply is more important than predicting actual production levels.
BWG responses to ME intake
The quadratic effect of MEI on BWG can be associated with greater energy concentration of BWG with increased intake and gain (ARC, 1980; National Research Council, 2000) and to reduced dietary ME concentration with increased intake. Diet digestibility, and consequently ME concentration decrease with increased feeding level (Yan et al., Reference Yan, Agnew and Gordon2002; Huhtanen et al., Reference Huhtanen, Rinne and Nousiainen2009), but the effects on ME are smaller than on digestibility as both proportion of methane and urinary energy of gross energy (GE) decrease with increasing feeding level (Yan et al., Reference Yan, Agnew and Gordon2002). In the present study, the MEI was estimated using digestibility coefficients at maintenance, which implies that MEI can be overestimated at higher levels of intake, and consequently marginal BWG response to incremental MEI would be underestimated. In addition to greater energy concentration of BWG and decreased metabolisability with increased intake, curvilinear relationship between energy retention and MEI can explain diminishing BWG responses with increased intake. The analysis by Blaxter and Boyne (Reference Blaxter and Boyne1970) and Blaxter (Reference Blaxter1974) demonstrated that energy retention per unit of MEI (ME utilisation for growth) decreases as feed intake increases. The lack of significant effects of other feed characteristics (e.g. silage fermentation, D-value) suggests that the effects of these factors on BWG were mediated mainly through intake responses. This indicates that the relatively simple ME-formulas predict well the nutritional value of roughages.
BWG responses to dietary protein and fat concentrations
Although statistically significant, the magnitude of BWG responses to increased protein supply was small. When scaled to ±1 s.d. unit differences in dietary CP concentration (±20.5 g CP/kg DM), the BWG response (±12.5 g/day) was only 7% of that (±177 g/day) achieved per ±1 s.d. unit (0.137 MJ/kg BW0.75) change in MEI. The ranking of protein variables in predicting BWG responses was similar compared to our previous study evaluating the responses to supplementary protein feeding in growing cattle (Huuskonen et al., Reference Huuskonen, Huhtanen and Joki-Tokola2014), with models taking into account ruminal CP degradability being slightly better than models based on CP. The regression coefficient of BWG on dietary CP concentration (0.6 g/day per g CP/kg DM) was only about half of that (1.3) found in our earlier analysis from protein supplementation studies (Huuskonen et al., Reference Huuskonen, Huhtanen and Joki-Tokola2014). However, the corresponding coefficients on MP concentration (4.7 v. 5.1) were similar. These results suggest that BWG responses to increased dietary CP concentration were greater when dietary CP concentration was manipulated by supplementary protein feeding rather than by other strategies (e.g. forage CP concentration, forage to concentrate ratio). Consistent responses to increased dietary MP concentration suggest that the protein evaluation system (MTT, 2014) ranked productive value of MP from different dietary sources well. Small BWG responses to feed MP indicate that microbial protein and RUP from forage and energy supplements meet the protein requirements of growing cattle.
Dietary concentrations of total and concentrate fat were positively associated with BWG, whereas no relationship was found between EE and BWG. This is most likely because forage ether extract contains waxes, chlorophyll, galactose and other non-fatty acid compounds (Van Soest, Reference Van Soest1994), and in silage also VFAs are analysed partly as EE. In the current data set dietary fat concentration was altered mainly by variation in fat concentration of concentrate ingredients; only in three studies the effects of supplementary fat were investigated. Significant positive effect of fat on BWG agrees with theoretical concepts that the efficiency of ME utilisation of fat is greater than that of carbohydrates, and especially of protein (Owens et al., Reference Owens, Gill, Secrist and Coleman1995). However, BWG responses to supplementary fat have been variable and, for example, Tesfa et al. (Reference Tesfa, Tuori and Syrjälä-Qvist1992) reported reduced BWG for bulls fed different supplementary fat sources compared to control diet without fat supplementation.
BWG responses to dietary carbohydrate concentration
The negative effect of increased dietary NDF concentration on BWG at fixed MEI agrees with the findings of Reynolds et al. (Reference Reynolds, Tyrrell and Reynolds1991) from a respiration chamber and liver metabolism study. Beef heifers were fed at two levels of intake isonitrogenous diets containing 75% lucerne or 75% concentrate on DM basis. At equal MEI heifers fed the 75% concentrate diet produced less heat energy and retained more tissue energy than when fed the 75% lucerne diet. Greater portal-drained viscera (PDV) uptake of oxygen accounted for 72% of the decrease in tissue energy of heifers fed 75% lucerne diet. Reynolds et al. (Reference Reynolds, Tyrrell and Reynolds1991) suggested that one component of the difference in PDV use of oxygen between diets is the work of digestion, especially the work of rumination and digesta movement. Consistently with these observations, increasing PDV use of oxygen per unit increase in ME was greater in Holstein steers fed orchard grass silage than when fed lucerne silage of similar ME concentration (Varga et al., Reference Varga, Tyrrell, Huntington, Waldo and Glenn1990). Differences in the utilisation of ME for growth between these diets measured by indirect calorimetry was accompanied with changes in diet NDF content, digestibility of silages and gut fill.
The negative effect of increased NDF concentration on BWG at a constant MEI per BW0.75 is consistent with the negative effect of q-value (proportion of ME of GE) in feed evaluation systems. In the ARC (1980) system, the efficiency of ME-utilisation (kf) is related to q-value as follows: kf=0.78×q+0.006. Assuming a GE concentration of 18.5 MJ/kg DM, the mean q-value in the current dataset was 0.61 (s.d.=0.038) and calculated kf 0.48 (s.d.=0.030), respectively. In the bivariate equation predicting (BWG=ME/MBW+kf), the regression coefficient of kf (929±326) was significant (P<0.01). An increase of 0.01 in kf corresponded to 9.3 g/day increase in BWG at a constant MEI per BW0.75. This value is only about 30% of the value (32 g) calculated at MEI of 1 MJ/day per kg BW0.75 using the relationship between q-value and kf in the ARC (1980) system and assuming a constant energy concentration of BWG. This suggests that the effect of q-value on observed BWG at constant MEI was relatively much smaller than the predicted responses in energy retention. However, in carcass gain the difference is probably smaller since dressing proportion was positively related (P<0.001) to q-value.
The best-fit equations
According to AIC, the model based on MEI per BW0.75 is more likely to give the best explanation for BWG compared to the model based on the total MEI. This could be because MEI per BW0.75 scales the intake relative to the maintenance requirement. Intake of ME was clearly the most important factor influencing BWG in spite of large variation in diet composition both between and within studies. The importance of MEI can be illustrated by comparing BWG responses per s.d. unit variation in independent variables. In the linear MEI (MJ/kg BW0.75) model, one s.d. (±0.137 MJ ME/kg BW0.75) was equal to ±177 g/day. The corresponding s.d. and BWG responses for dietary concentrations of NDF, FAT and Feed MP were ±86 g/kg DM and ±39 g/day, ±7.4 g/kg DM and 19 g/day, and ±4.8 g/kg DM and ±13 g/day, respectively. The effect of diet NDF concentration is associated with its inverse relationship to ME concentration, and consequently to q-value and efficiency of ME utilisation for growth.
The model was validated by dividing the data randomly into two independent subsets, of which one was used for model development and the other for model evaluation. Relatively small increase in prediction error (from 45 to 60 g/d) with small mean and slope biases suggest that the developed model is robust. Relative to s.d. between diets within a study (±138 g/day) both mean and slope bias were small.
Carcass traits
The increasing effect of increased MEI and BWG on dressing proportion agrees with previous results (Caplis et al., Reference Caplis, Keane, Moloney and O’Mara2005; Keane et al., Reference Keane, Drennan and Moloney2006; Pesonen et al., Reference Pesonen, Honkavaara, Kämäräinen, Tolonen, Jaakkola, Virtanen and Huuskonen2013b). This is obvious because forages, generally, promote a greater gut fill compared to concentrates (ARC, 1980; Owens et al., Reference Owens, Gill, Secrist and Coleman1995). In addition, for each type of forage there is a negative relationship between ME concentration (and digestibility) and gut fill. For example, fill with early-cut hay or silage (DM digestibility 69%) was about 20% less than with late-cut roughages (DM digestibility 62%) (ARC, 1980). A positive relationship between diet NDF concentration and gut fill has been reported earlier, for example, by Pond et al. (Reference Pond, Ellis, Lascano and Akin1987) and Rinne et al. (Reference Rinne, Huhtanen and Jaakkola1997). In the present meta-analysis, increasing MEI improved also carcass conformation which is consistent with Aronen et al. (Reference Aronen, Lampila and Hepola1994), Caplis et al. (Reference Caplis, Keane, Moloney and O’Mara2005) and Pesonen et al. (Reference Pesonen, Honkavaara, Kämäräinen, Tolonen, Jaakkola, Virtanen and Huuskonen2013b). The increase in carcass fat score with increasing dietary energy level is in line with many published reports (Martinsson and Olsson, Reference Martinsson and Olsson1993; Keane and Allen, Reference Keane and Allen1998; Patterson et al., Reference Patterson, Steen, Moore and Moss2000; Keane et al., Reference Keane, Drennan and Moloney2006; Pesonen et al., Reference Pesonen, Honkavaara, Kämäräinen, Tolonen, Jaakkola, Virtanen and Huuskonen2013b).
In accordance with earlier meta-analysis (Huuskonen et al., Reference Huuskonen, Huhtanen and Joki-Tokola2014) and feeding experiments (Huuskonen, Reference Huuskonen2011 and Reference Huuskonen2013; Pesonen et al., Reference Pesonen, Honkavaara, Kämäräinen, Tolonen, Jaakkola, Virtanen and Huuskonen2013b and Reference Pesonen, Joki-Tokola and Huuskonen2014), protein supplementation had no effects on the dressing proportion or carcass conformation score. Consistently with the present meta-analysis, Huuskonen et al. (Reference Huuskonen, Huhtanen and Joki-Tokola2014) observed that increased dietary CP concentration increased carcass fat score of growing cattle. Also Steen (Reference Steen1988b) and Steen and Moore (Reference Steen and Moore1988 and Reference Steen and Moore1989) found that increasing protein intake tended to increase carcass fatness, although the effects only reached significance when the combined results of a series of experiments were analysed together (Steen Reference Steen1988a). Information on the reasons for increased fat deposition with increased protein intake is limited. However, increase in dietary CP is often associated with extra dietary fat (from protein meals) and gluconeogenic amino acids as well as slightly improved diet digestibility (Huhtanen et al., Reference Huhtanen, Rinne and Nousiainen2009), possibly contributing to extra energy which can result in increased carcass fat. In wether sheep, Waghorn et al. (Reference Waghorn, Flux and Ulyatt1987) found that increasing protein intake reduced circulating growth hormone concentrations and increased fat synthesis.
Conclusions
The current study using mixed model regression analysis demonstrated that MEI per BW0.75 was clearly the most important variable explaining growth response in growing cattle. The effect of increased ME supply displayed diminishing responses that could be associated with increased energy concentration, reduced diet metabolisability and/or decreased efficiency of ME utilisation for growth with increased intake. Negative effects of increased dietary NDF (energy) concentration on BWG were smaller compared to responses that energy evaluation systems predict for energy retention. The present results showed only marginal effects of protein supply on BWG in growing cattle.
Acknowledgements
The authors wish to thank the Centre for Economic Development, Transport and the Environment for Northern Ostrobothnia for partial funding of the project.
Supplementary material
To view supplementary material for this article, please visit http://dx.doi.org/10.1017/S1751731115000610